J. Kissel, R. Savage, E. Goetz, D. Tuyenbayev
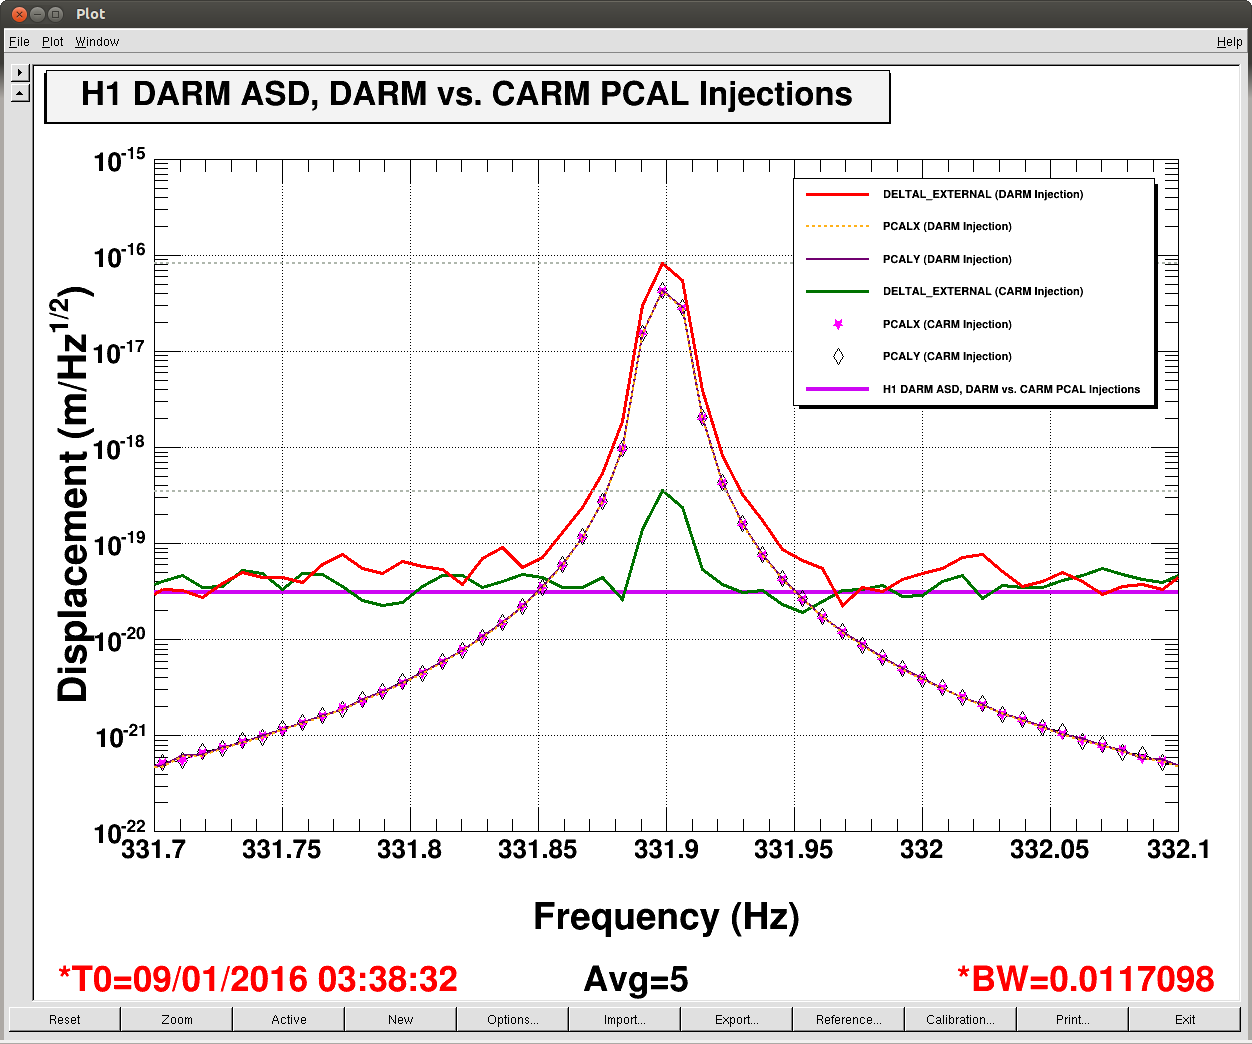
We've replicated a study similar yesterday (LHO aLOG 24784) to what LLO has done in early December (see LLO aLOG 23184), in order to confirm/demonstrate the Delta L = Lx - Ly (i.e. no factors of 1/2) convention for the calibration. In addition, we confirm the accuracy of the relative calibration between PCALX and PCALY by comparing a true CARM and true DARM excitation.
In summary,
- When the PCALs are driven exactly 180 [deg] apart at equal amplitude (i.e. "true DARM," where
amplitude is predicted by PCAL), the DARM displacement (i.e. Delta L = Lx - Ly, as measured by
the IFO) is twice the amplitude. Convention confirmed!
- Comparing the ratio of a true CARM (driven hard enough that some residual DARM is visible in DELTAL_EXTERNAL) and true
DARM excitation (again in DELTAL_EXTERNAL), the ratio of CARM / DARM = 0.004, or 0.4%. This indicates that the relative
calibration between the two PCALs better than 0.4%.
Very good!
Details
%%%%%%%%%%%%%%
-----------------------------------
Setting the amplitude of excitation
-----------------------------------
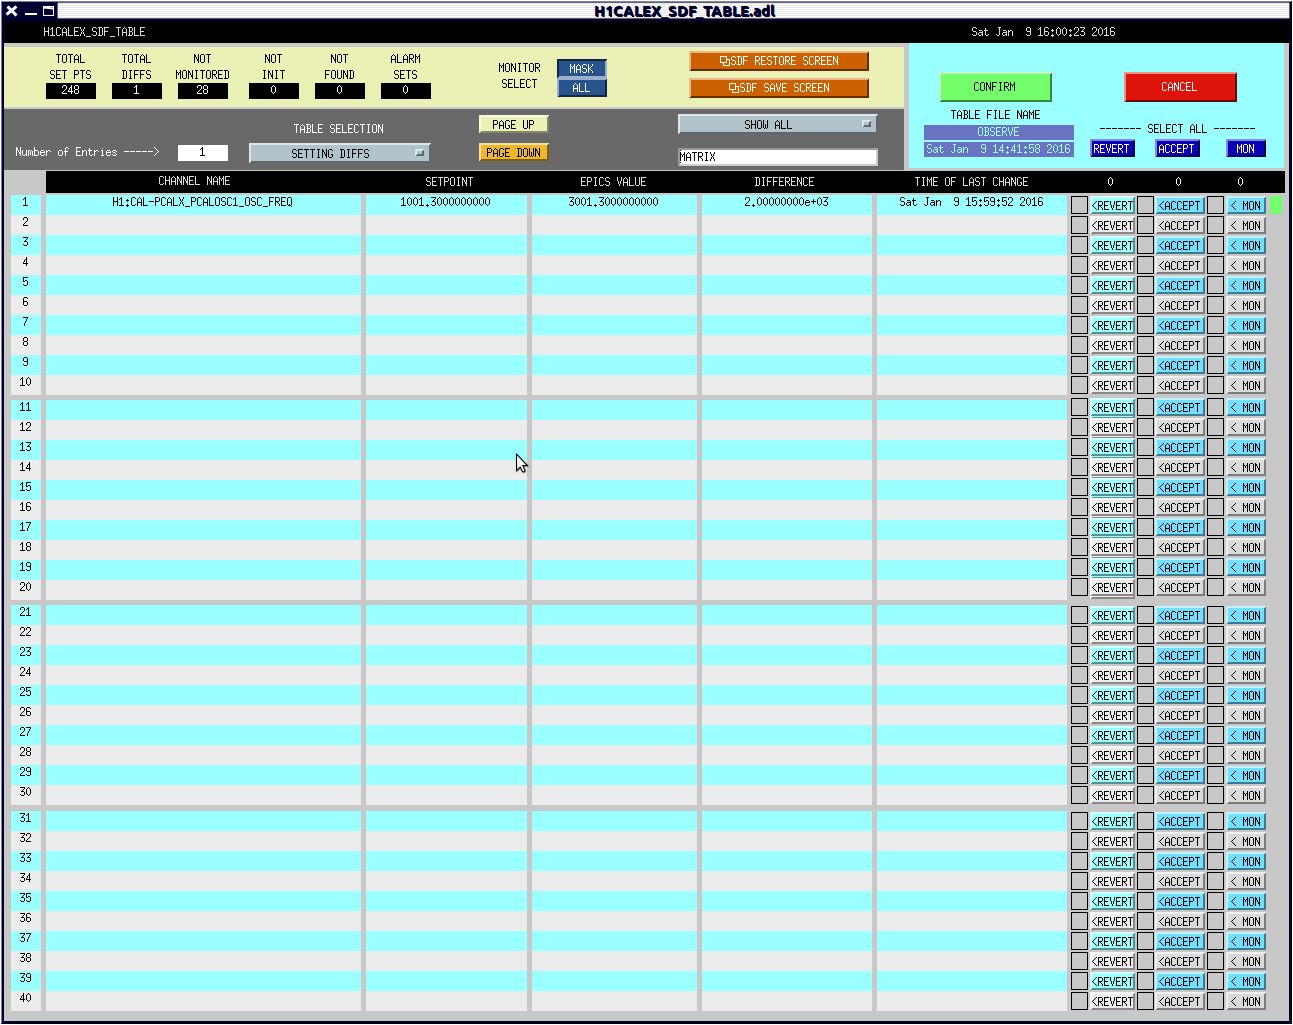
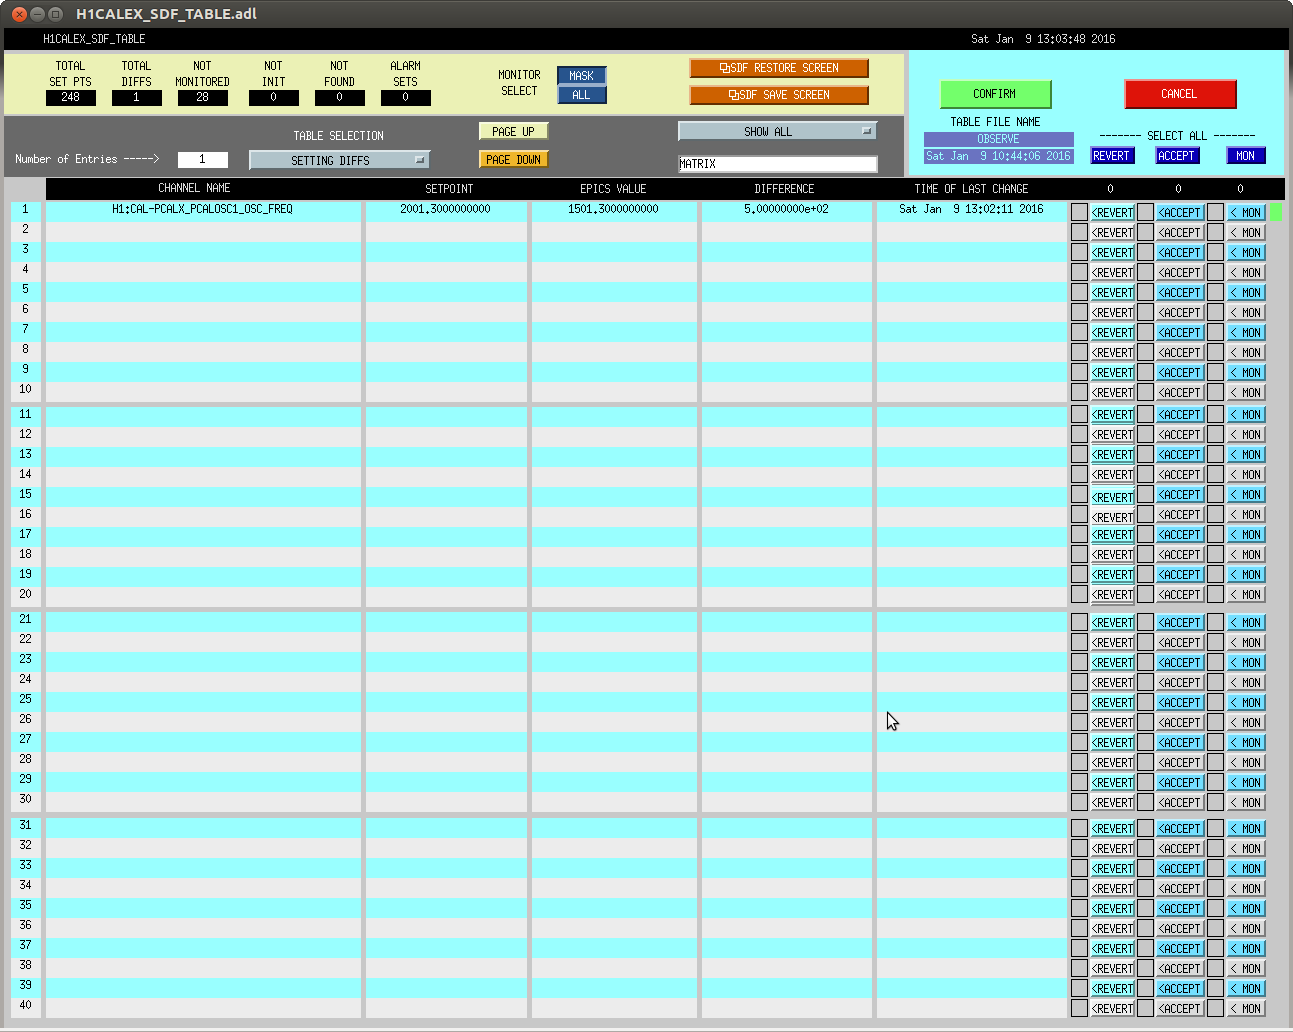
In order to set up PCALX to drive at exactly the same amplitude as PCALY, we followed Shivaraj's procedure from LLO aLOG 24043, but not perfectly. In step 3 of his procedure, he determined the amplitude ratio between digitally requested counts of drive at PCALY vs PCALX end assuming the Optical Follower Servo (OFS) PD has been well-calibrated into force on the test mass (Newtons), such that the relative offset in the PCALY and PCALX servo represents the relative amplitude ratio of digitally requested drive to impose the same amount of force on the test mass. LHO's OFS PDs have not yet been into Newtons.
Instead, we use each PCAL's main TX PDs, which *have* been well-calibrated into Newtons, and take the ratio of the TX PD (in Newtons) to OFS PD (in Volts),
TX PD(X) N (X) TX PD(Y) N (Y)
------ = --- and -------- = --- .
OFS PD V OFS PD V
These transfer functions are frequency independent. Further, the OFS PD Volts are proportional the DAC counts [ct] of the oscillator such that
TX PD (Y) OFS PD
X Drive [ct] . ------ . ------ = Y Drive [ct]
OFS PD TX PD (X)
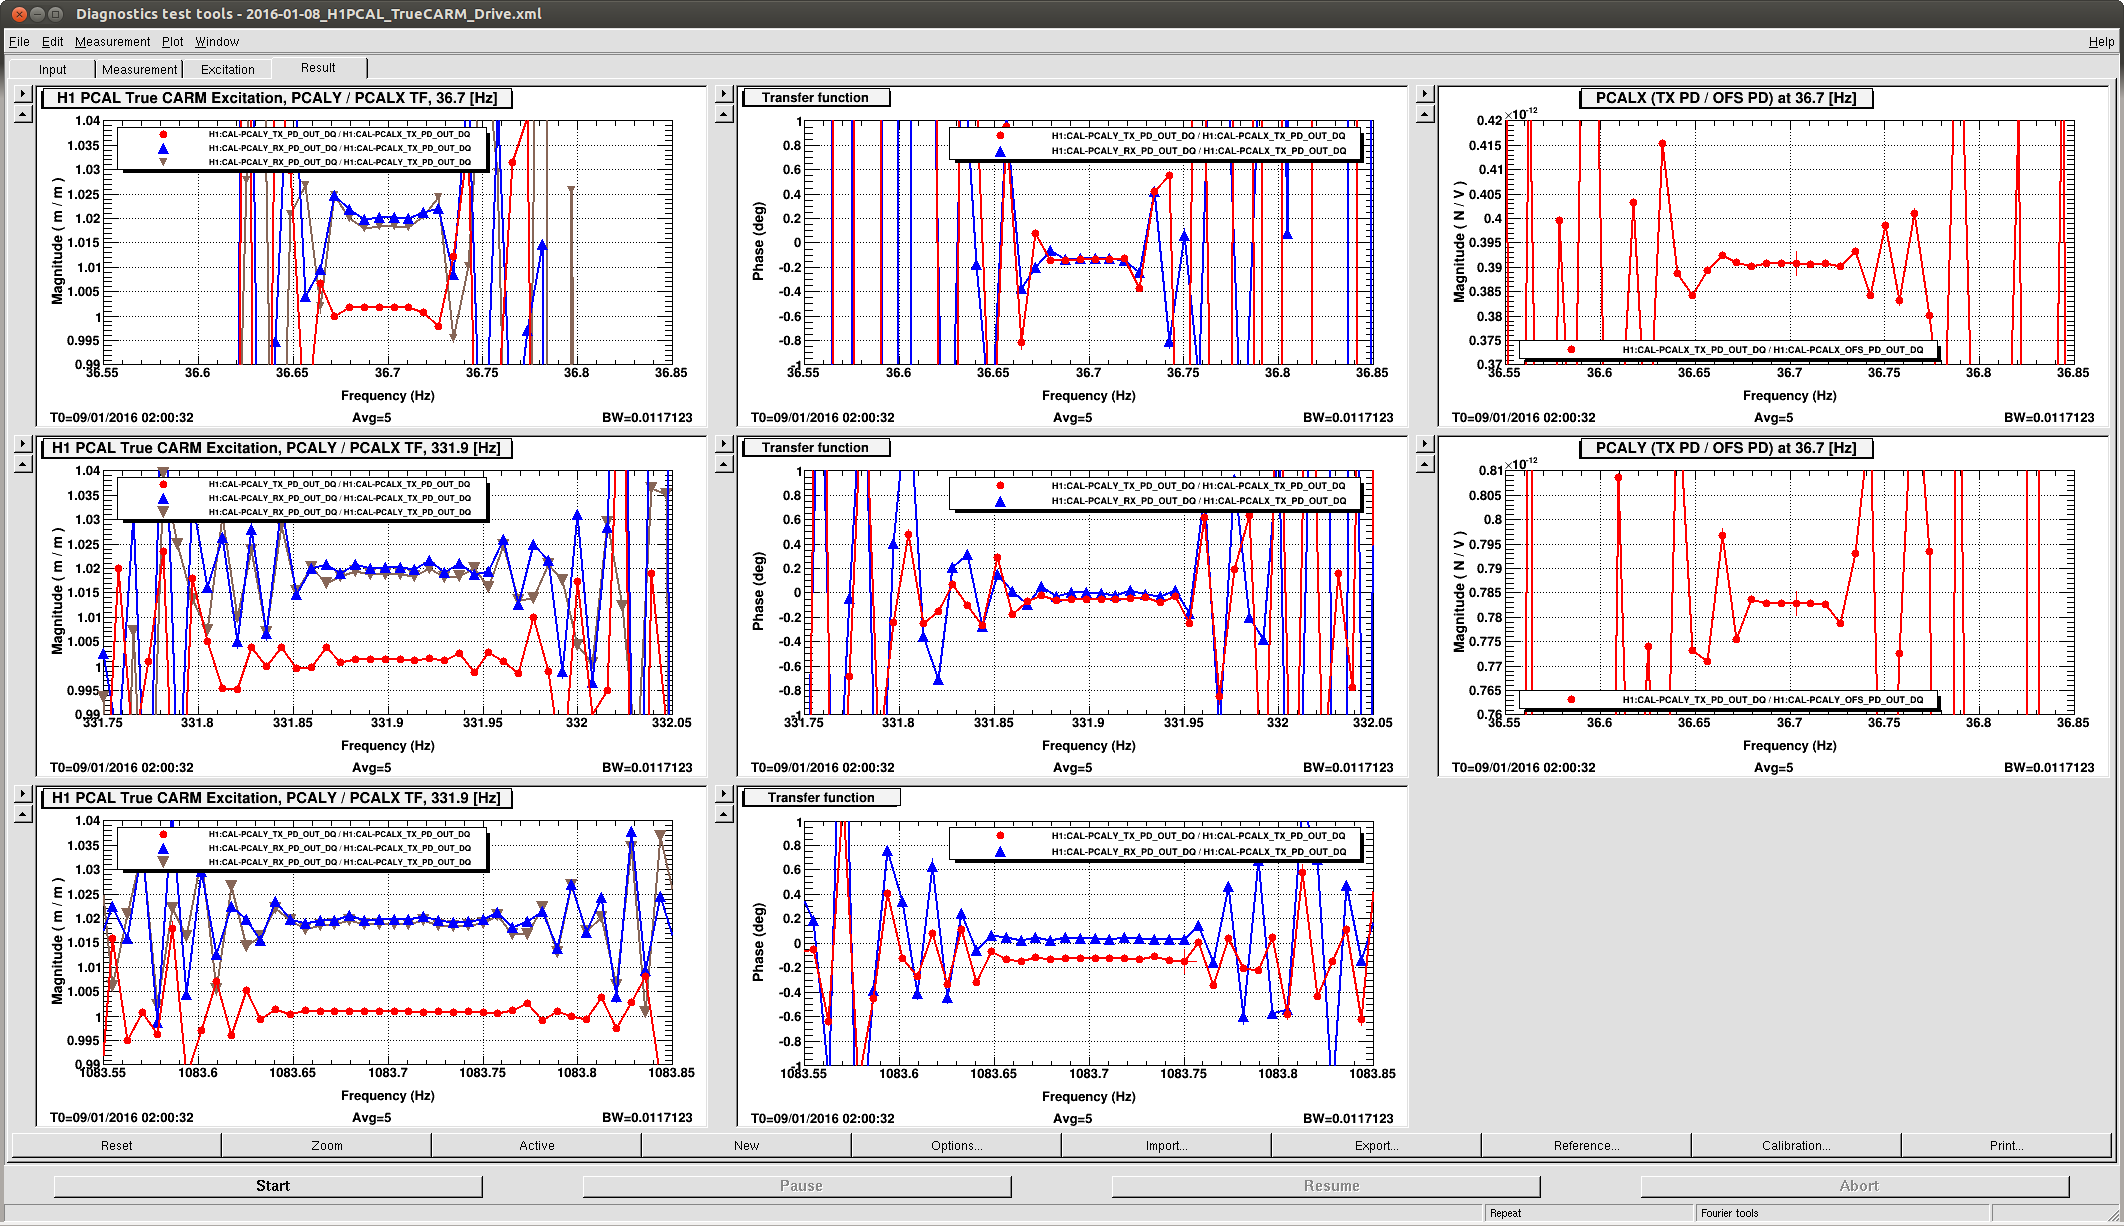
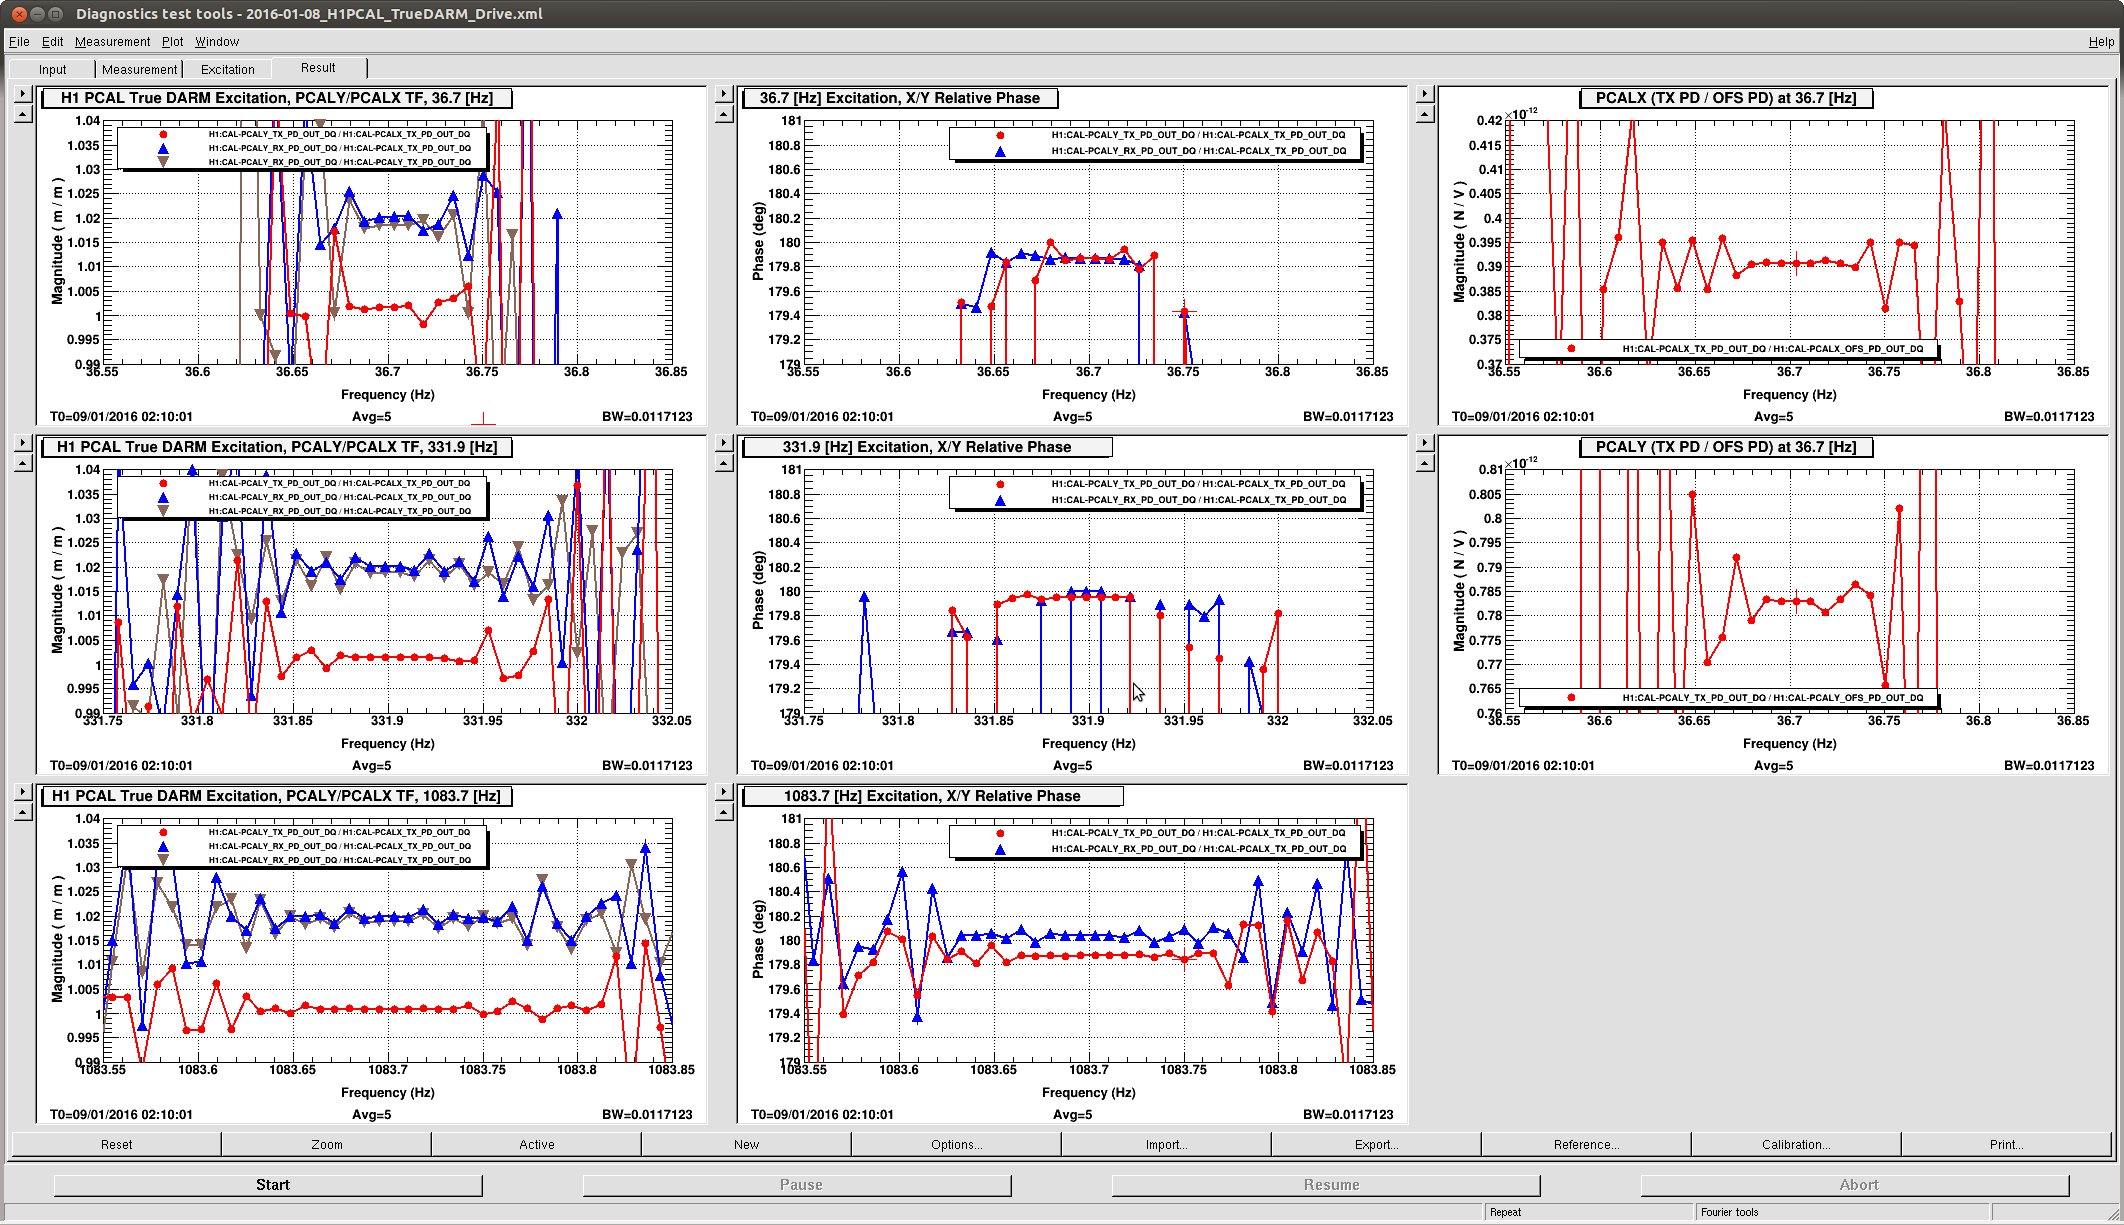
These transfer functions, taken at 36.7 [Hz] are shown in the right-most panels of the two attachments 2016-01-08_H1PCAL_TrueCARM_Drive_TXRX_TF.png and 2016-01-08_H1PCAL_TrueDARM_Drive_TXRX_TF.png. Conveniently, the ratio of transfer functions happens to be 2.00. So, we need to drive the X end exactly twice as hard as as the Y end.
Once the amplitude is identical at both PCALs, the phase is tuned as described in Shivaraj's procedue, such that the PCALs are driving at the same phase to achieve pure CARM excitation. Remember, both the Sine and Cosine amplitudes must be ON and the same, for this whole phasing thing to work. For simplicity, we -- like Shivaraj -- just chose the same three frequencies that are on PCALY all the time, 36.7, 331.9, and 1083.7 [Hz] and at roughly their normal amplitudes (100, 1500, and 7500 [ct] respectively). The phase is tuned manually on the PCALX oscillator to 0.0 +/- 0.2 [deg]. This is demonstrated on the middle three panels (one for each line) in 2016-01-08_H1PCAL_TrueCARM_Drive_TXRX_TF.png.
We then compare the transfer functions between both end station's estimate of thier respective test mass' displacement. This is shown in the left-most three panels of 2016-01-08_H1PCAL_TrueCARM_Drive_TXRX_TF.png. Recall that at the PCAL X-end, there are troubles with clipping in the RX PD (see, e.g., LHO aLOG 24774), so the PCALX TX PD is the best source of calibrated displacement at that end, and is what is used as the reference in the TFs. This compared against the PCALY's TX PD and RX PD, both of which are also well-calibrated into [m] of Y-end Test Mass displacement. As can be seen, the ratio of TX PDs is better that 0.002 (or 0.2%). Awesome. Though they only looked at it quickly, the PCAL team claimed to understand why PCALY's RX PD is 2% larger than both PCALY and PCALX's TX PDs, but I don't recall why. I'll ask them to comment on this log about it.
Though above details of how the amplitude and phase of each excitation is matched may be tough to follow, the take-away is that we "dead reckon" the amplitude with each end stations PCALs calibration (which, admittedly are both based on LHO's working standard, derived from NIST's gold standard). We do not "cheat the result," for example, by driving in CARM, and minimizing the amplitude and phase by minimizing the line height in DARM.
Finally, we flip the X-end PCAL excitation phase by 180 [deg], such that we're now driving pure DARM. A remeasurement of the relative phase between X and Y confirms the 180 +/- 0.2 [deg] difference, and the amplitude ratios between end stations's TX and RX PDs are identical (also awesome).
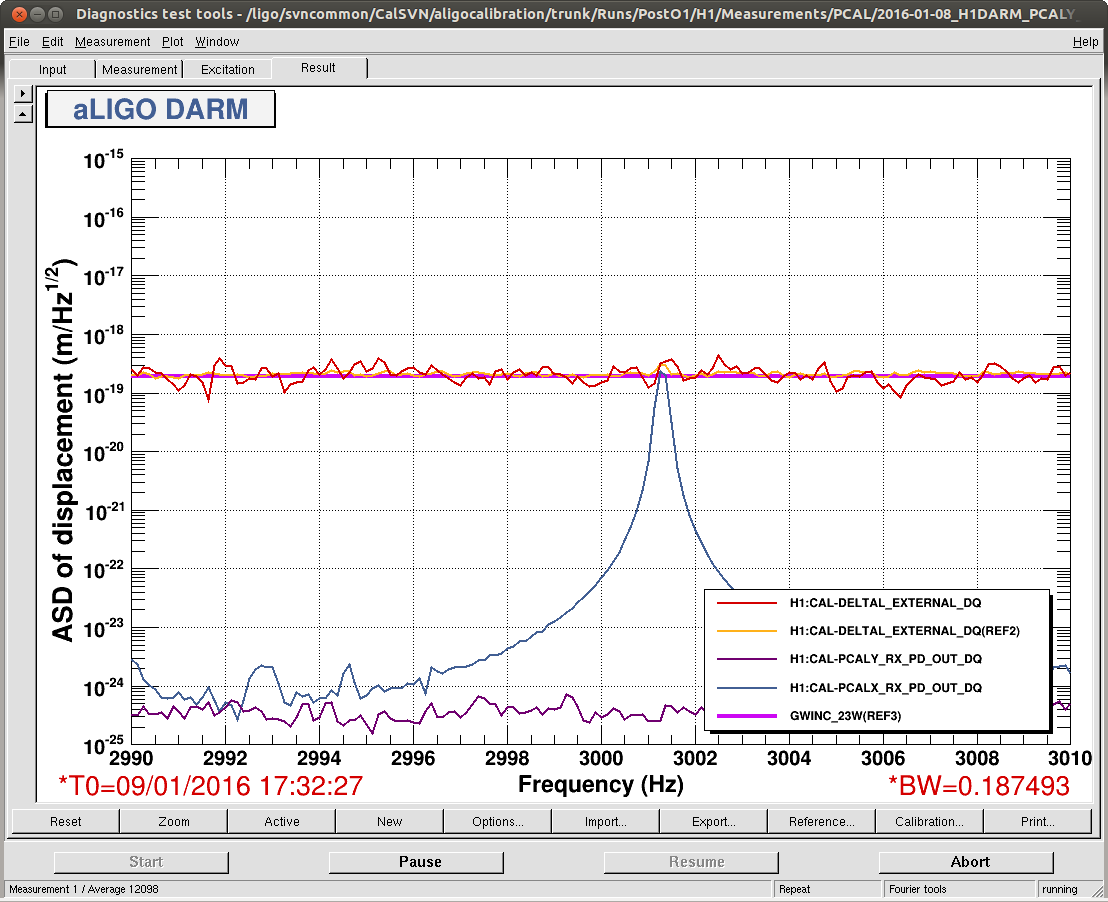
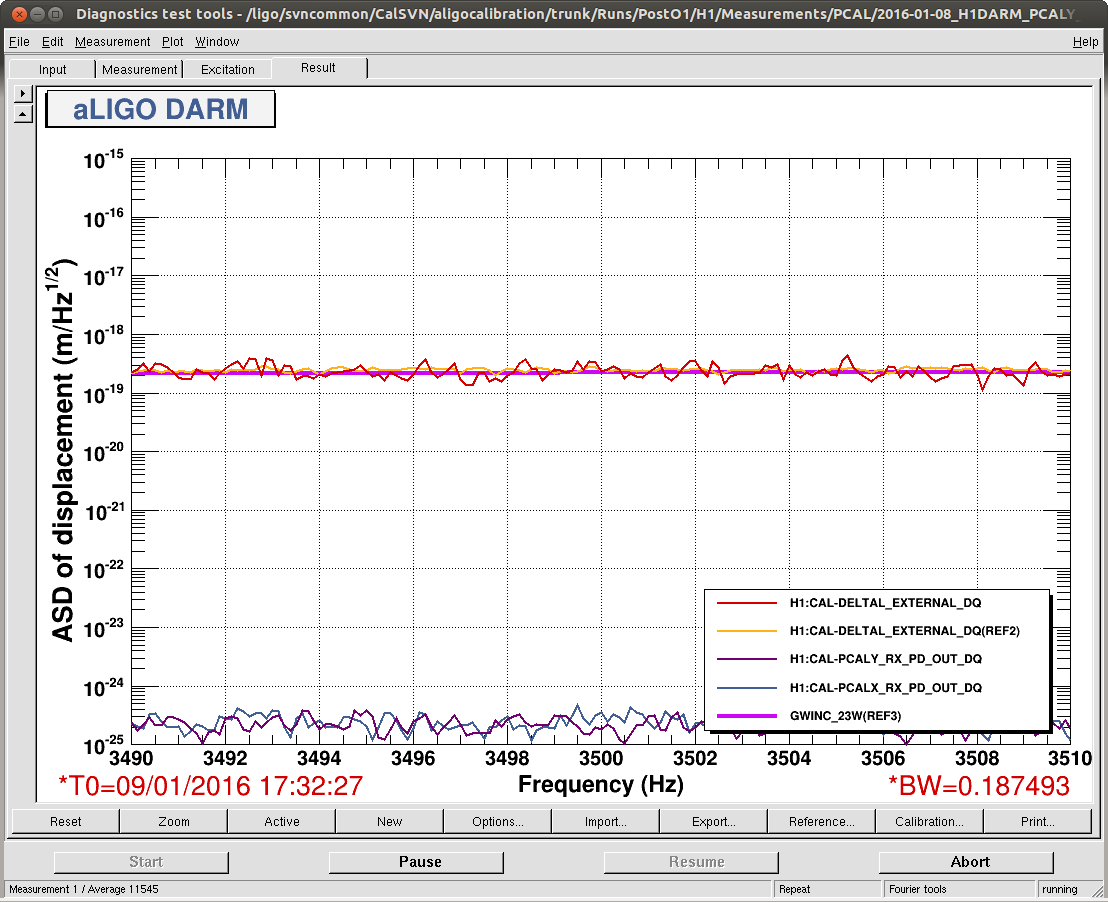
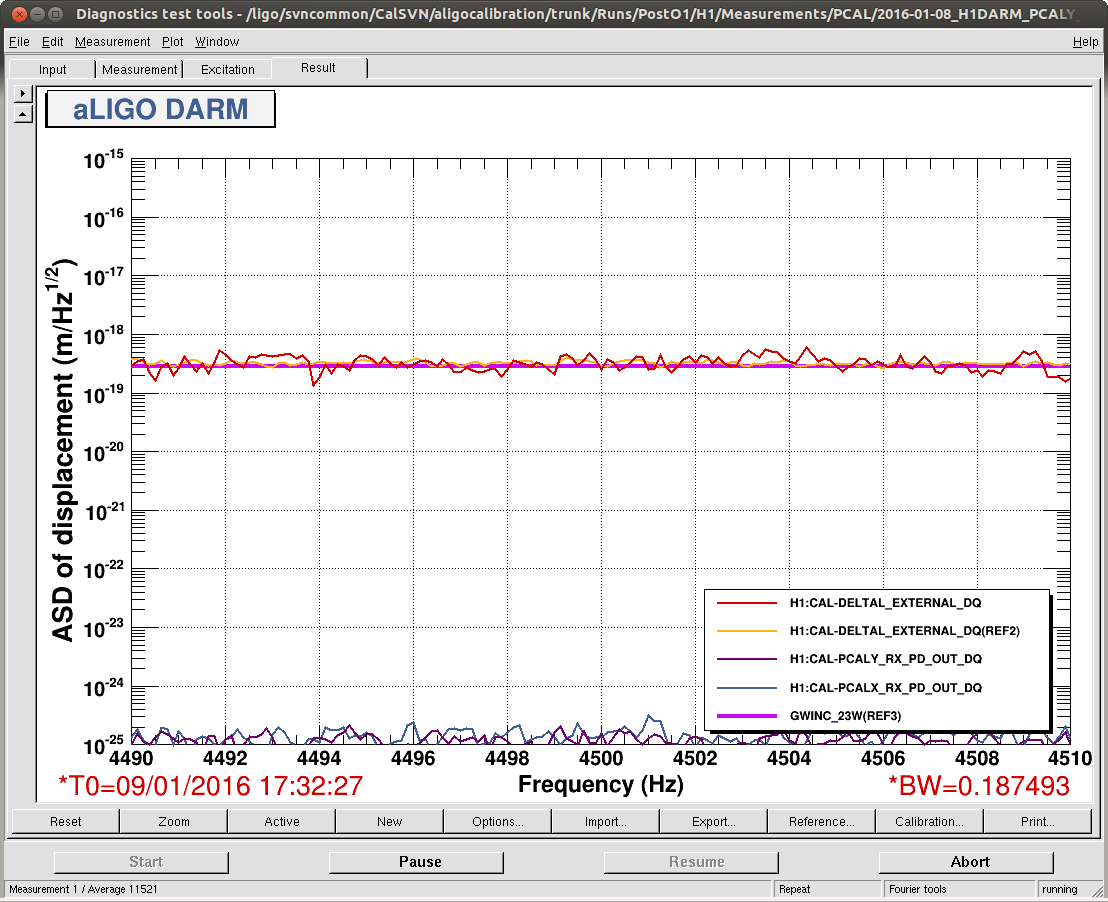
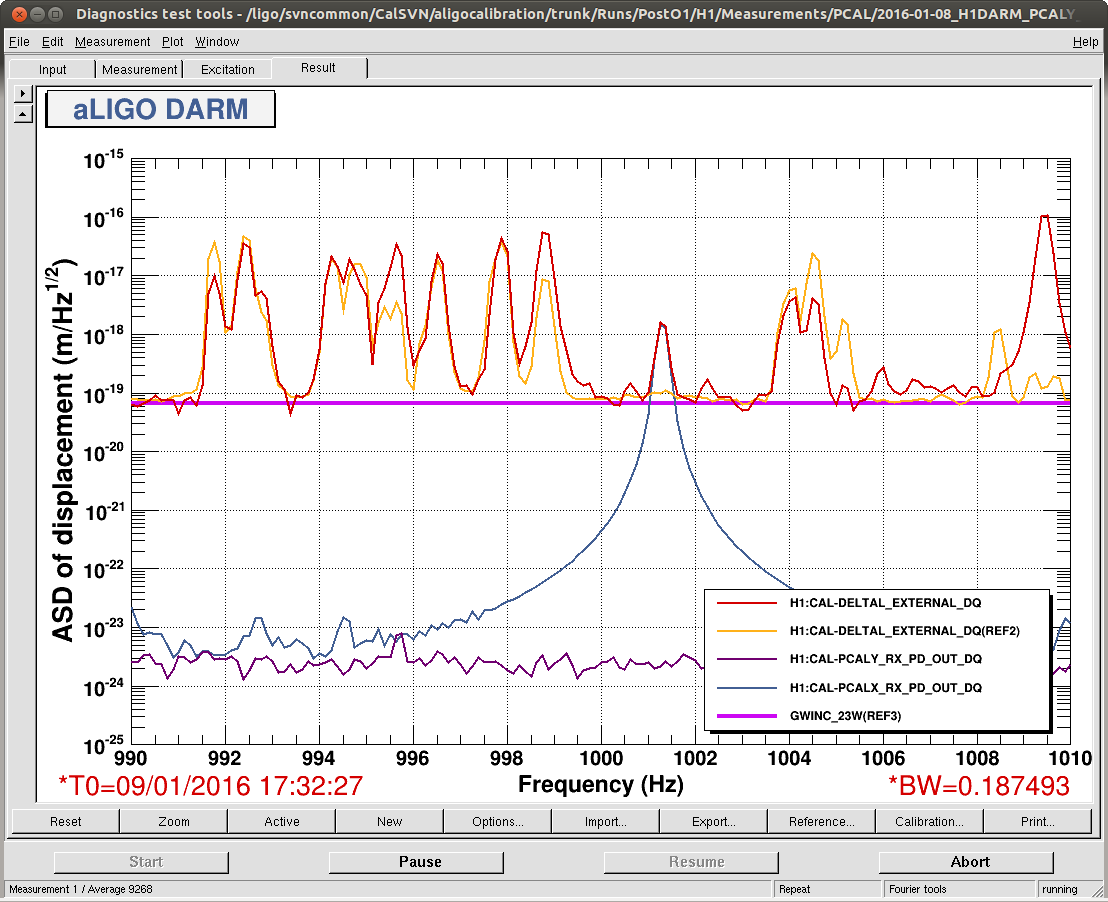
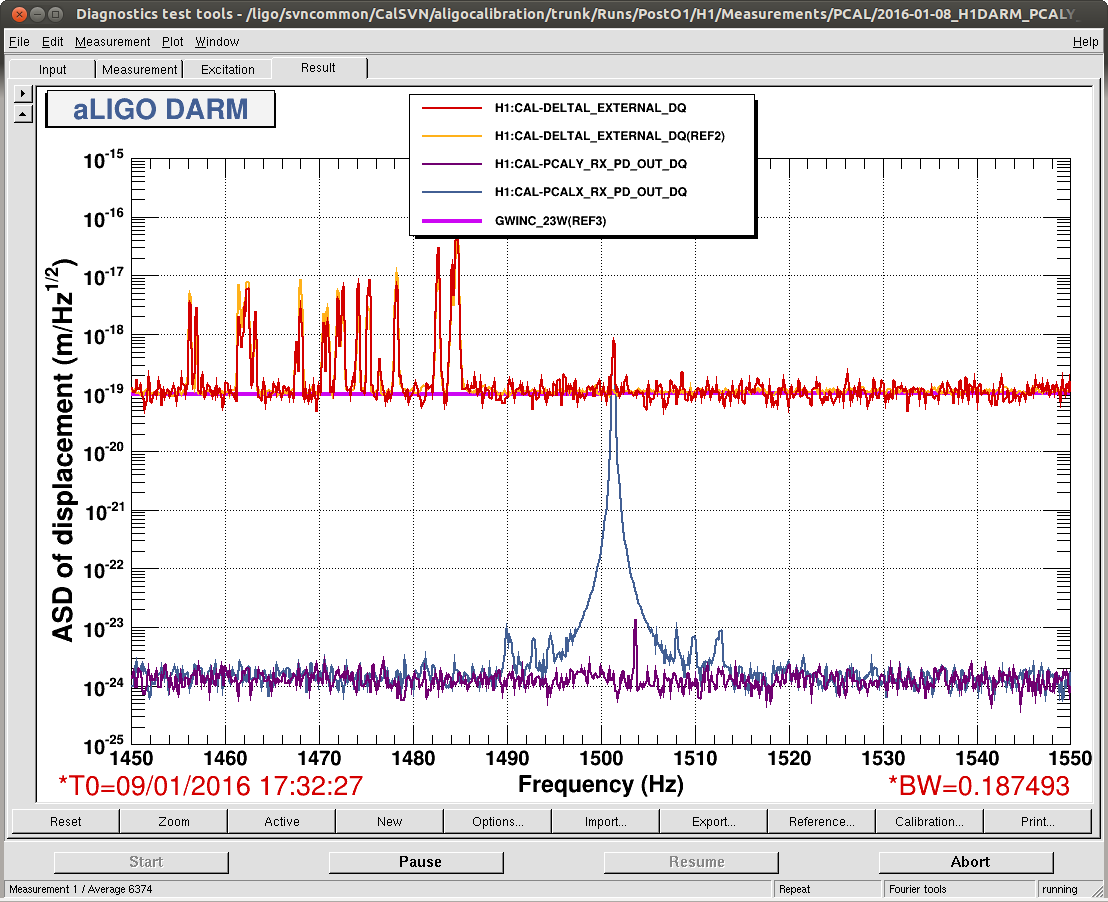
Both the DARM and CARM configurations were measured at the normal amplitude, driving all three lines at once. While driving in DARM, the DELTAL_EXTERNAL displacement is exactly twice the predicted test mass displacement at all three frequencies These are shown in the attachments 2016-01-08_H1DARM_ASD_PCAL_TrueCARM_Drive.pdf and 2016-01-08_H1DARM_ASD_PCAL_TrueDARM_Drive.pdf. However, while driving all three lines simultaneously in CARM, we did not have enough actuation range on PCALX to see any residual DARM motion.
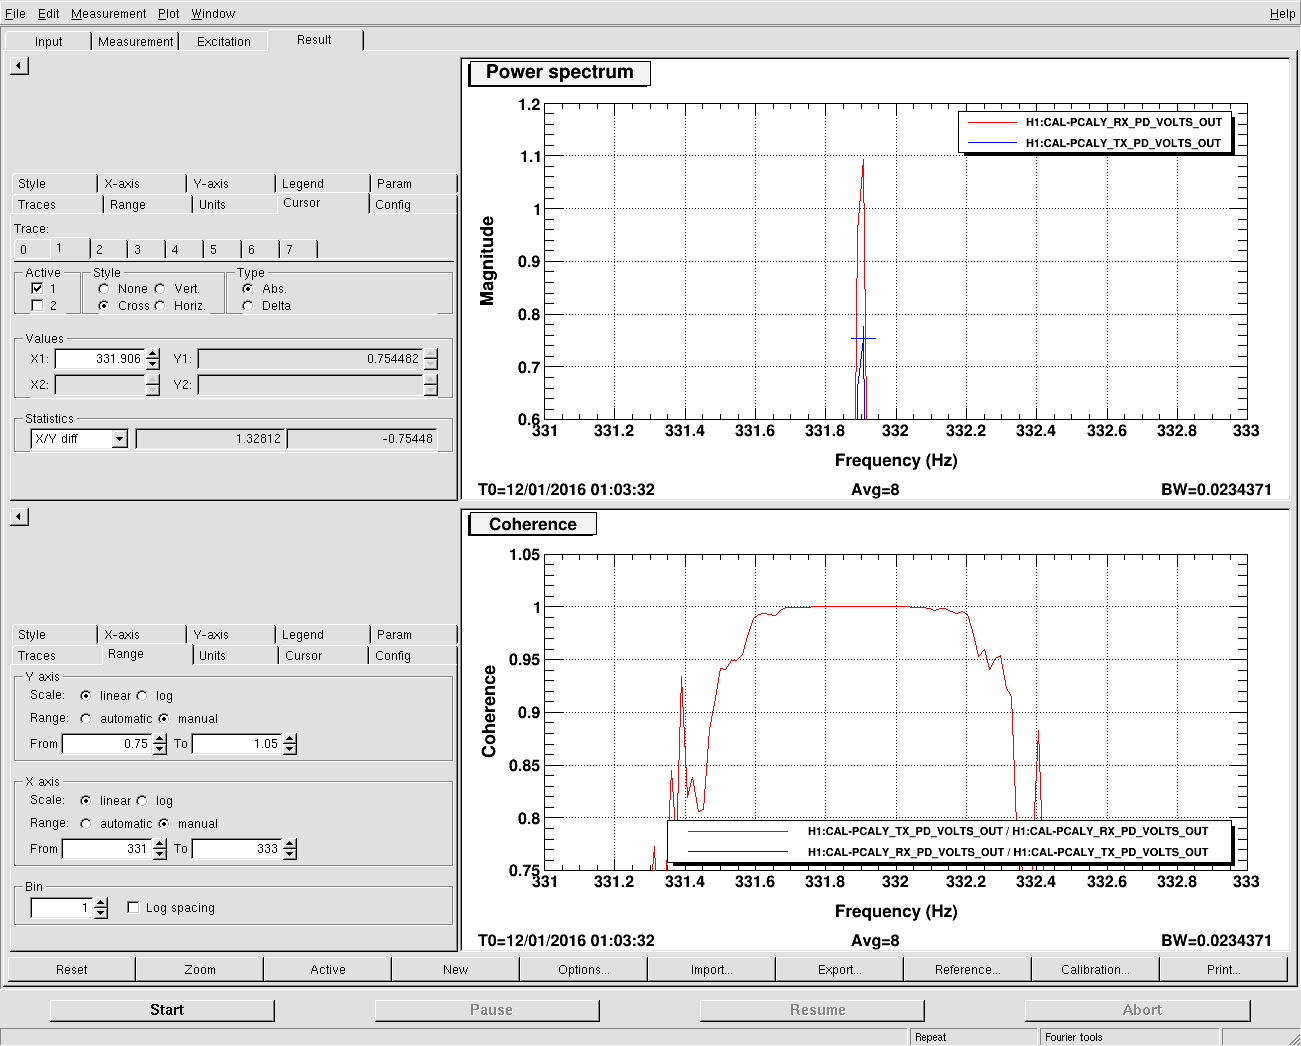
As such, we repeated the test only driving the 331.9 [Hz] line, but much harder in both end stations (12e3 [ct] at Y, 24e3 [ct] at X). At this level of drive, the residual DARM motion during true CARM excitation was visible. Comparing that ratio of CARM to DARM, we find the residual, relative drive calibration between the end stations, (true CARM EXC) / (true DARM EXC) as measured by DARM is 0.0042683 at 331 [Hz]. A large fraction of this residual DARM is likely limited by the precision to which we've measured the ratio of requested actuator strengths (which we rounded to 2.00, instead of higher precision; upon later inspection with a cursor, the ratio is 2.0037675). However, the calibration has been demonstrated to better than the total uncertainty claimed by PCAL, 0.76%, so we need not spend the time to be more precise.
The location of the measurement templates are restated here for convenience:
/ligo/svncommon/CalSVN/aligocalibration/trunk/Runs/PostO1/H1/Measurements/PCAL/
2016-01-08_H1DARM_ASD_PCAL_TrueCARM_Drive.xml
2016-01-08_H1DARM_ASD_PCAL_TrueDARM_Drive.xml
2016-01-08_H1PCAL_TrueCARM_Drive.xml
2016-01-08_H1PCAL_TrueDARM_Drive.xml
and have been commited.