Again Masayuki.Nakano reported with Stefan's account
Kiwamu, Masayuki
We measured spectrum of the OMC DCPD signals with a single bounce beam. It would help a noise budget of a DARM signal.
What we did
1. Increase the IMC power
IMC power was increased up to 21W. Also H1:PSL-POWER_SCALE_OFFSET was changed to 21.
2. Turn of the guardian of isc-lock
Requested 'DOWN' to the isc-lock guardian to not do anything during the measurement.
3.Miss align the mirrors
For leading the single bounce beam, all of mirrors were misaligned by requesting 'MISALIGN' to guardians of each mirrors except for ITMX.
4.Aligned the OM mirrors
When we got single bounce beam from IFO, there was no signal from ASC-AS-A, B, C QPDs initially. We aligned OM1,OM2,OM3,OMC suspensions with the playback data of OSEM signals
5.Locked the OMC
The servo gain, 'H1:OMC-LSC_SERVO_GAIN', was set to 10 and master gain of the OMC-ASC was set to 0.1.
The DCPD output was 34 mA.
6.Measurement (without a ISS second loop)
The power spectrum of below channels are measured. Measurement frequency was 1-7kHz and BW was 0.1 Hz. The measured channel was as below.
H1:OMC-DCPD_SUM_OUT
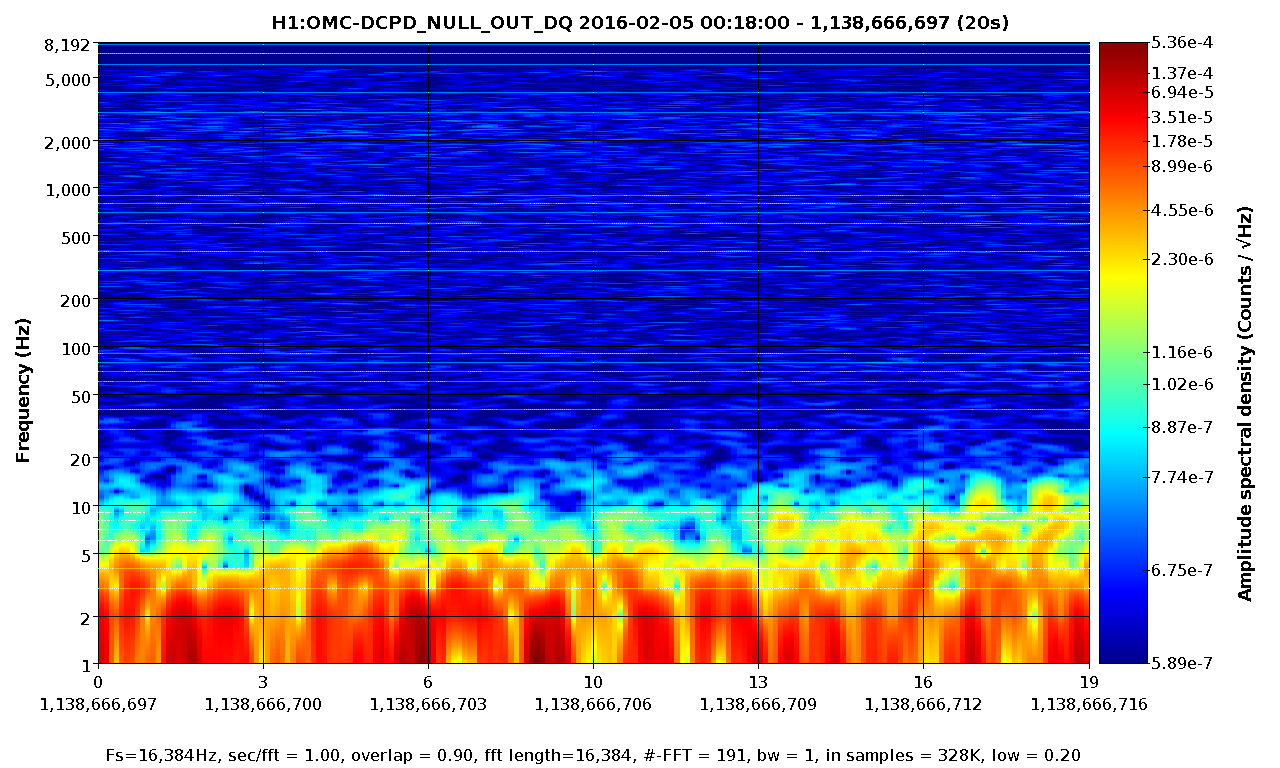
H1:OMC-DCPD_NULL_OUT
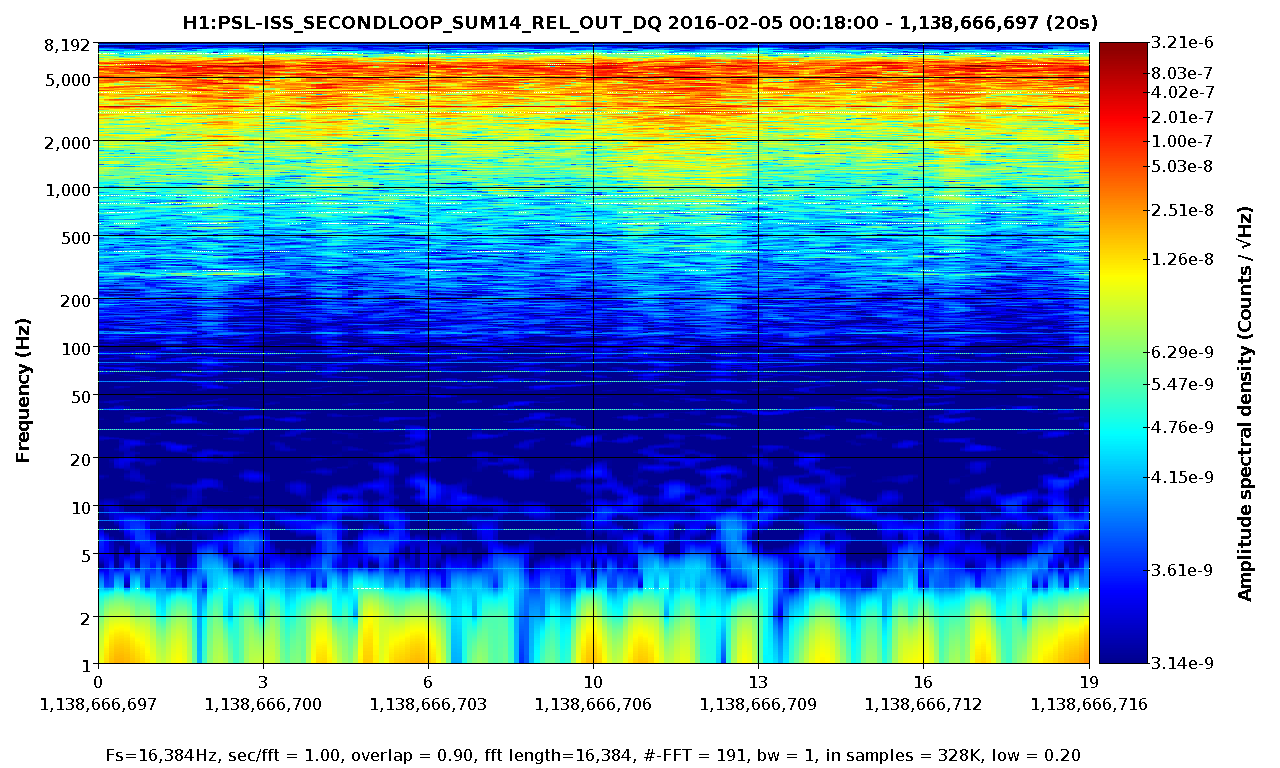
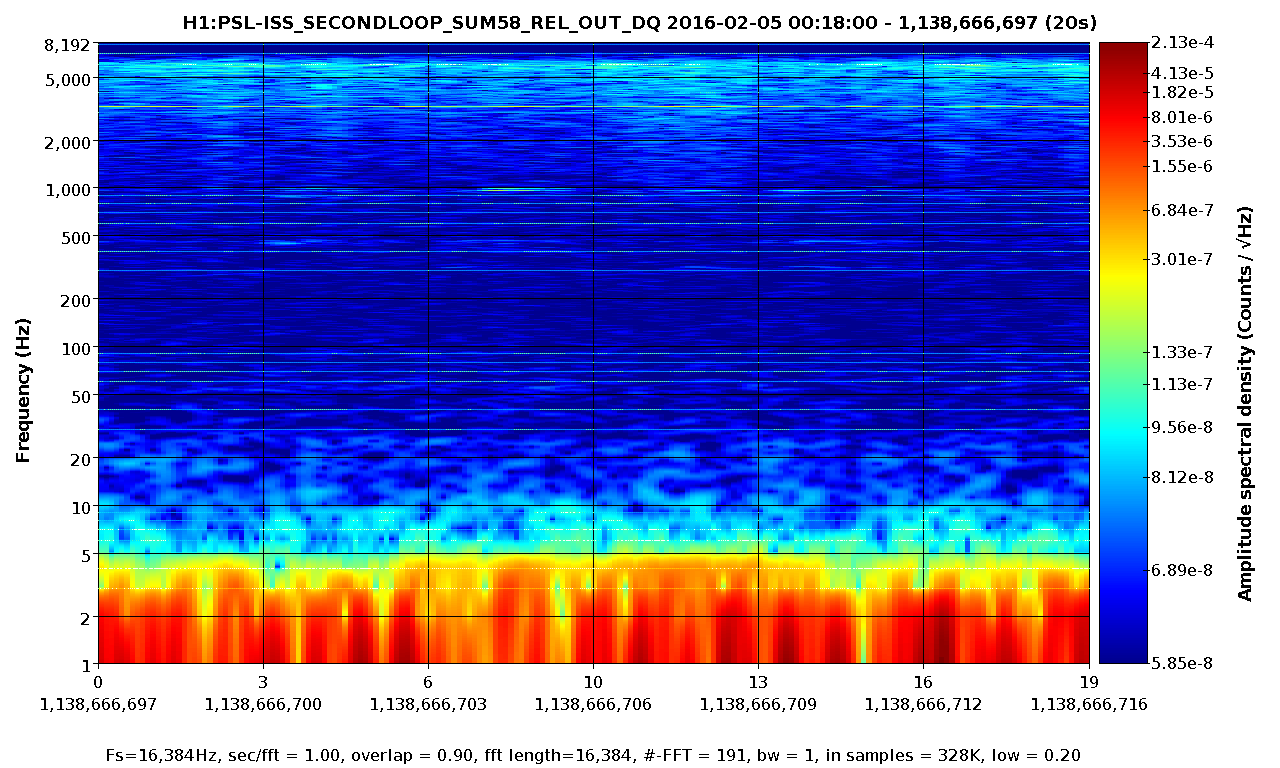
H1:PSL-ISS_SECONDLOOP_SUM58_REL_OUT
H1:PSL-ISS_SECONDLOOP_SUM58_REL_OUT was used as the out-of-loop sensor of the ISS.
7.Closed the ISS second loop
The ISS second loop was closed. The sensors used to gain error signal was PD1-4.
8.Measurement (with a ISS second loop)
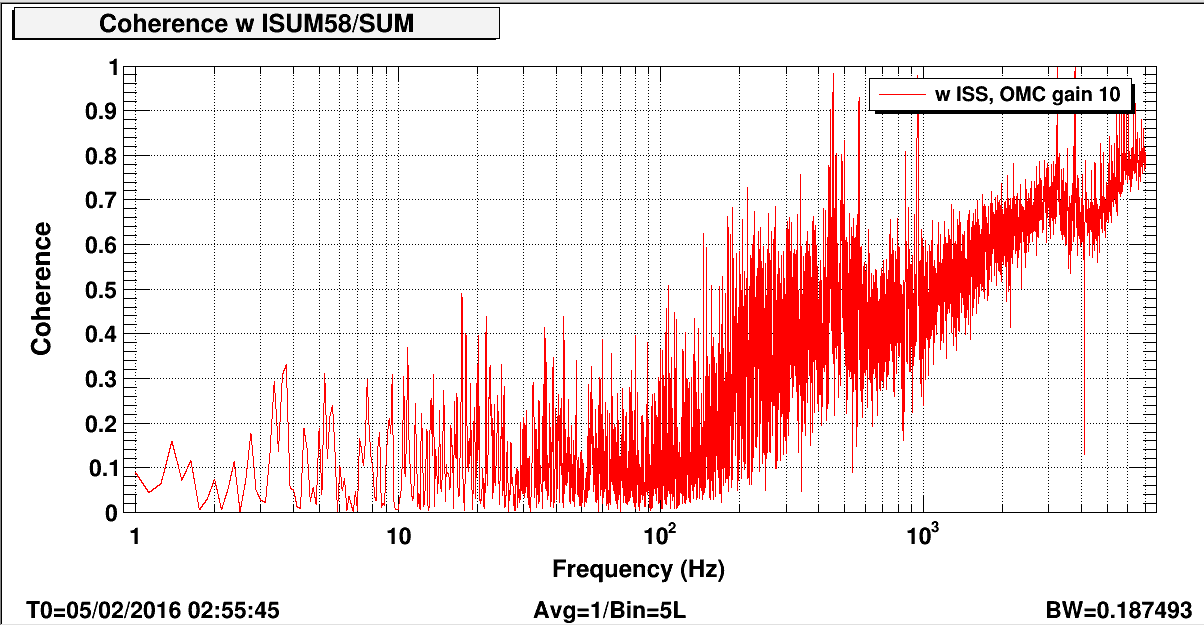
Same measurement as step5. In addition to that, the coherence function between DCPD-SUM and SECONDLOOP_SUM was measured.
Discussion
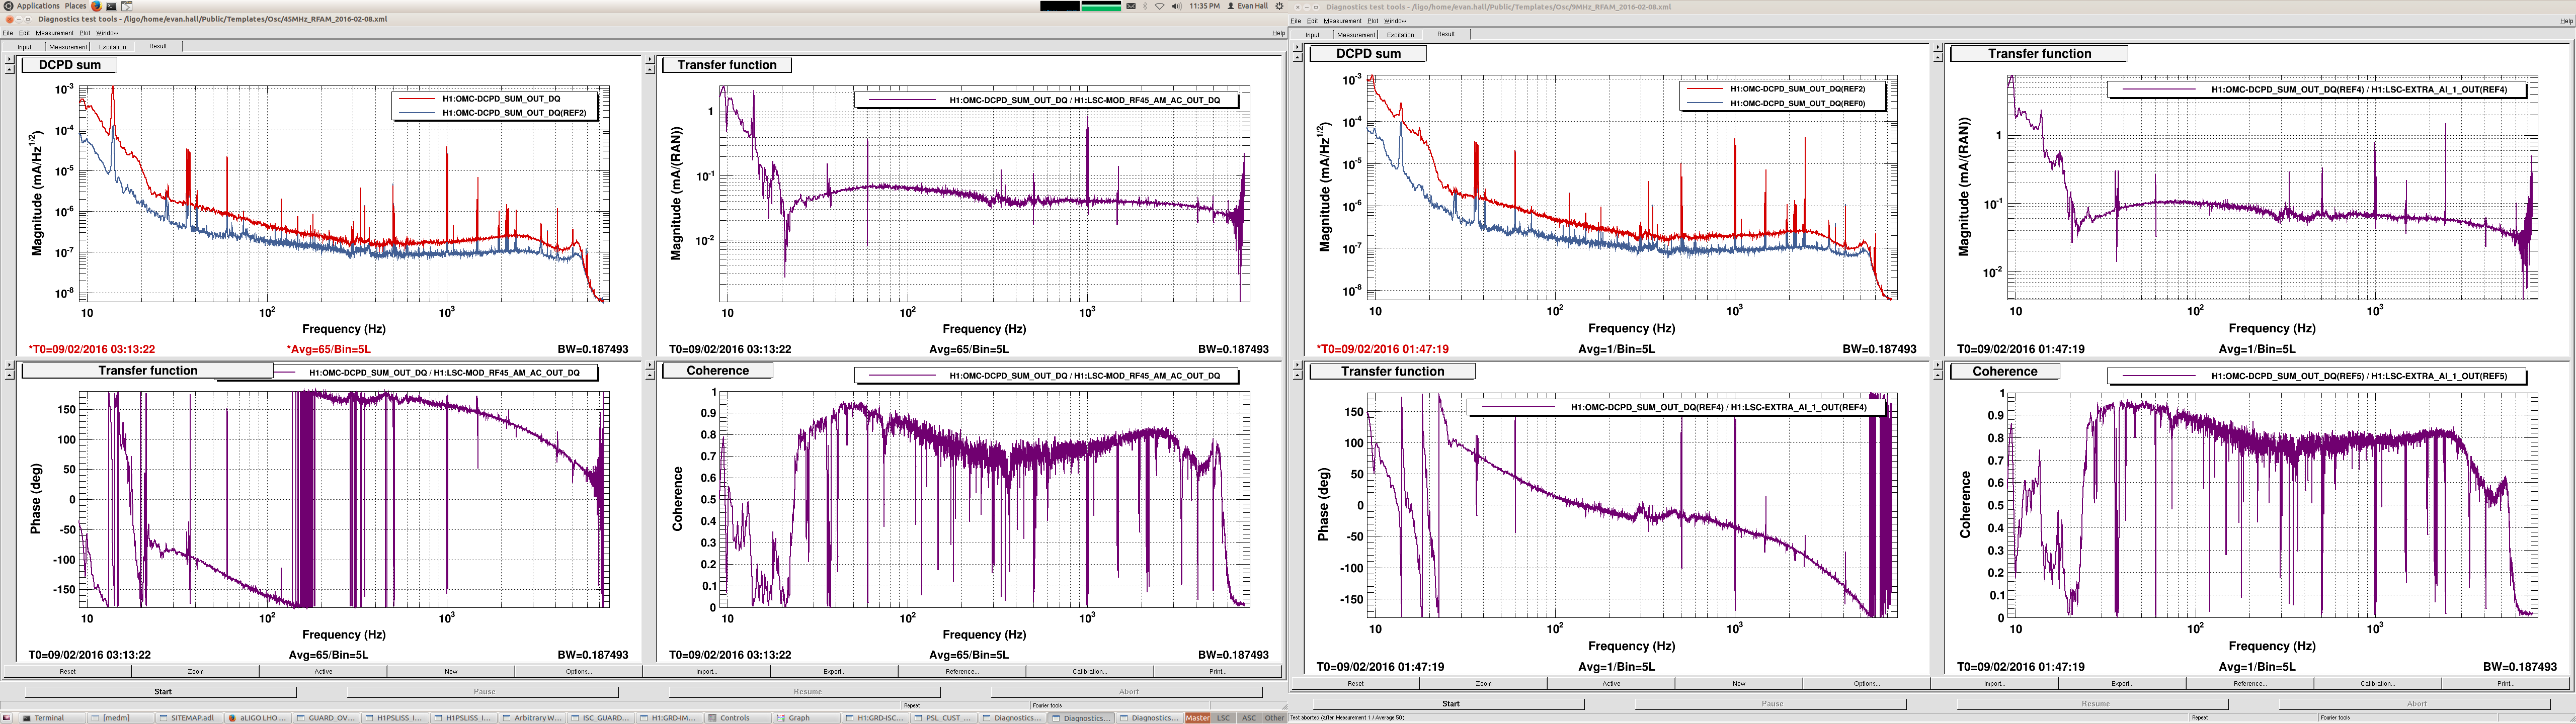
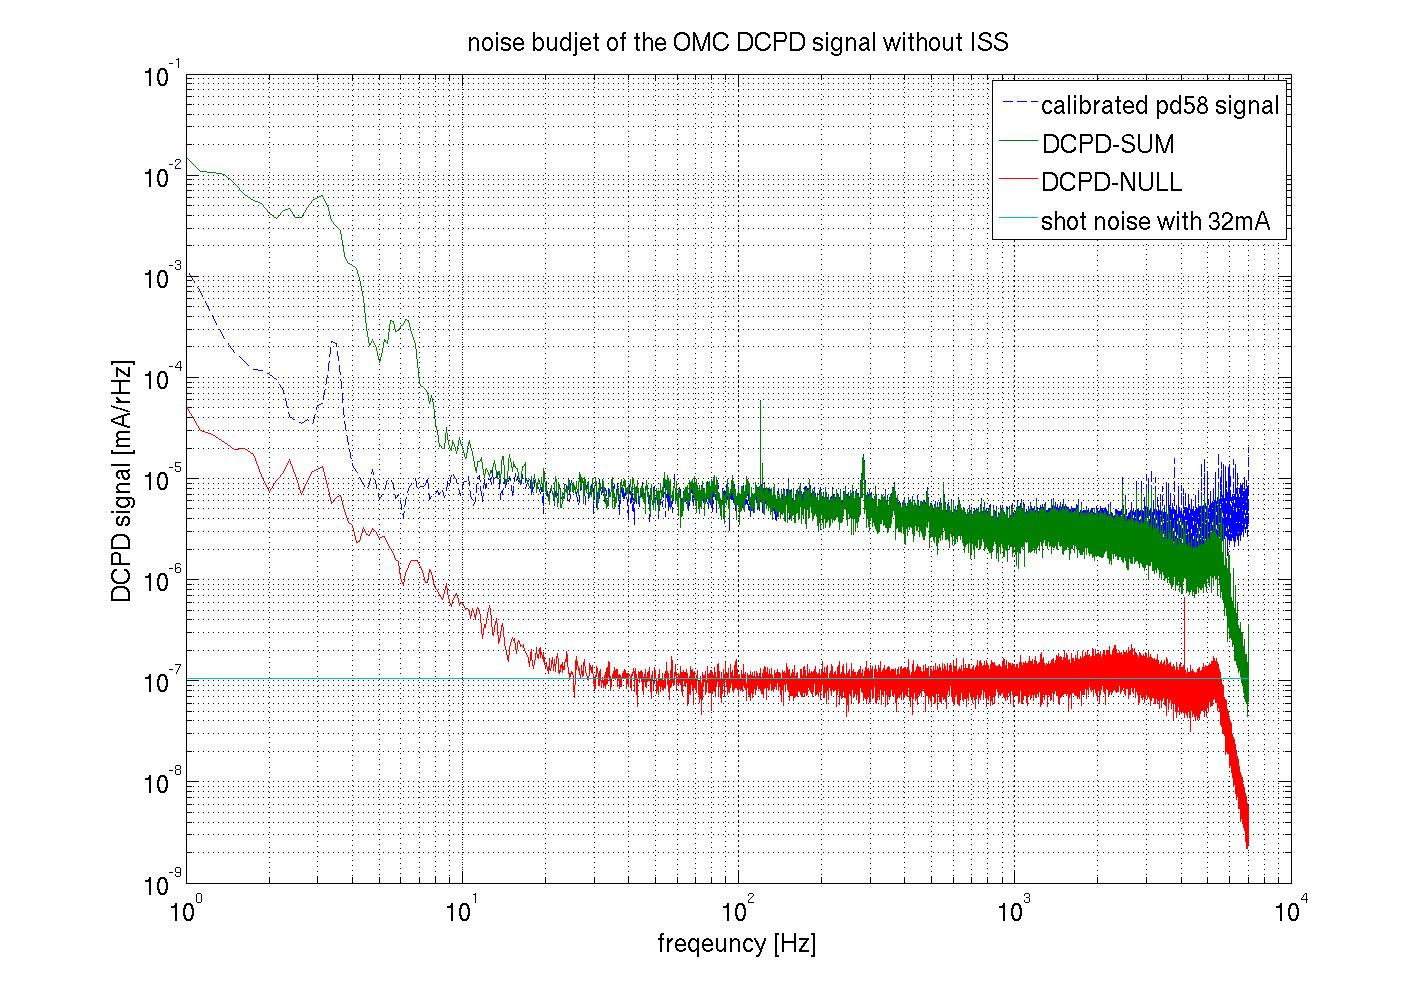
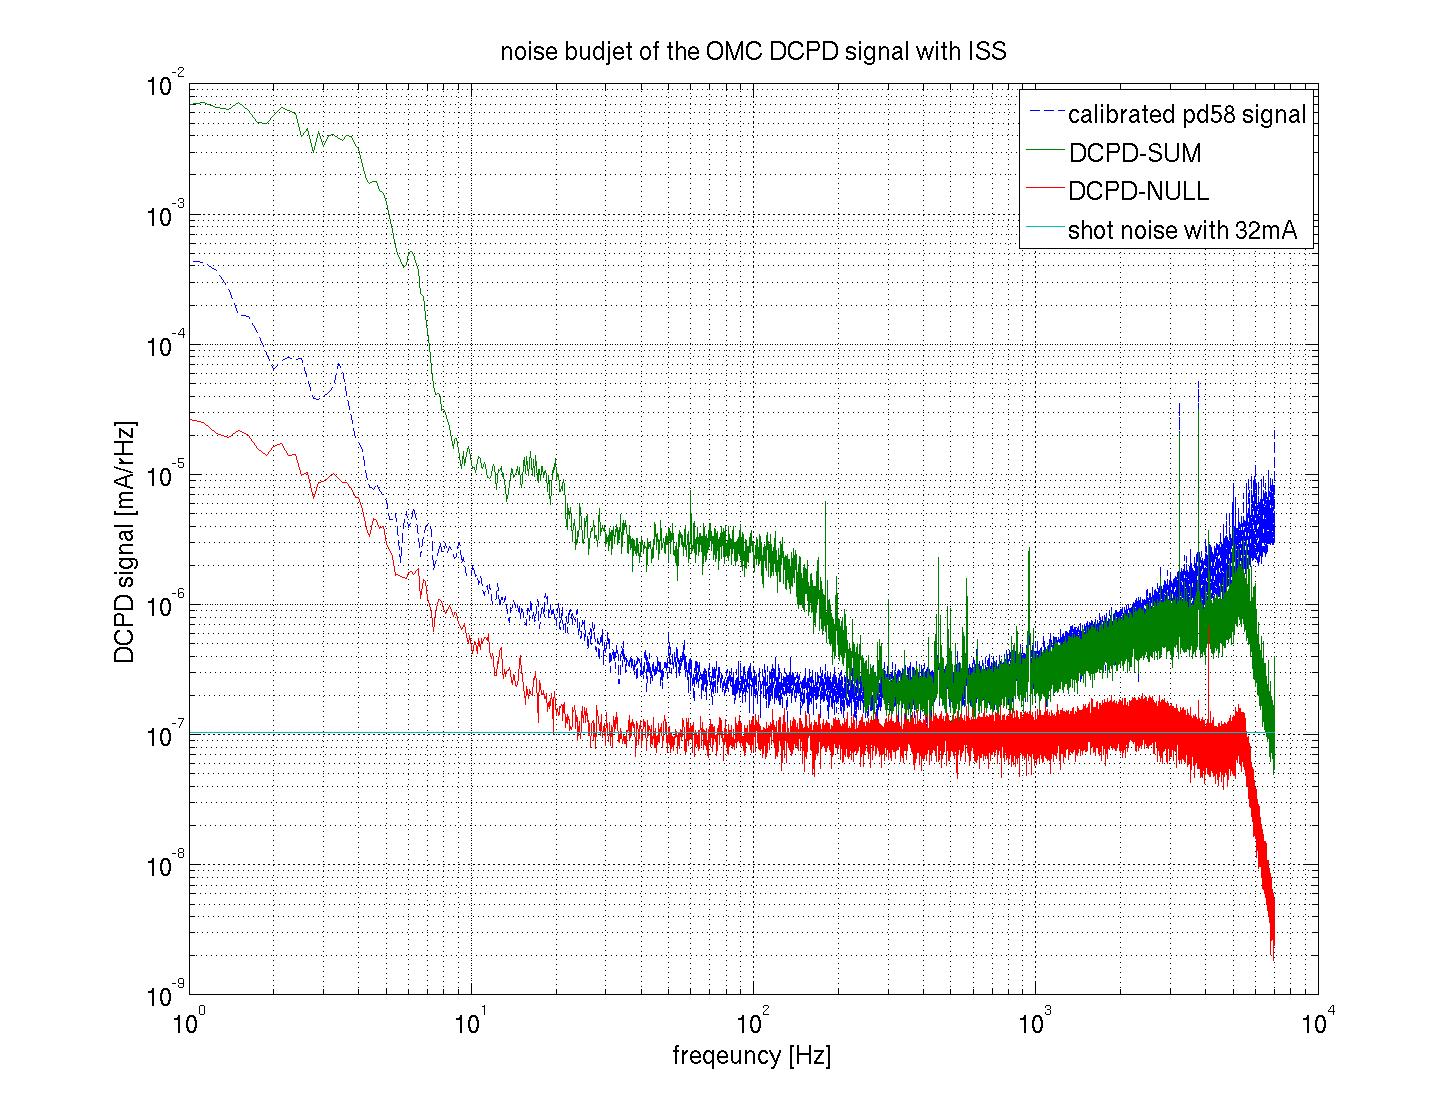
I scaled out-of-loop sensor signals of ISS, i.e. the residual intensity noise after the ISS second loop, to the same unit as OMC-DCPD signals. The scaling factor was estimated by dividing the H1:OMC-DCPD_SUM_OUT spectrum (without ISS) by H1:PSL-ISS_SECONDLOOP_SUM58_REL_OUT spectrum (also without ISS) at 100Hz.
I scaled those spectrum both (hereafter 'both' means with and without closing ISS) by same scaling factor.
You can see the DCPD-SUM spectrum, DCPD-NULL spectrum and scaled second loop ISS out of loop sensor signals in attached plots.
The both NULL signals agree with the shot noise of a PD with 34mA signal (cyan curve) above 30Hz, and below that it would be limited by ADC noise.
About the SUM signals, it seems to consistent with the scaled intensity noise above 300 Hz. Also they have some coherence between the intensity noise and the OMC PD signal upper than 300Hz(see another plot). On the other hand, there seems to be some unknown noise below 300 Hz when the second ISS loop was closed.
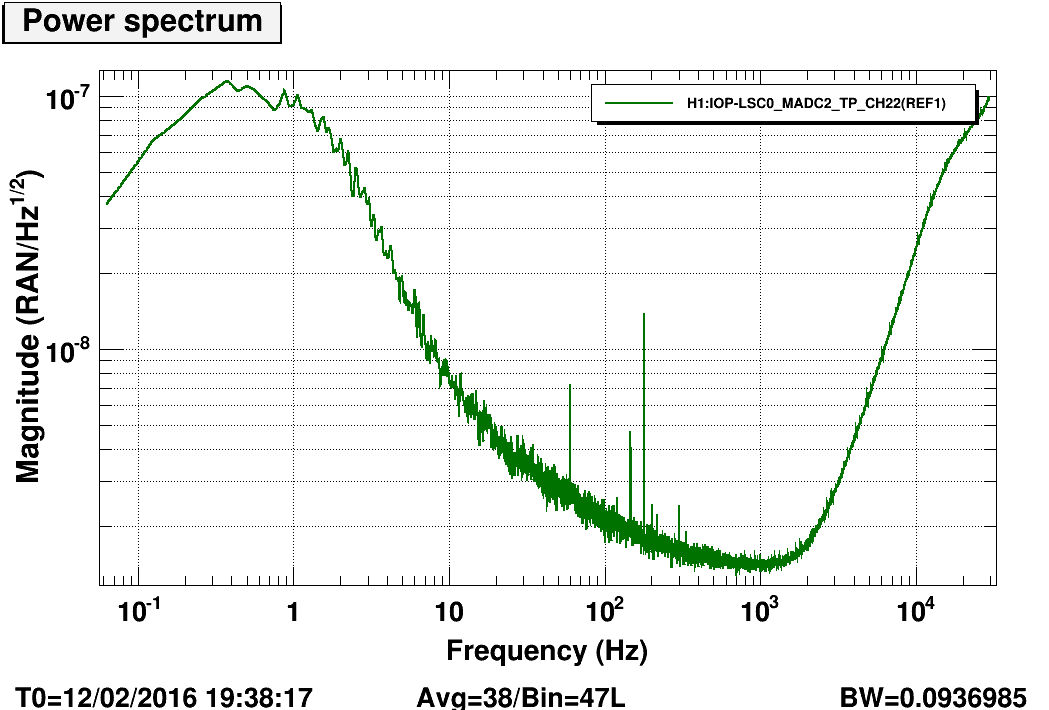
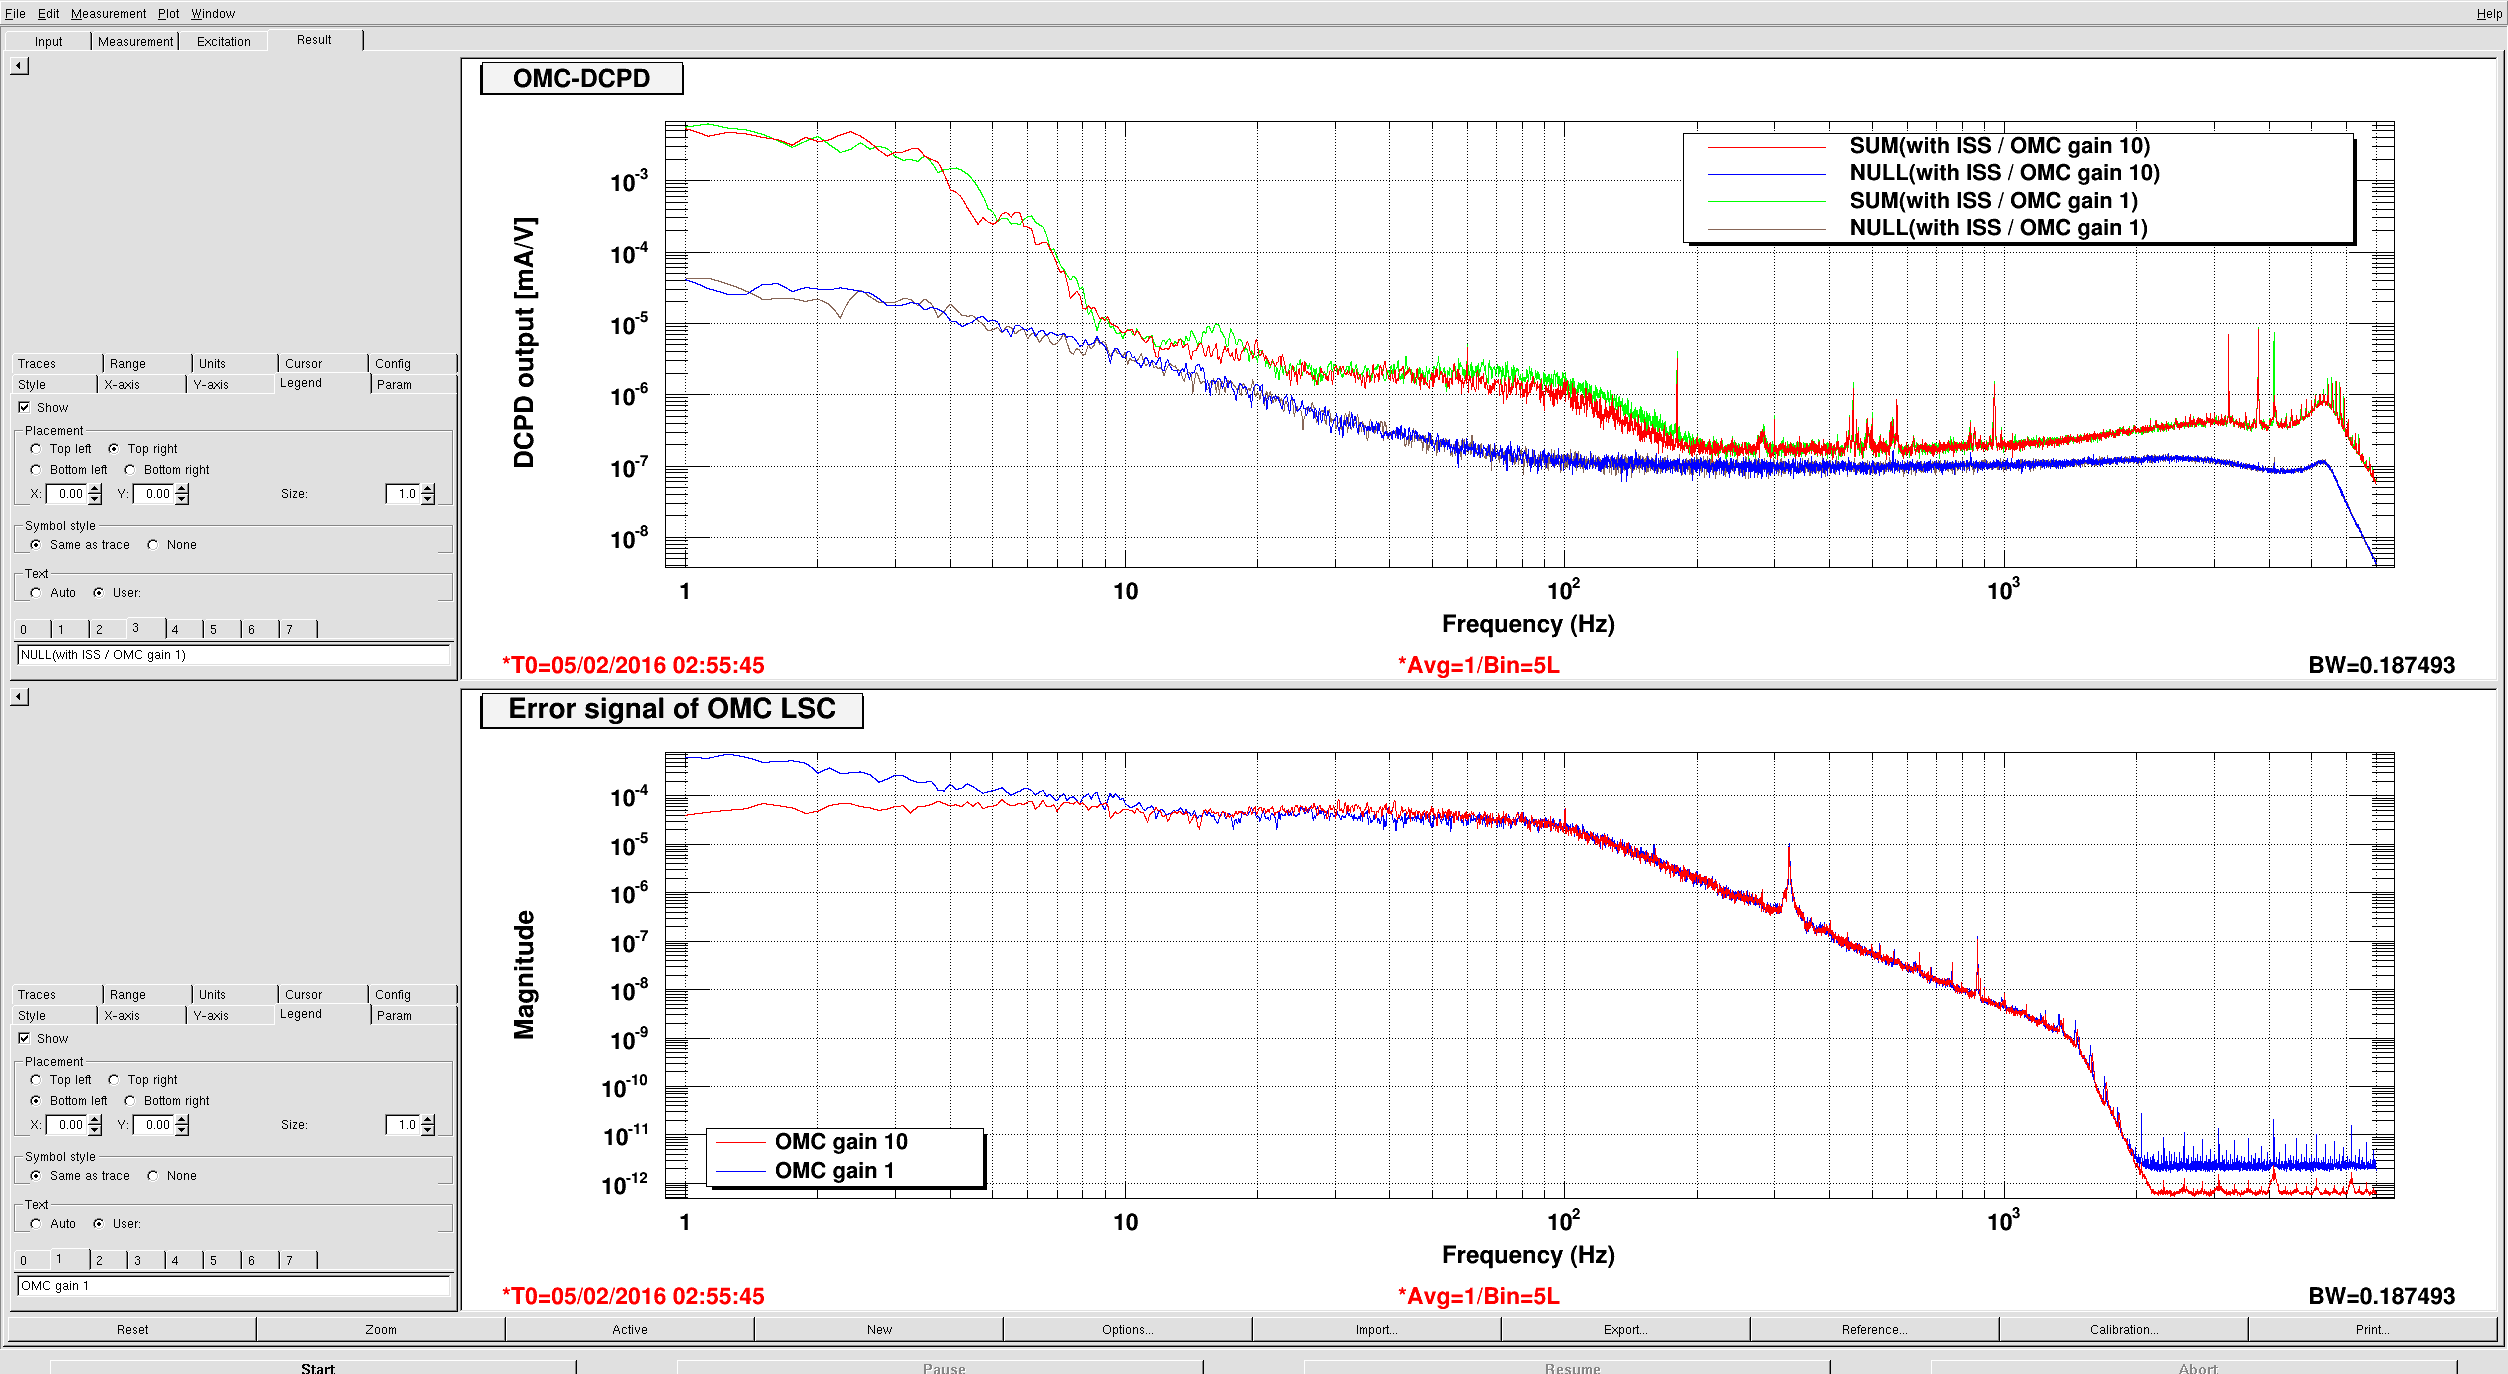
Possibly this unkown noise might come from the length motion of the OMC. I attached another plot. This plot is the one of same channel(upper) and the OMC error signal with a different servo gain of OMC LSC loop. The error signal and DCPD-SUM signal seem to have similar structure around 100Hz. I haven't any analysis yet because these plots are measred after whitening filter had some trouble and we are planing to do same measurement again with whitening filter.