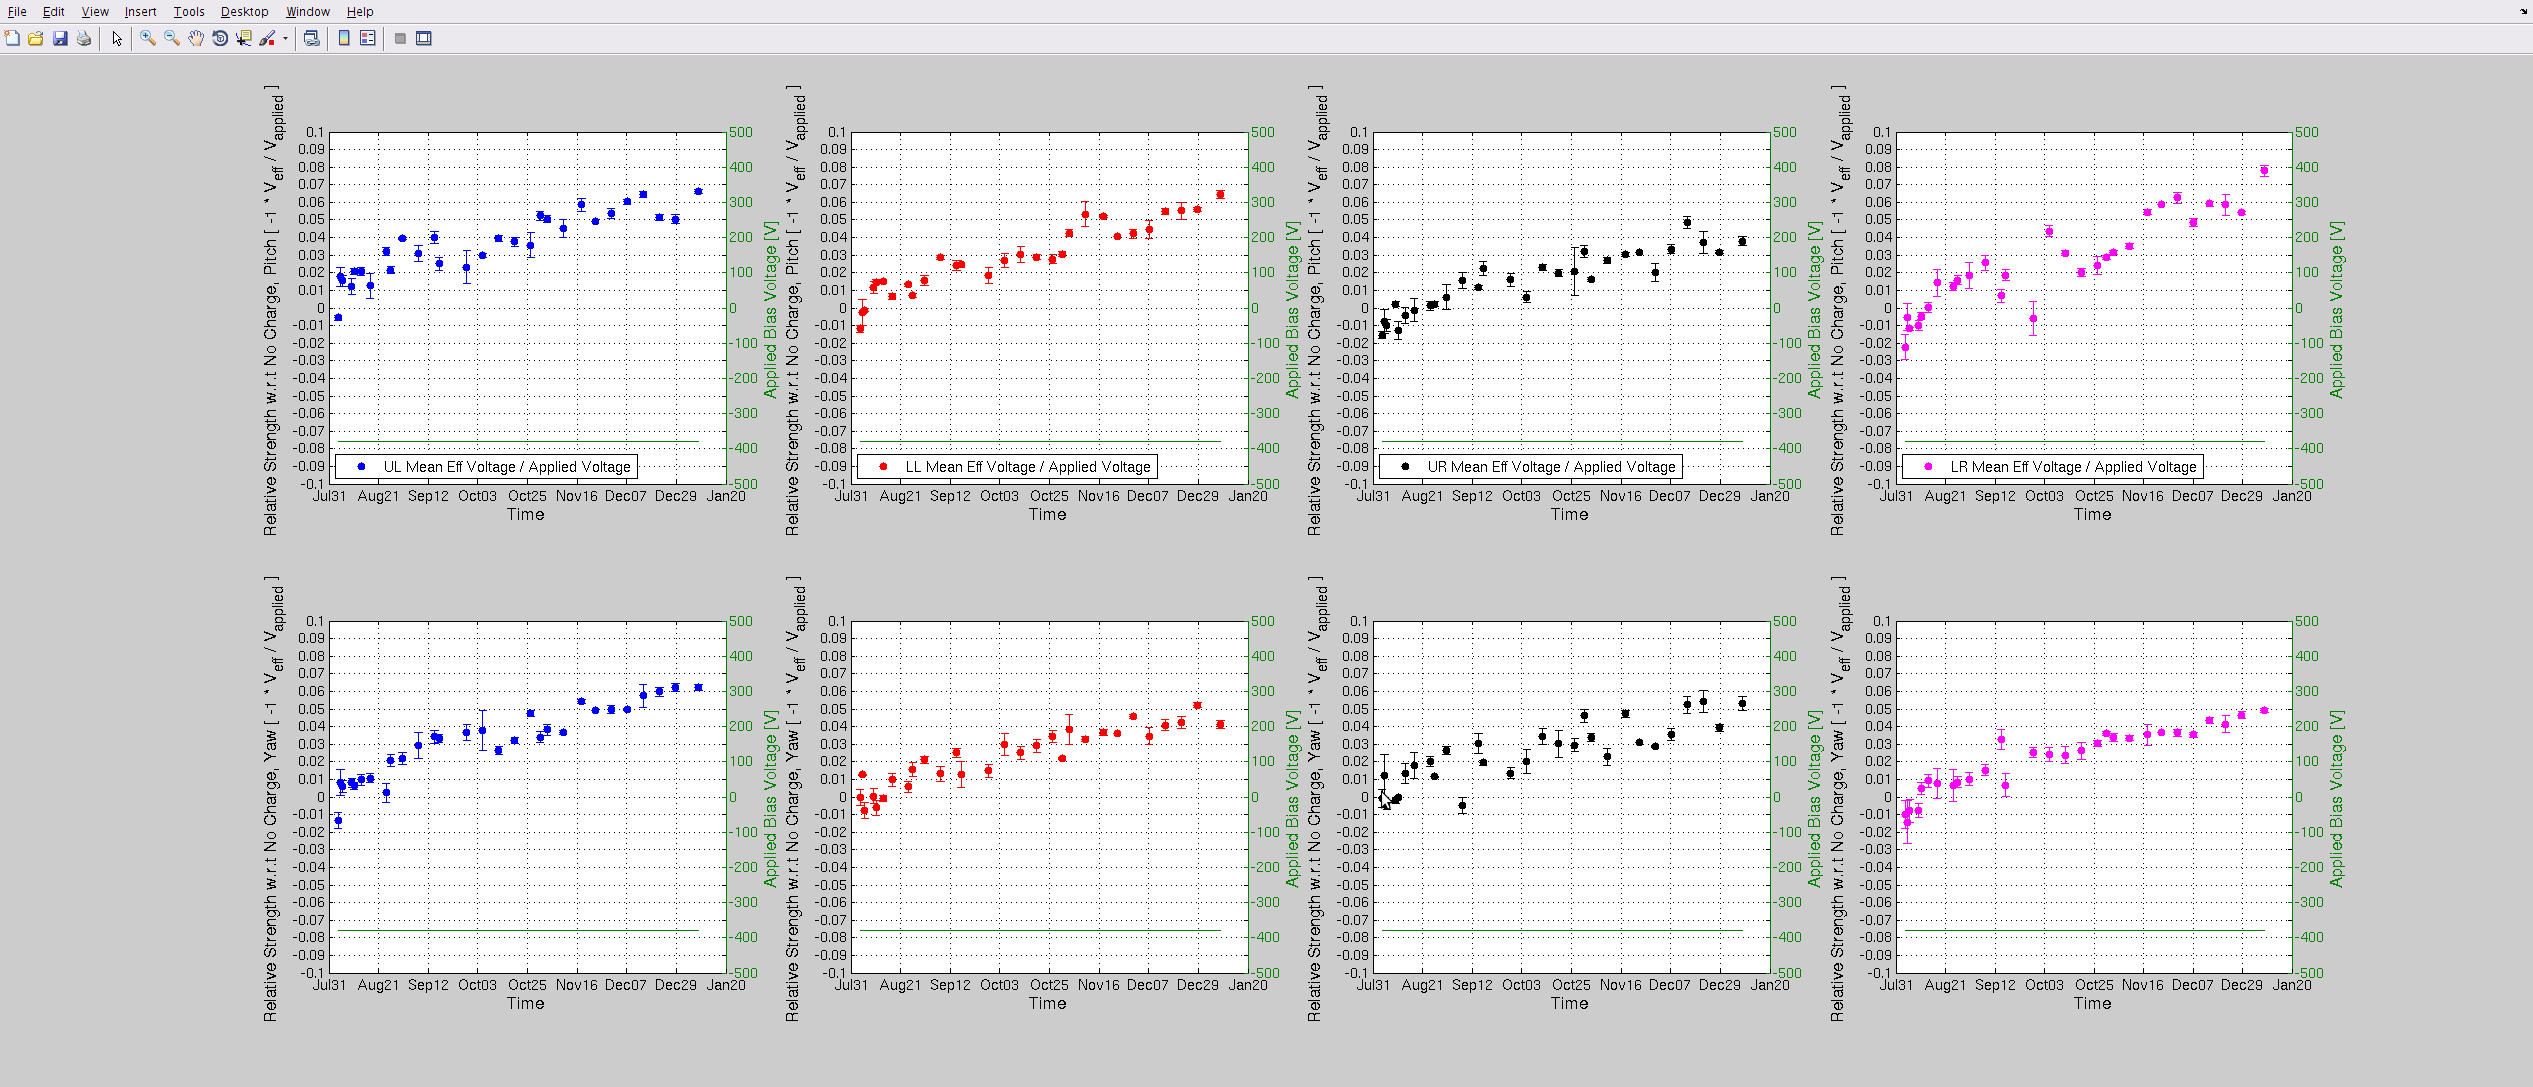
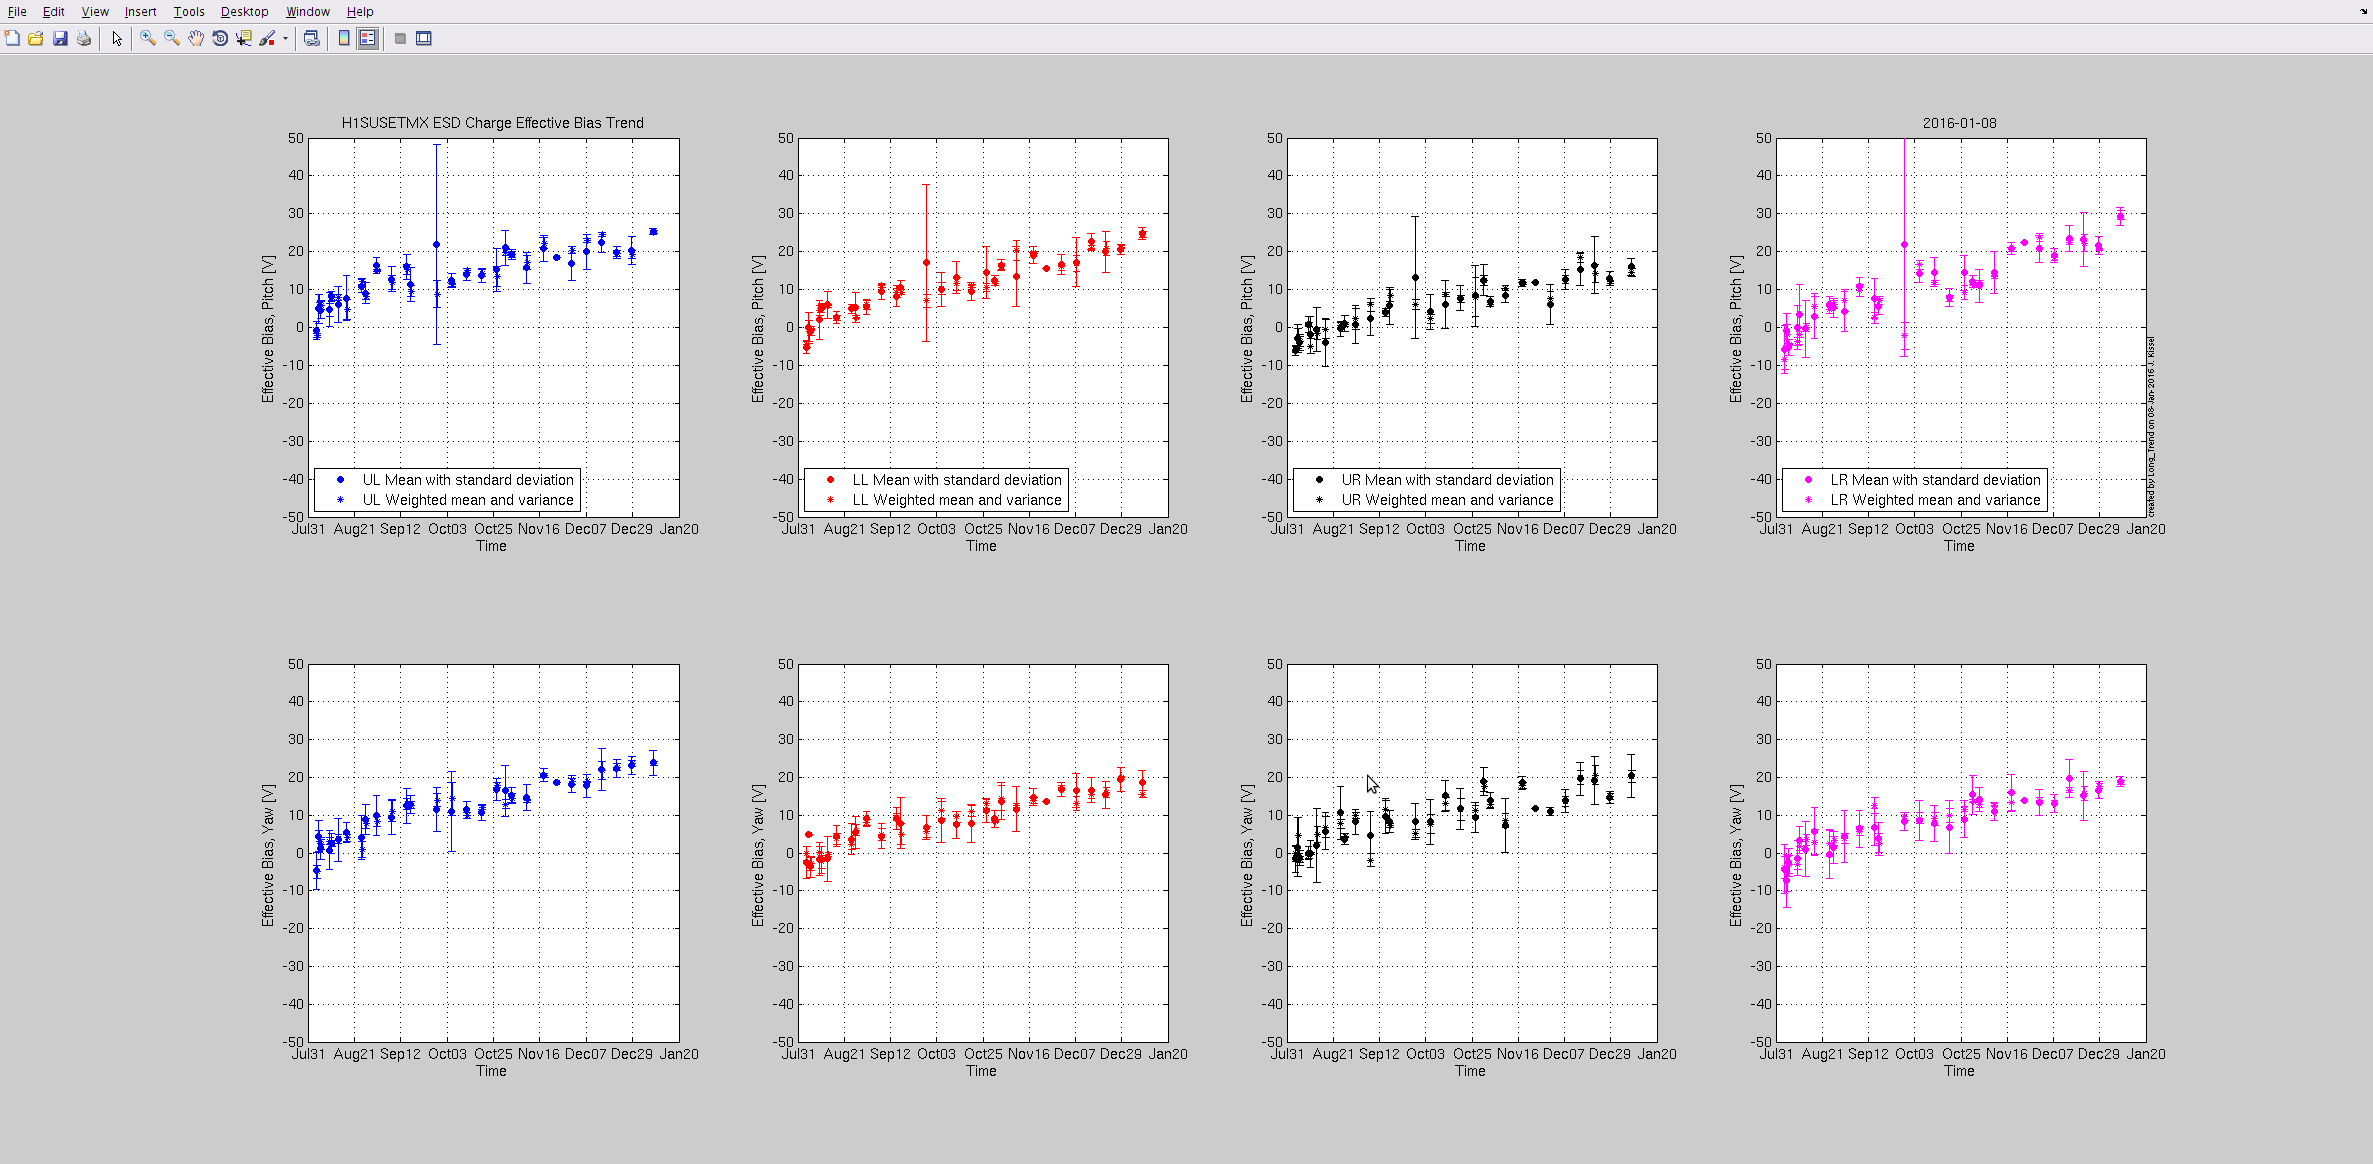
J. Kissel, R. Savage, E. Goetz, D. Tuyenbayev
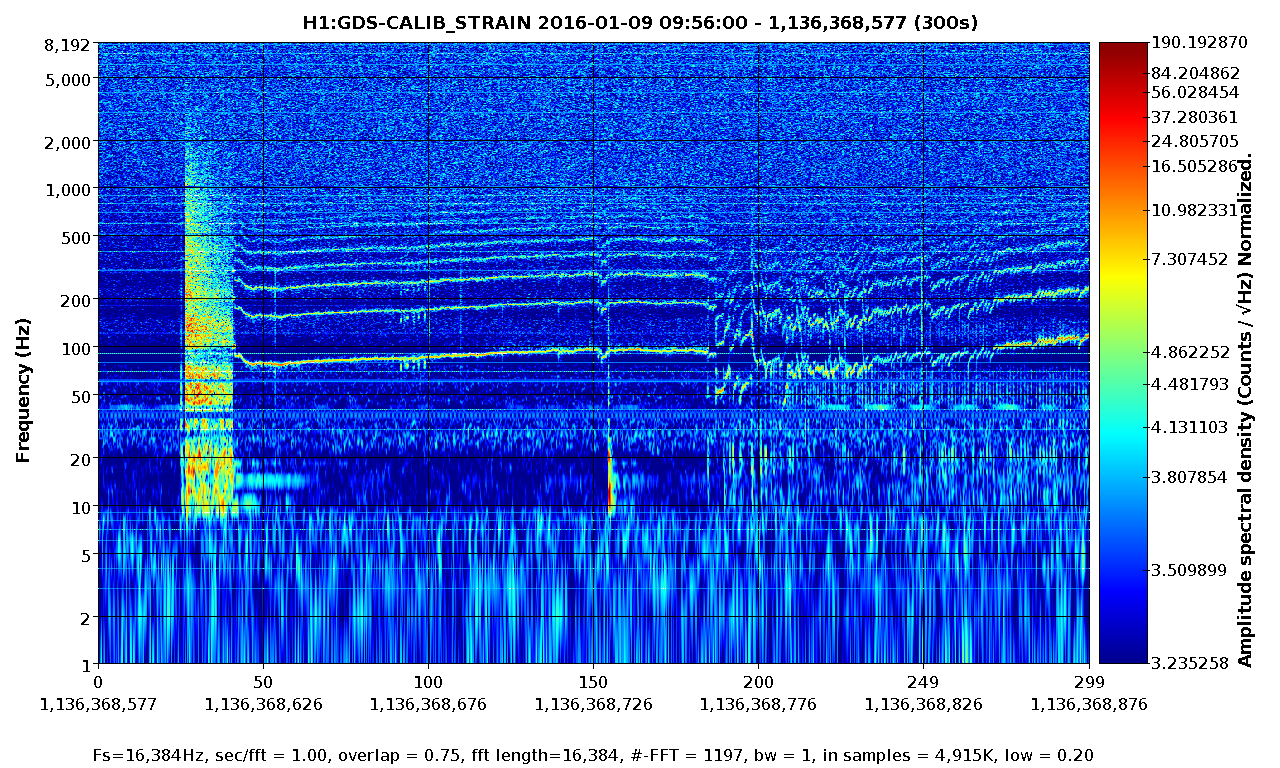
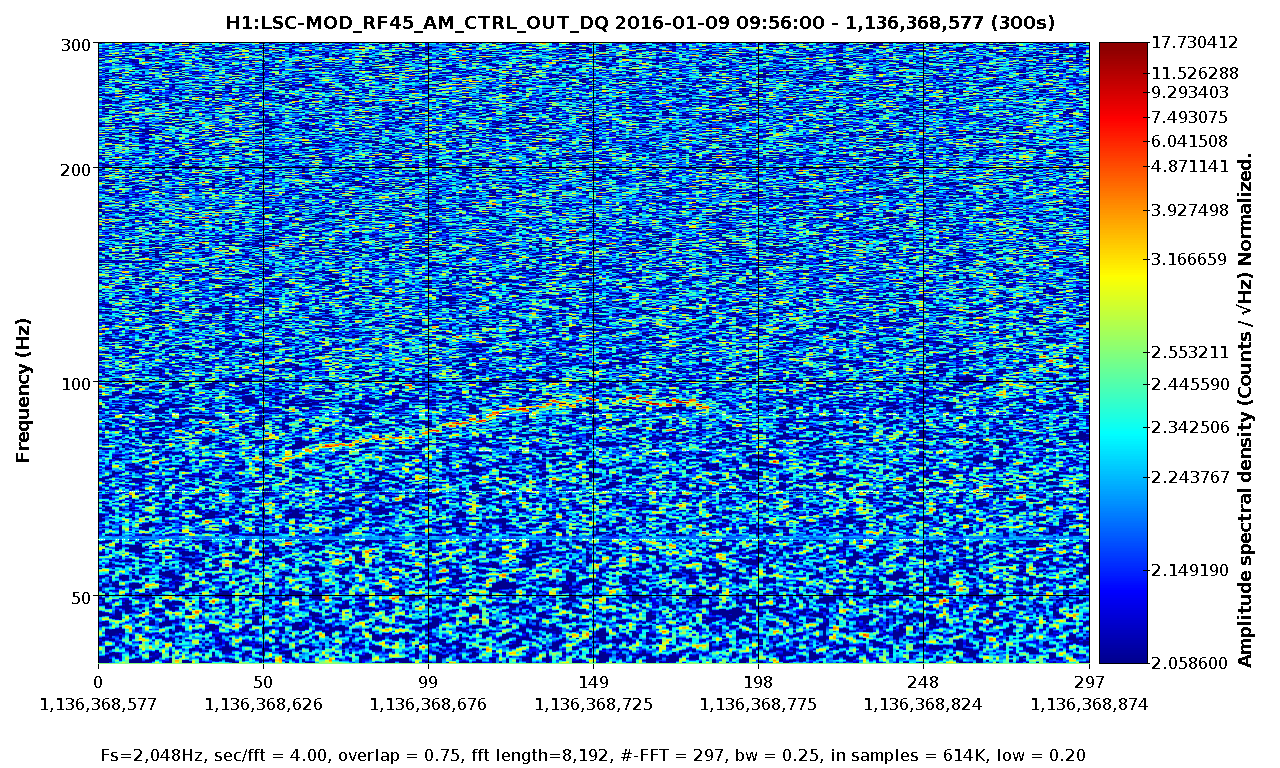
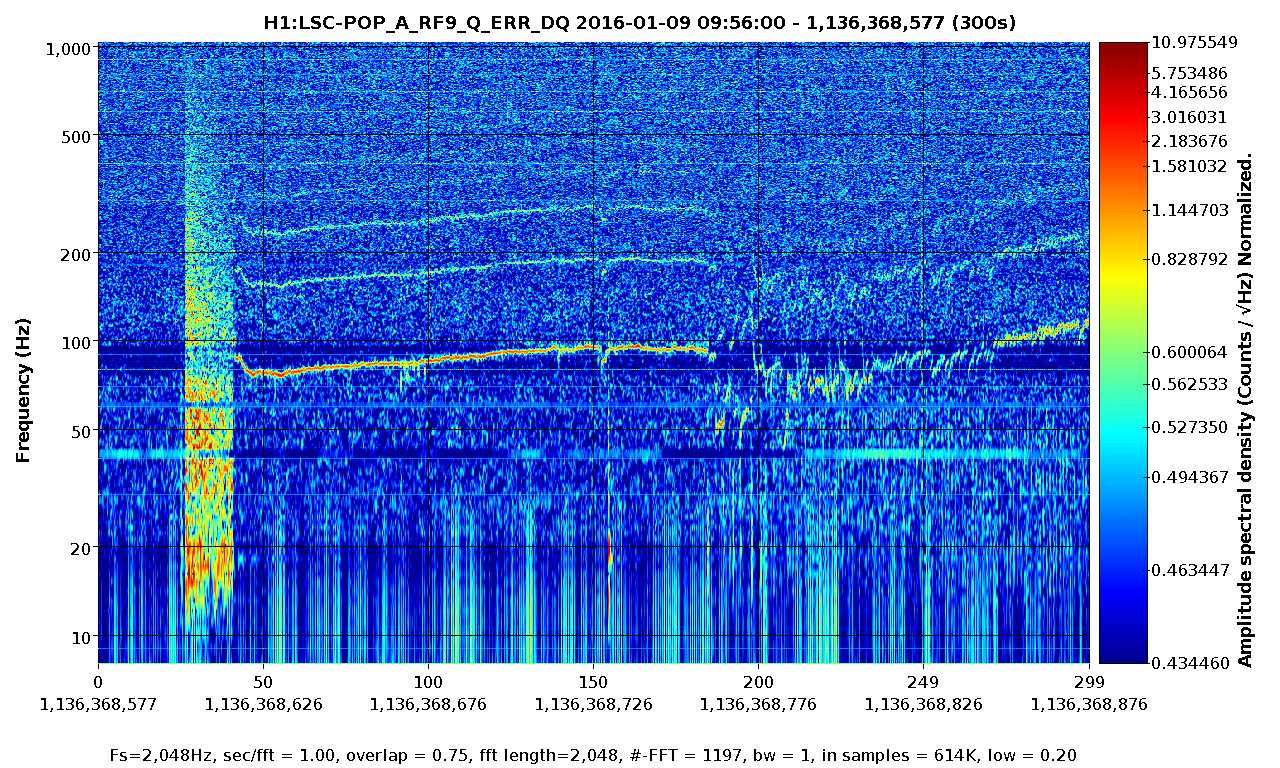
We've finish the afternoon's worth of full IFO calibration measurements, including broad-band white noise excitation with PCAL into DARM (like LLO aLOG 22191) and true DARM / CARM excitations at given frequencies (like LLO aLOG 23184). We'll analyzed the data in the future, but the times for the injections are as follows:
(All times are 2016-01-09 UTC day)
36.7, 331.9, and 1083.7 [Hz] excitations of CARM 02:00:30 to 02:07:00 UTC
36.7, 331.9, and 1083.7 [Hz] excitations of DARM 02:10:00 to 02:17:00 UTC
Broad-Band excitation from PCALY 18:19:00 UTC to 18:34:00 UTC
Although we plan to analyze the data offline looking at much longer integration times, but .xml templates live here:
/ligo/svncommon/CalSVN/aligocalibration/trunk/Runs/PostO1/H1/Measurements/PCAL/
A 2016-01-08_H1DARM_PCALY_BBEXC.xml
A 2016-01-08_H1PCAL_TrueDARMCARM_Drive.xml
A 2016-01-08_H1PCAL_TrueCARM_Drive.xml
A 2016-01-08_H1PCAL_TrueDARM_Drive.xml
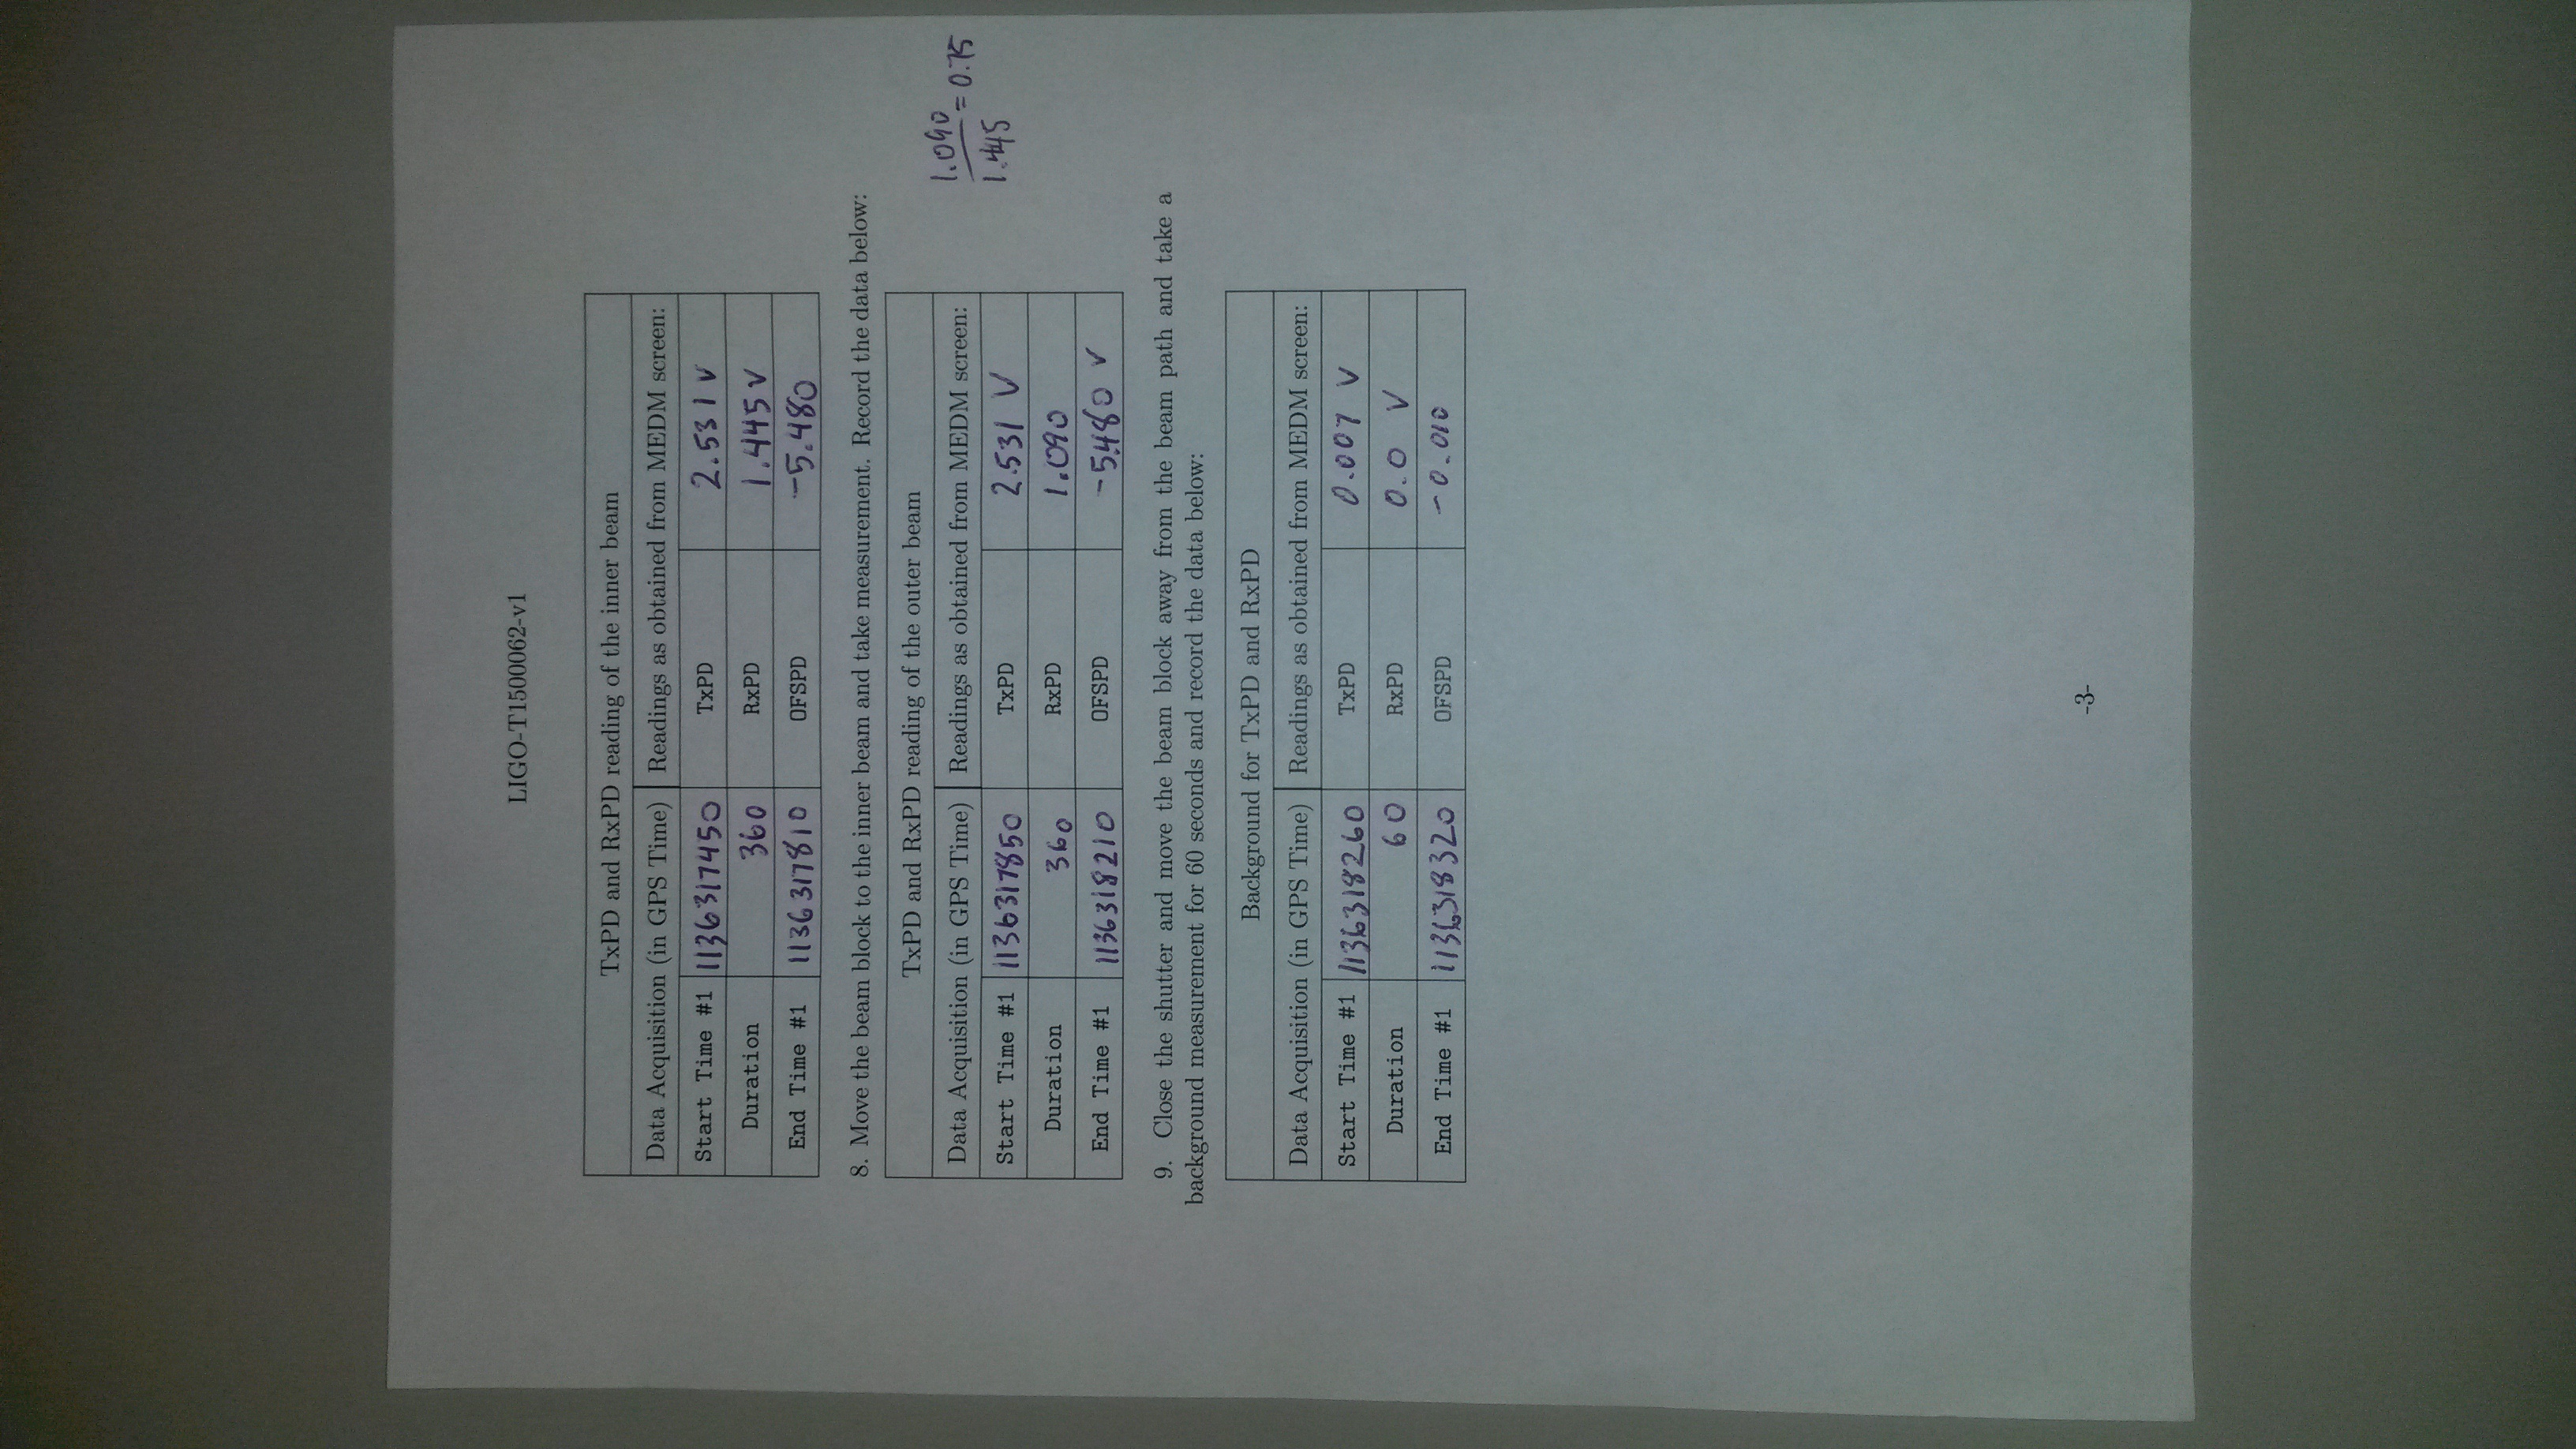
In addition, we also grabbed 5 minutes of data where we drive the 331.9 [Hz] line in both PCALX and Y, again in CARM and DARM, but *much* harder than normal, such that we can calculate the PCAL's relative calibration with excellent SNR and precision.
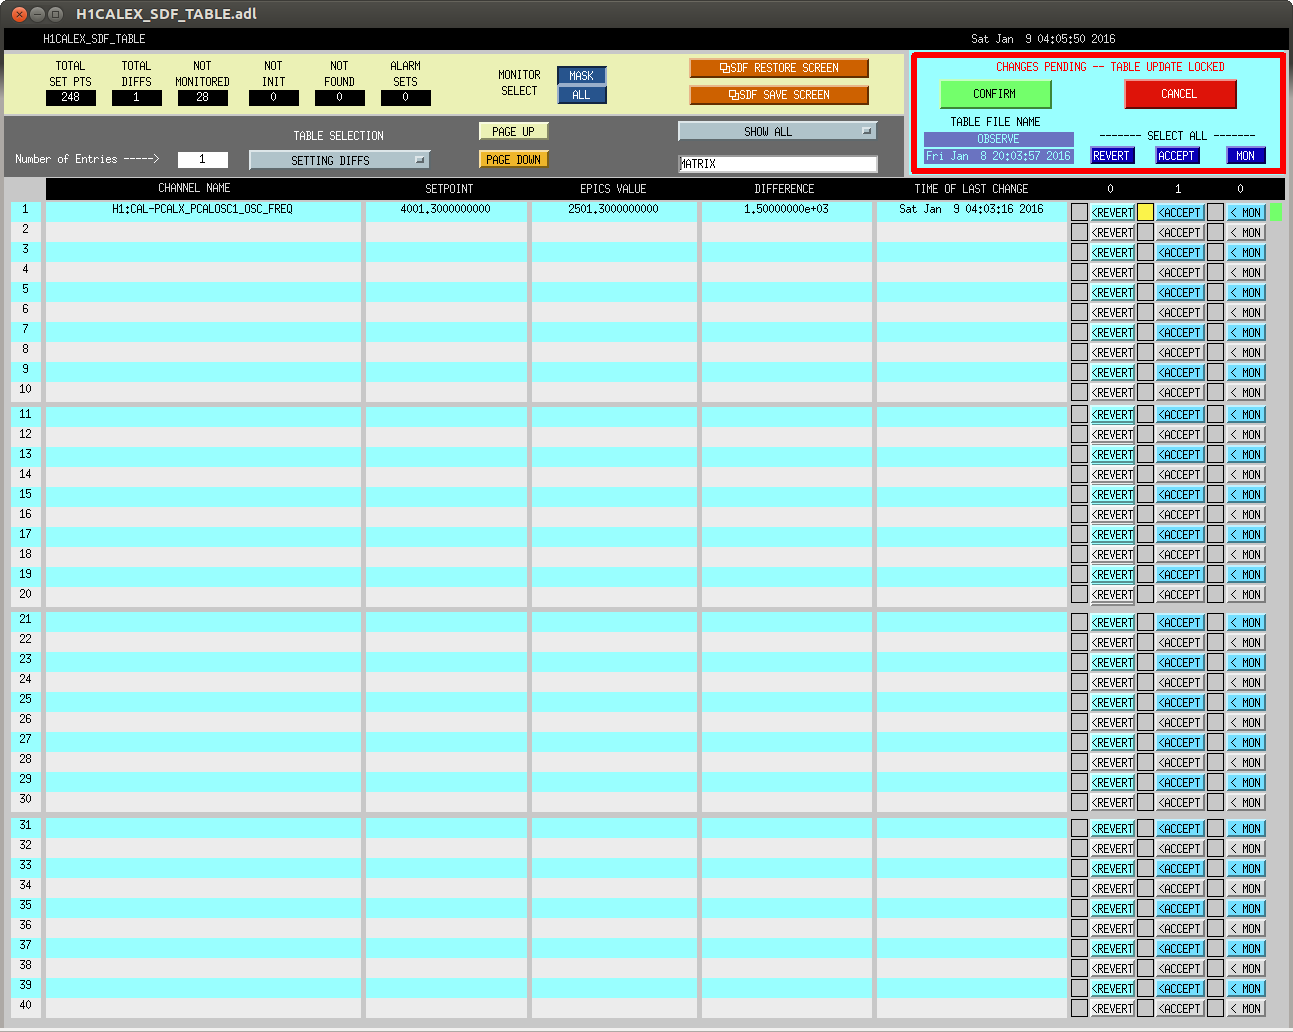
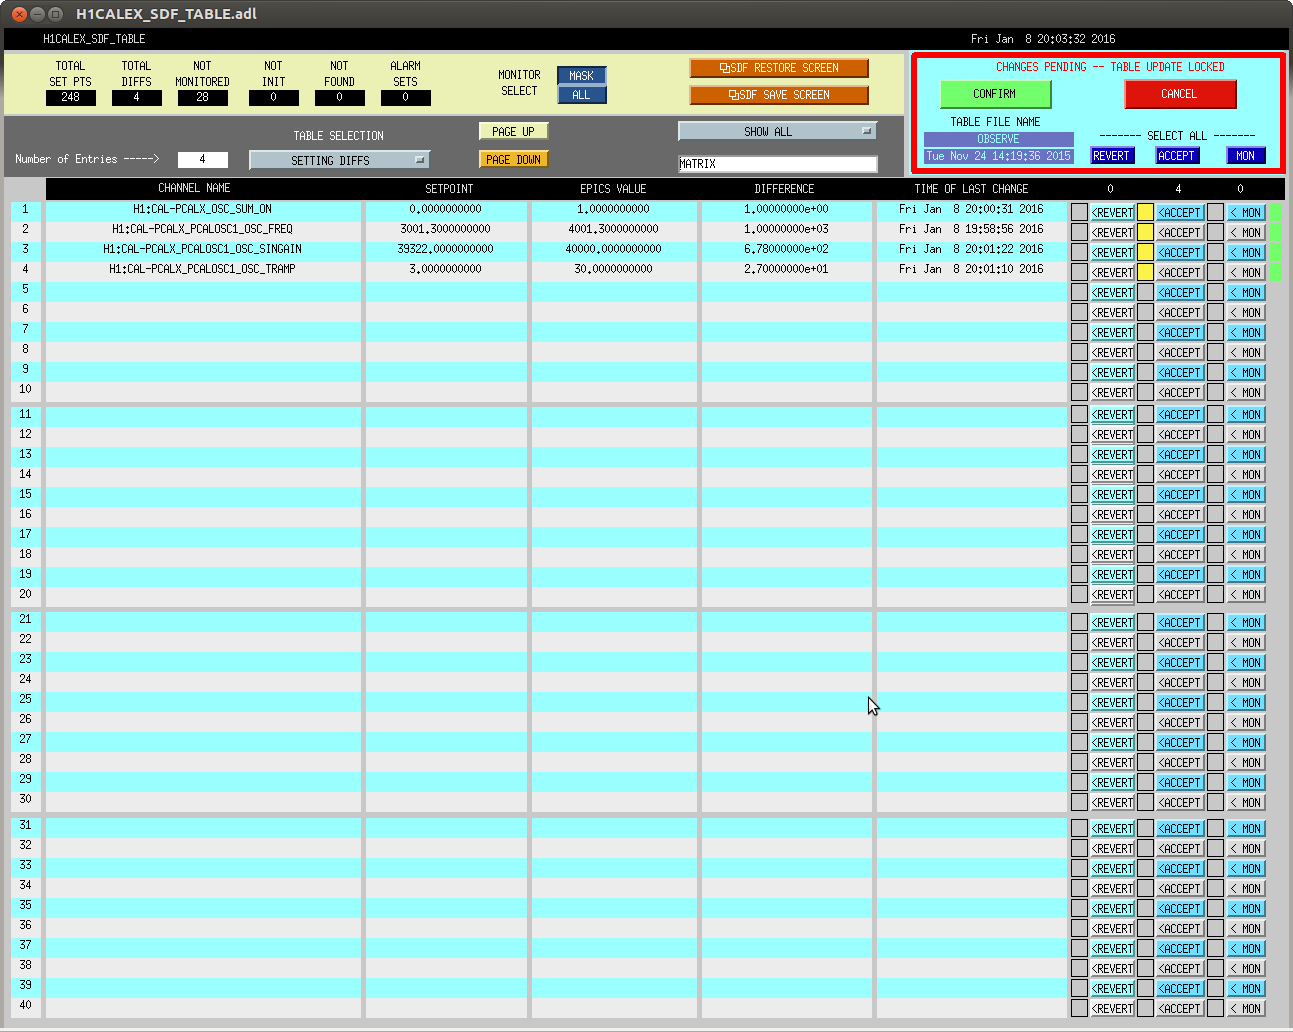
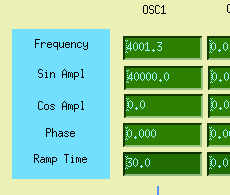
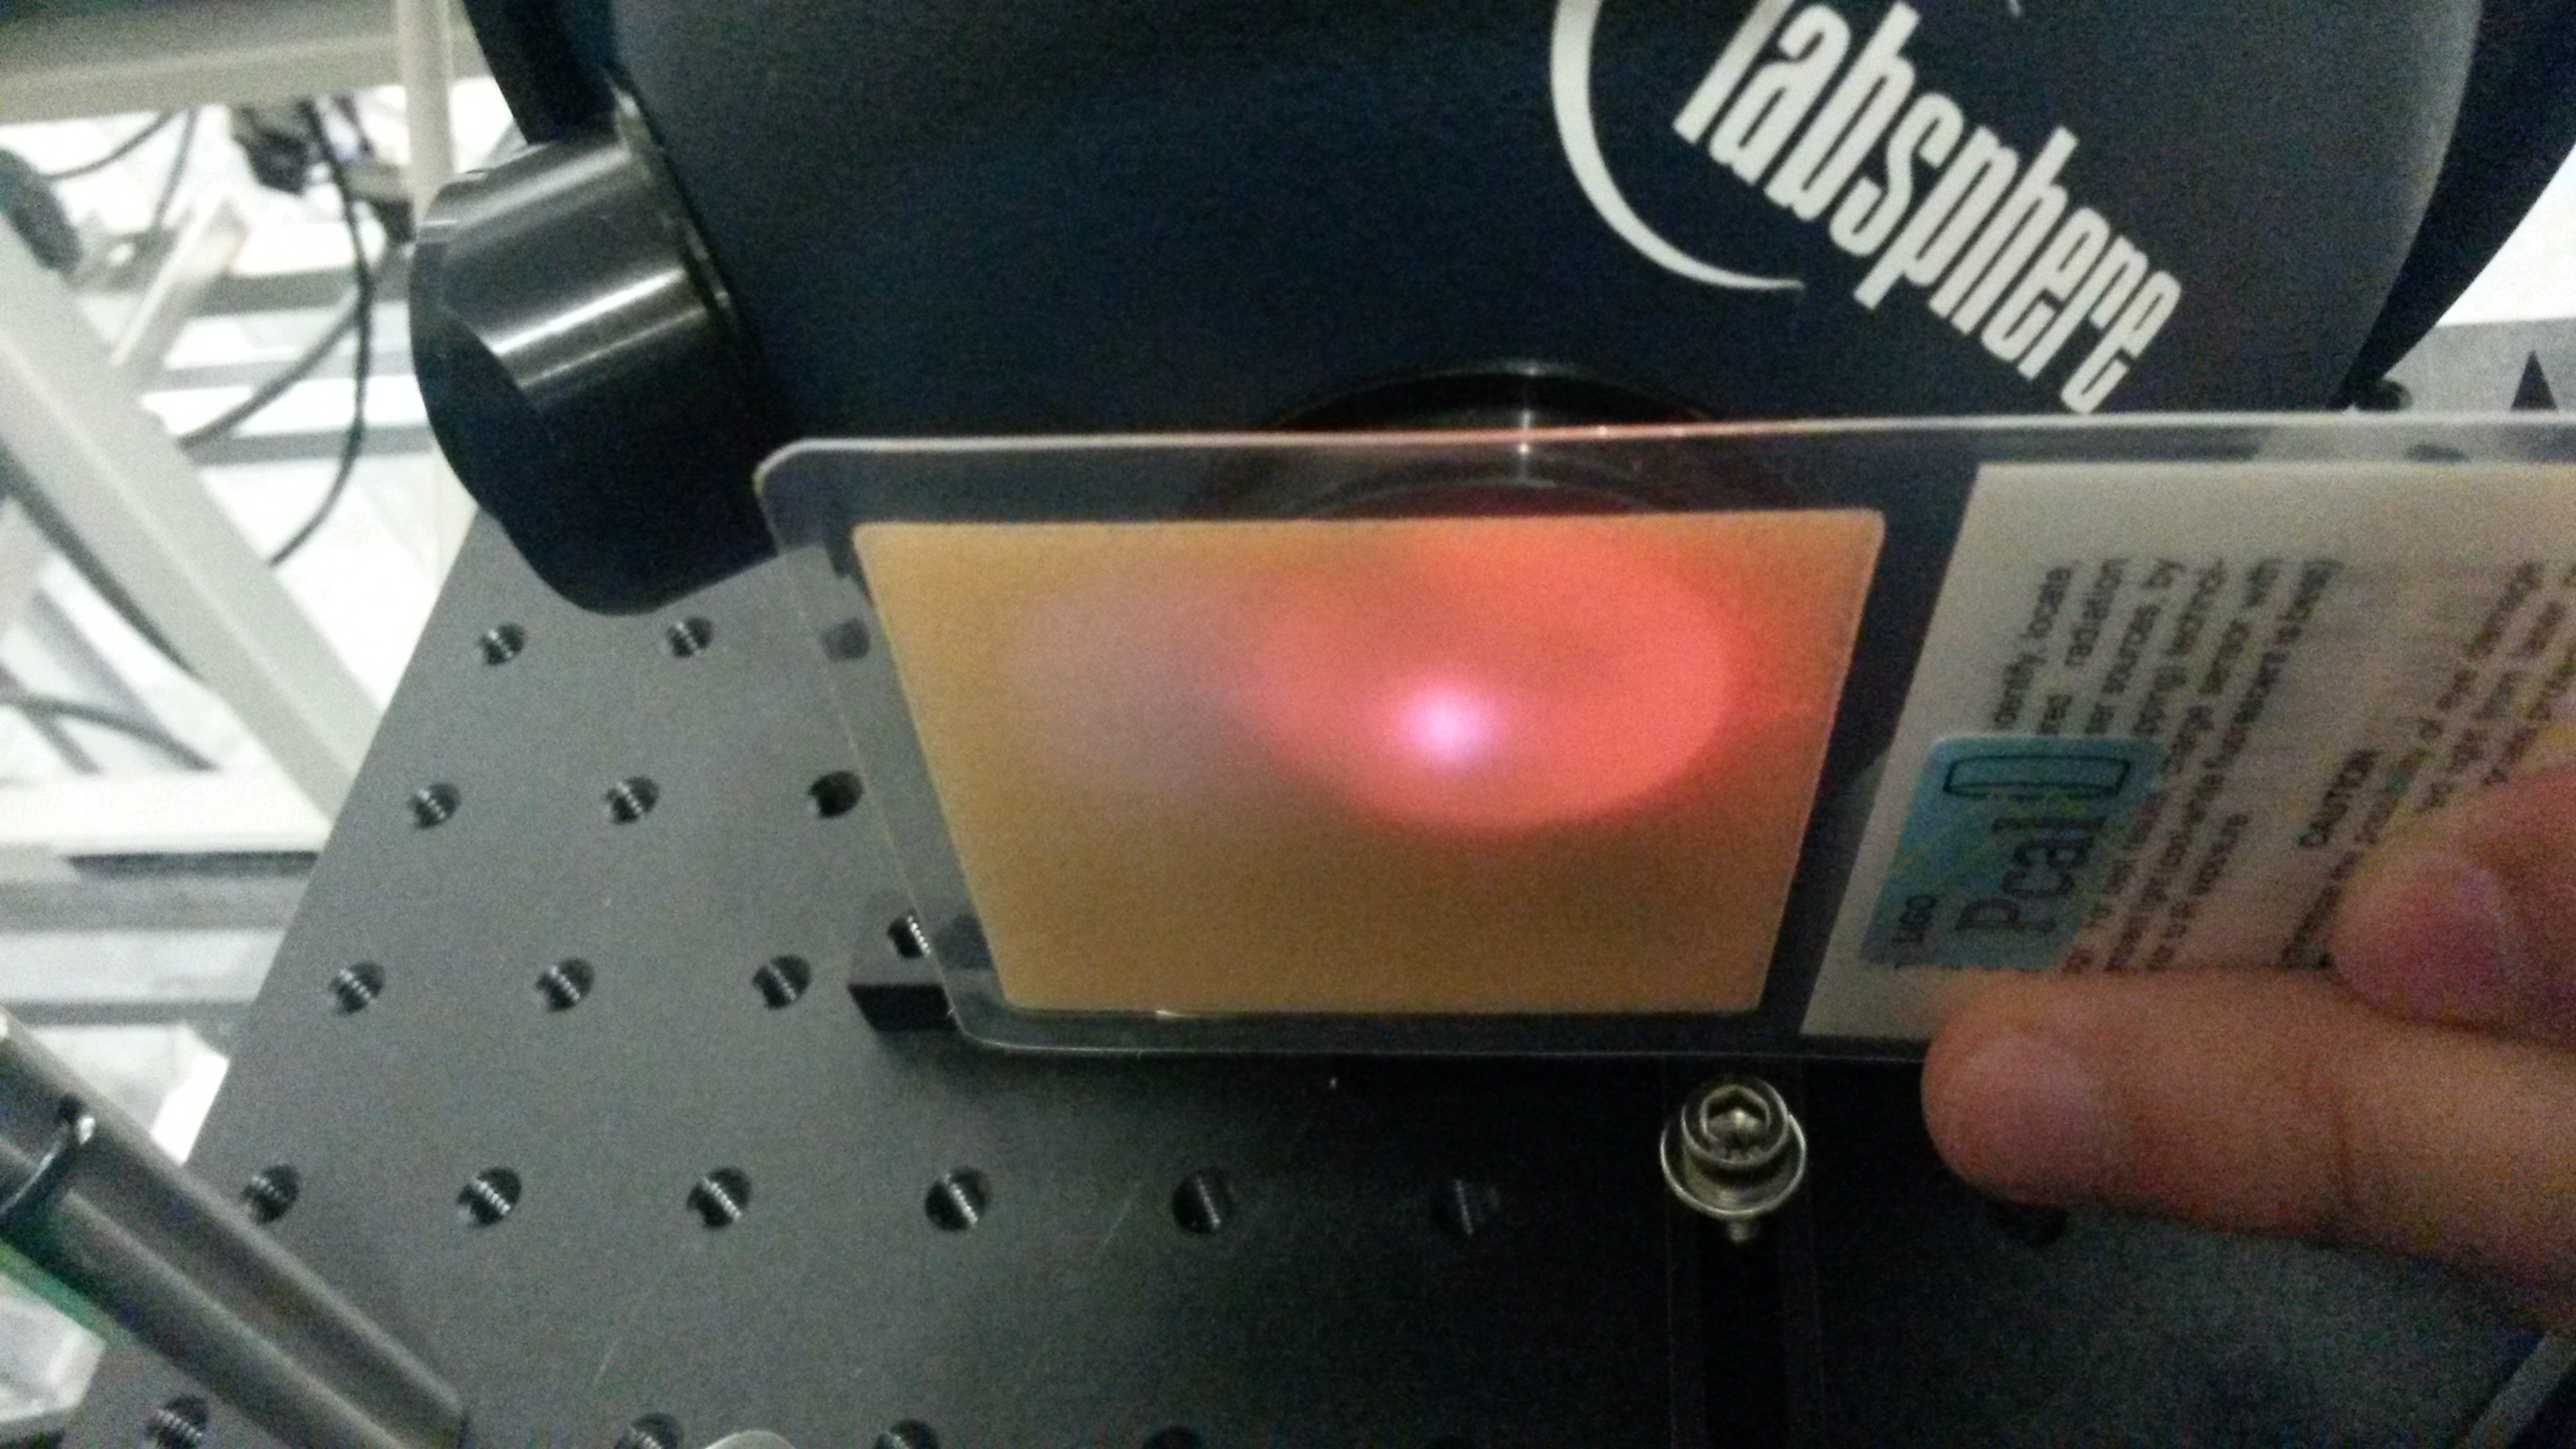
We've also turned on an X-end PCAL calibration line at 4001.3 @ 40000 [cts], which we intend to leave in place overnight (i.e. we'll accept in the SDF sysetm, and run it over night). This was turned on at roughly 04:02:00 UTC, attached is the screen shot.
331.9 excitation of CARM 03:31:00 UTC to 03:36:00 UTC
331.9 excitation of DARM 03:38:00 UTC to 03:43:00 UTC