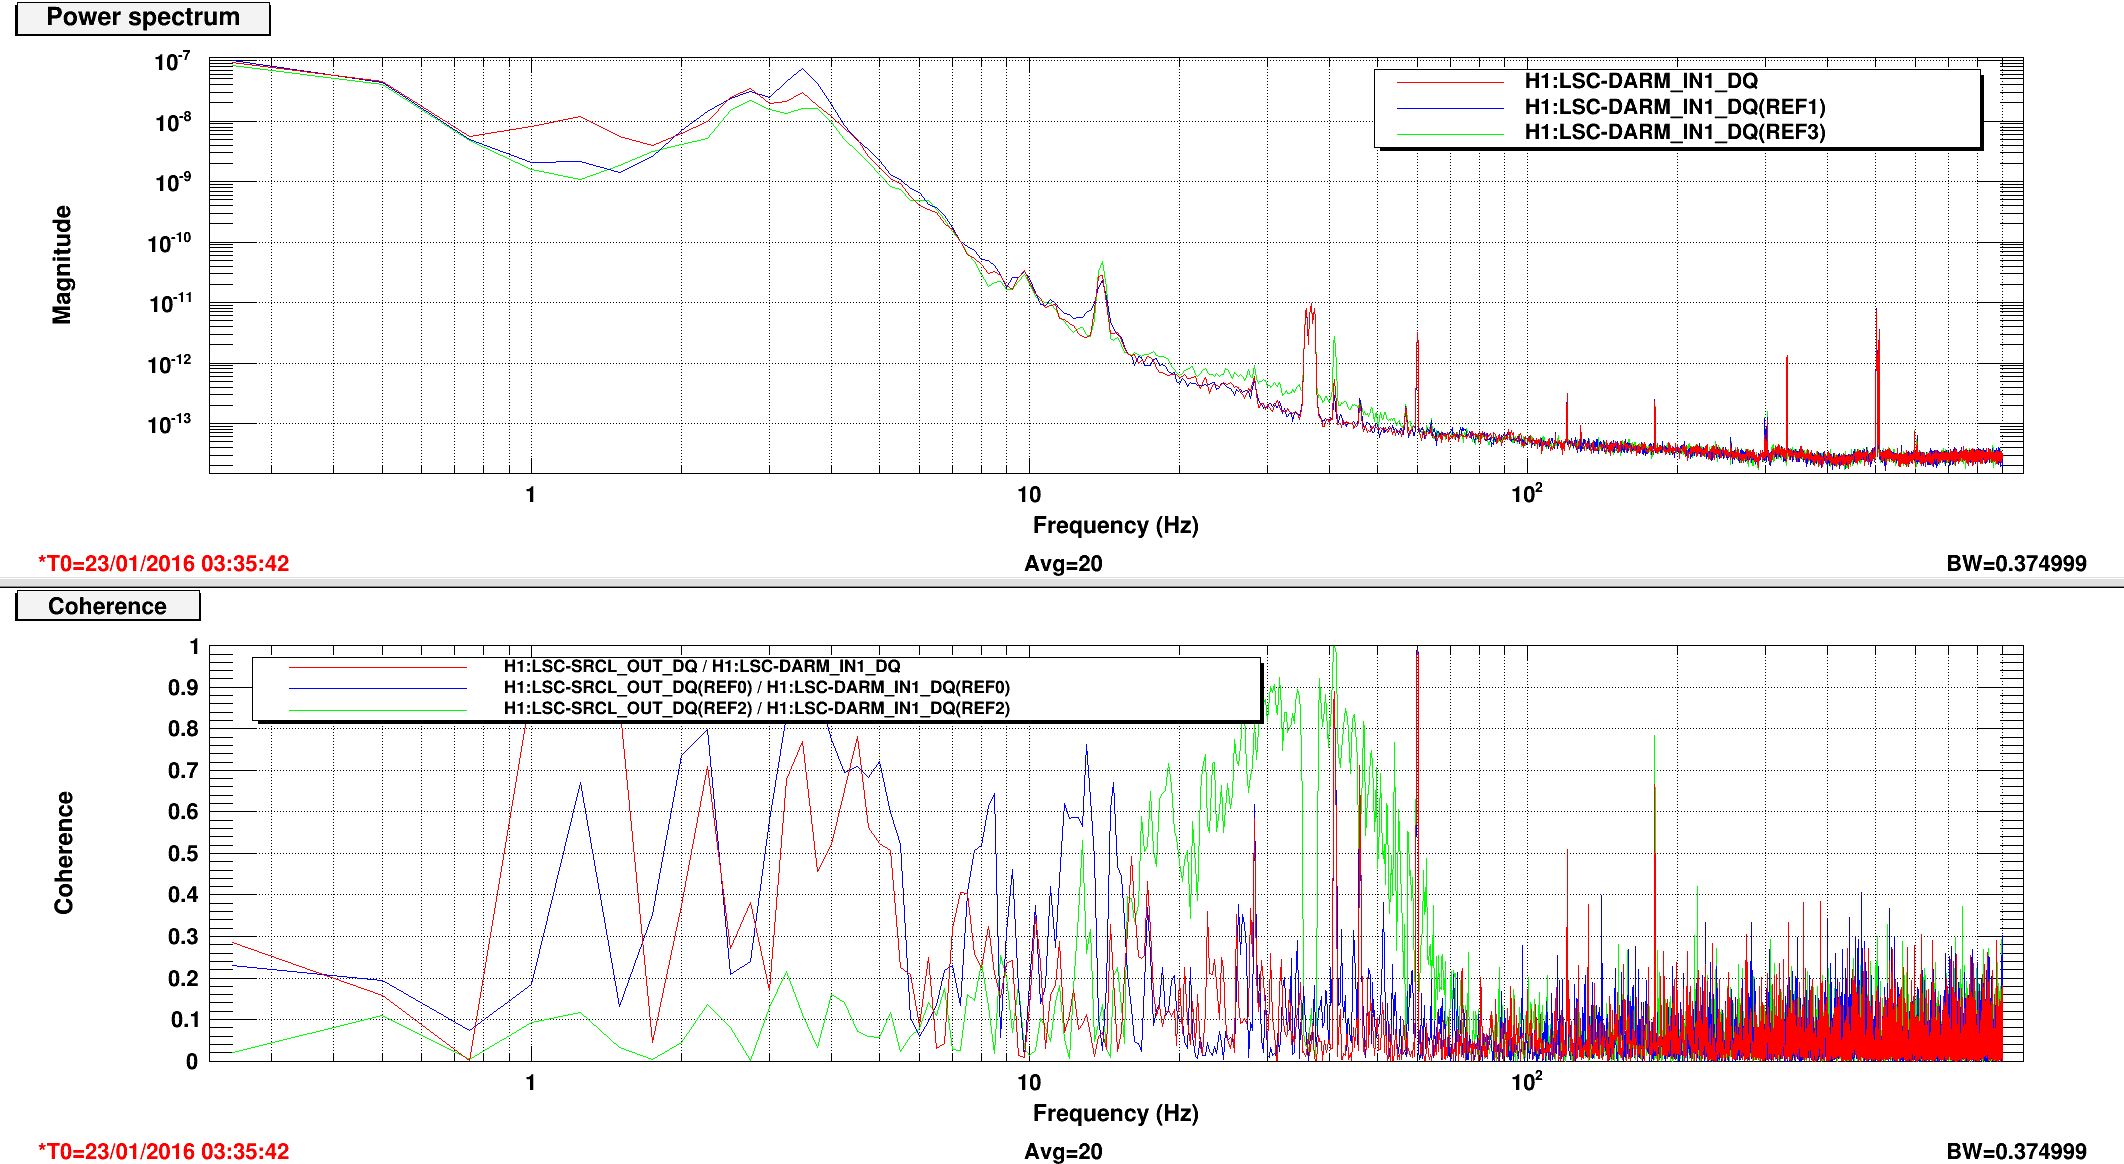
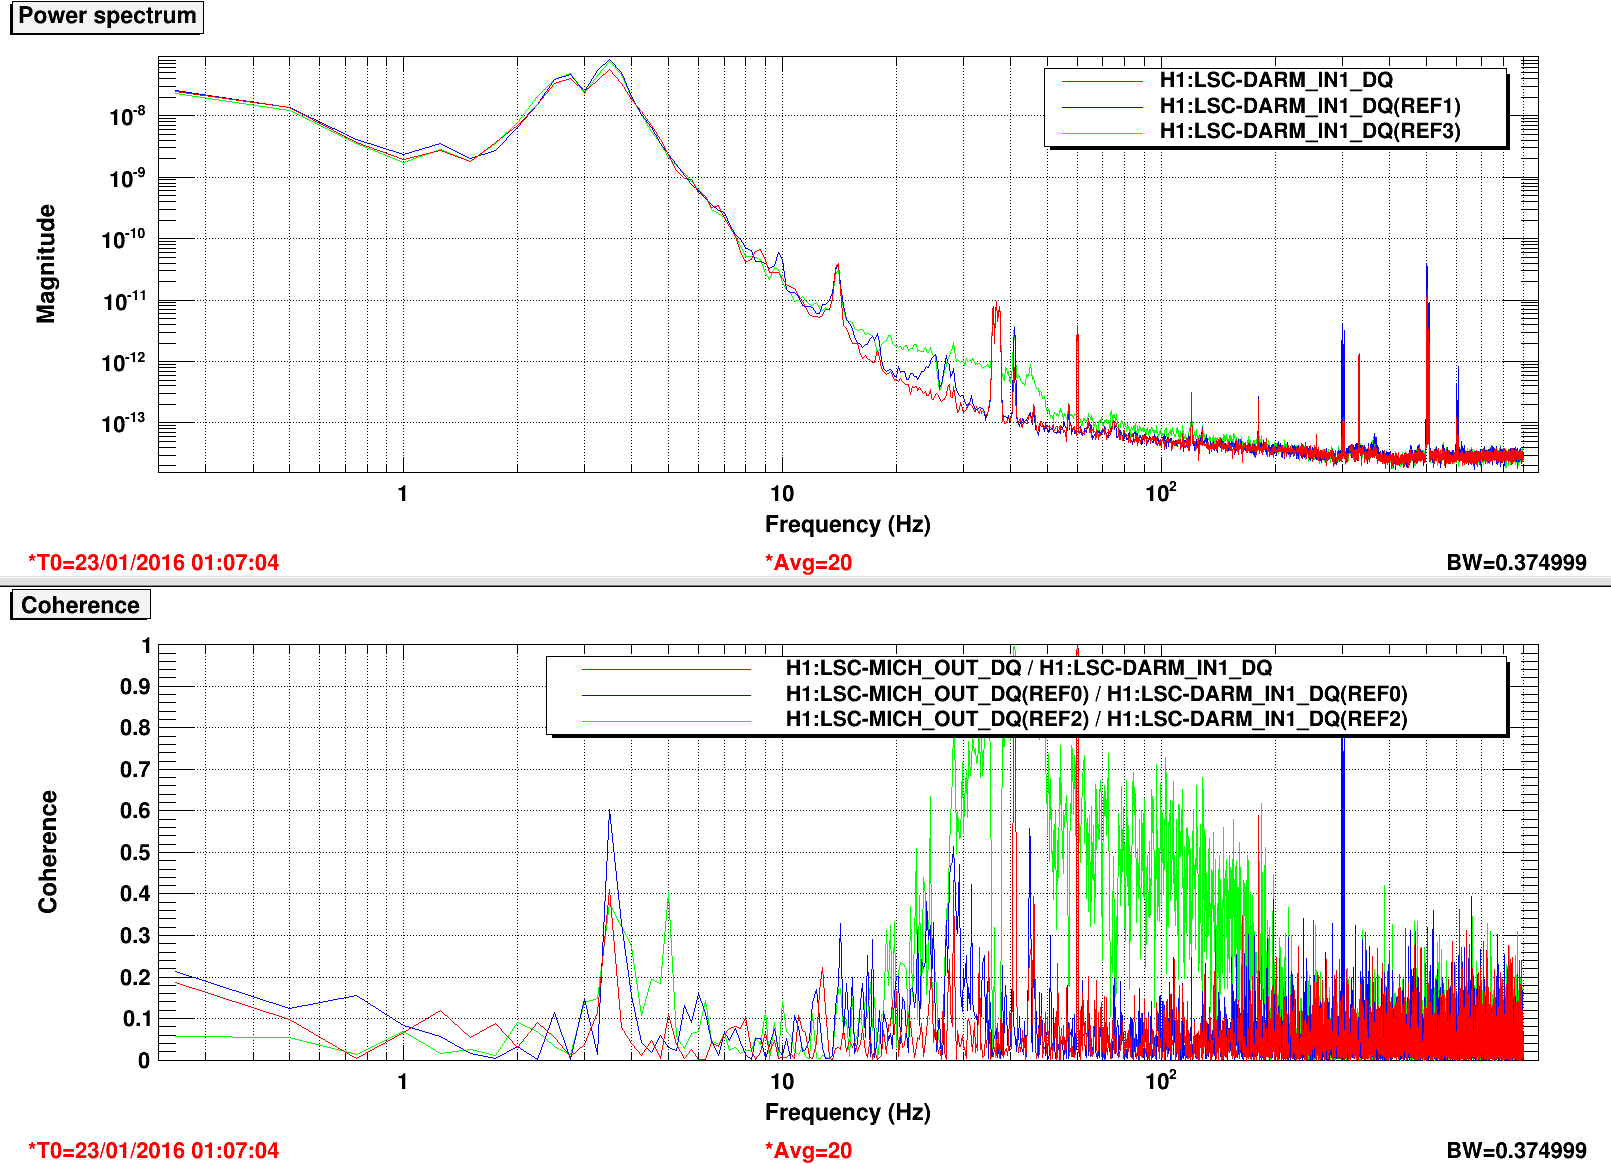
Based on discussions during the Calibration Committee call today, we decided to eliminate the 157.9 Hz low-SNR calibration line.
We switched off the excitation which was in the OSC2 position.
So we are now driving at 36.7 with SNR of about 100 for calculating the actuation correction, kappa_A (see LIGO-T1500377), and 331.9 Hz with SNR of ~100 for calculating the sensing correction, kappa_C, and f_c, the cavity pole.
We are also driving at 1083.7 Hz with an SNR of about 40.
All SNRs quoted are with 10-second FFTs.
As soon as we inspect and tune up the Xend Pcal, we plan to start an excitation at 3001.3 Hz with a relatively low SNR (all that we can achieve at this high frequency).
LLO will run lines spaced within 1-2 Hz of hte LHO lines.
This is our current plan for the Pcal lines for the O1 run.
Brute force coherence report for the lock reported in 20020 is available here:
https://ldas-jobs.ligo.caltech.edu/~gabriele.vajente/bruco_1122206417/
At a first quick look:
More analysis in the future...
This morning I measured the OLTF of IMC ASC DOF5 loops (attached, OLTF on the right, gain settings on the left). As you can see I'm not using PIT as the current non-aggressive filter is not doing anything useful.
I did on/off test using IM4 trans sum as the sensor (attached middle). As you can see 300Hz intensity noise is suppressed by a factor of 5 at the expense of small gain peaking at around 200-250Hz, 350-400Hz and 620Hz.
Note that the 620Hz peak will be stable against 10dB change in the gain (i.e. even if the peak will come above unity gain), but will quickly become unstable beyond that point.
DOF5 Y loop is left ON.
Matt, Lisa, Sheila
Today we had the mixed blessing of our refl trans/resonance/analog CARM locklosses reappearing. We noticed two things, first that the pitch motion we see in the oplevs seems to be a result of an instability in the DHARD loop (by adjusting the gain we could reduce it), and second that when we turn on the DHARD boosts in the state resonance this is somewhat rough and we think this sometimes causes locklosses.
Although we could probably solve this problem by changing the alignment, we wanted to spend some time trying to fix it to avoid this in the future. We measured the DHARD PIT loop at various places in the CARM offset reduction, and have found gains to keep the ugf around 4 Hz throughout the whole process. This allowed us to turn on a boost at the CARM_5PM step, which seemed to make things much more stable in refl trans and resonance. Matt redesigned the boost to make the turn on transient softer, we can no longer tell from the AS camera when the boosts come on. In the attached screenshot the red trace shows transfer functions measured at CARM_5PM, blue is before engaging Matt's new boost, red is with the first of the boosts on (boostLTE, which gives us about 6dB of gain below 1Hz ).
We have been running with oplev damping on the ITMs and not the ETMs, but since we have moved to the HARD/SOFT basis we would like to turn off the ITM oplev damping. We tried the whole sequence (with DHARD changes done by hand) with oplev damping off, and everything worked until we increased the power. It seems like this was due to an instability in DHARD YAW at 23 Watts, which can be solved by turning the gain down slightly. (from 7 to 5)
We were tesing this automation, and had a small earthquake. We decided to revert the changes in the DHARD gain throughout the CARM offset reduction (but kept the new boosts and are still engaging them before REFL_TRANS), because we wanted to see that the IFO could lock before we left. Also, we are now leaving the oplevs off for the CARM offset reduction. We were able to lock on low noise for a few minutes, but an instability in DHARD PIT knocked us out after a few minutes.
Other things:
While at 24W, we also tested the new ISS second loop: no problems. We didn't get a chance to do any loop characterization measurements, but after a little tweak to the IMC_LOCK guardian the ISS came on. The new ISS guardian tunes the pre-loop closure offset to produce a servo output of 0.5V (rather than zero), which prevents a turn-on transient (the "shark fin" seen in the diffracted power).
Sudarshan, Travis
We used today's maintenance period to check the PCALX clipping issue mentioned in alog #19899. We moved the clipped beam using the last mirror ( the one that directs the light to the test mass) in the transmitter module and were able to get the reflected beam on the receiver side at a fairly reasonable level. There was a very narrow window in our alignment in both pitch and yaw to get the beam out on the receiver side and we are guessing we are very close to the edge of one of the optics inside the chamber.
The laser power as measured by ophir power-meter are as follows:
Inner Beam | Outer Beam | |
Transmitter Side | 0.738 W | 0.734 W |
Receiver Side | 0.718 W | 0.712 W |
We will check the beam balance between the two beams and optical efficiency during our next calibration and touch up the alignment if needed.
The Xend Pcal module has some issues.
Today Sudarshan and Travis made some adjustments that seem to have eliminated the clipping (aLog from Sudarshan forthcoming).
But while setting the Pcal excitations today we noticed that we don't have a readback of the AOM excitation. It may be a cabling issue.
More relevant is that the power seems to be significantly lower than expected, about 30%.
We left the laser operating and illuminating the ETM, but without excitations. This will allow us to diagnose if the clipping issue is resolved.
When time allows, we will go to Xend and investigate further.
All of the necessary calibration lines can be generated from one Pcal module; they are currently running at Yend.
Eventually, we plan to use the Xend Pcal for a single high frequency line near 3 kHz, and as a spare in case we have issues with the Yend module.
ShivarajK, RickS
We changed both the Pcal and DARM_CTRL excitations to the following (expected SNR with 8 sec FFTs in parentheses):
PcalY:
36.7 Hz at 360 cts. (90)
157.9 Hz at 575 cts. (41)
331.9 Hz at 2,320 cts (90)
1083.7 Hz at 24,000 cts (36)
DARM_CTRL
37.3 Hz at 0.31 cts. (90)
These are our best current estimate of what we will want to have for O1. We expect to make similar changes at LLO, with their calibration lines within a hertz or two of ours.
The other excitations (including those from the Xend Pcal) have been switched off. Snapshots of the relevant sections of the MEDM screens are attached below.
The total Pcal excitation range is about 42,000 counts so the 1083.7 Hz line uses about 60% of the range and the other three lines together use about 8% of the range.
I installed an ad-hoc DOF5 filters for both PIT and YAW, and set up the input matrix to use WFSA for PIT and WFSB for YAW. The selection of sensors is based on the coherence with OMC DCPD between 200 and 400Hz (attached left).
PZT to WFS transfer functions were measured yesterday (attached, middle two windows).
I copied LLO filters, gave it some more attenuation at lower and higher frequency and rotated the phase in a direction that I thought would work for the measured TF.
I didn't do any tuning except to turn the servo on and to change the gain so it started to squish 300Hz bump in IM4 trans SUM.
I'll leave it OFF for now.
After the BIOS change to h1susey yesterday afternoon we turned off the periodic clearing of the DIAG_RESETs so any glitch will latch on. At 02:34:43 PDT we got an TIM+ADC glitch on the SUS EY IOP stateword which remained on until Jeff cleared it at 07:52:43 PDT. Soon after that I restarted the clearing of the DIAG_RESET every minute to get better statistics. For the past 24 hours the 02:34 glitch is the only one seen.
I've written a python script which takes the output from command-line-nds and bit masks out the upper overflow/excitation/cfs bits to make the analysis easier.
Yesterday Joe ran Keith's script to generate the L1 science frame channel list broken down by subsystem and data rate. I have ran this script on the H1 DAQ and compared the two lists. The two report files are attached below.
Here is a summary of the differences per subsystem. For each subsystem, the differences are given as [number of H1 channels, number of L1 channels] for each acquistion rate. Green cell means L1>H1, beige cell H1>L1. Blank cells mean either no channels at that rate or no difference in the number of channels between the sites.
system | 32k | 16k | 8k | 4k | 2k | 1024 | 512 | 256 |
susauxb123 | [50,67] | |||||||
psliss | [0,1] | [6,7] | ||||||
pslpmc | [6,2] | |||||||
pemcs | [23,17] | [15,9] | [5,9] | [37,24] | [4,0] | [10,7] | ||
oaf | [2,8] | |||||||
asc | [53,47] | [0,22] | ||||||
susetmxpi | [2,0] | |||||||
susetmypi | [2,0] | |||||||
pemey | [4,3] | [9,6] | [3,2] | [12,6] | [4,0] | [9,13] | ||
pemex | [4,3] | [9,6] | [3,2] | [12,6] | [4,0] | [9,13] | ||
alsex | [1,0] | [2,0] | ||||||
alsey | [1,0] | [2,0] | ||||||
iscex | [1,0] | [7,10] | ||||||
iscey | [1,0] | [7,10] | ||||||
Calculating the difference between additional L1 channels verses H1 channels and taking the data rates into account gives an additional data rate of 984 kBytes/second for H1 frames. This means the H1 64 second science frame should be approximately 64MB larger than L1.
I compared some L1 and H1 science frame sizes, the H1 frame was larger by 78, 95, 82, 83 MB. This roughly agrees with the calculation, there will be variation due to the overall compression of the entire frame.
Scott L. Ed P. Rodney H. 7/27/15 The crew finished moving equipment and hanging lights. 59 meters of tube cleaned ending at HSW-2-052. Tested clean sections and started moving cords and generators. 7/28/15 81.5 meters of tube cleaned ending at HSW-2-047. 7/29/15 79.6 meters of tube cleaned ending at HSW-2-044.
While editing the ISI senscor screens, I noticed the HEPI screen was also inaccurate so I corrected that.
Attached is a before and after view with the model to the left. Notice above the Wiener path sums in after the match filter banks. That is not correct. The medm now correctly depicts the model signal path, below. Will svn commit and alert LLO.
Edit--I forgot to say, I has noted a while ago (and written on the medm) that the IPS incoming signal was the Location Mon rather than the Residual Mon with the alignment bias position subtracted. I also corrected this to better reflect the signal for the medm viewer.
LVEA: Laser Hazard Observation Bit: Undisturbed 07:45 Cleared TIM, ADC, & IPC errors at both end stations 08:00 IFO Locked at 24.3W and 65Mpc 08:20 Hanford Fire department on site 08:35 IFO LockLoss – Commissioning activities 09:00 Jason & Peter – In the PSL 09:30 Sudarshan – Going into LVEA to remove ISS Outer Loop Servo 09:36 Bubba – Moving items in and out of LVEA Hi-Bay 10:12 Kyle & Gerardo – Going to End-Y beam tube to work on new Ion pump 10:44 Sudarshan & Kiwamu – Going to LVEA to install repaired ISS Outer Loop Servo 11:00 Sudarshan & Kiwamu – Out of the LVEA 11:05 Sudarshan & Travis – Going to End-X for PCAL clipping investigation 11:03 Vinnie – Going to Mid-X 11:05 Kyle & Gerardo – Going into End-Y to recover an Ion pump 11:30 Rick – Going to End-X for PCAL work 11:45 Kyle & Gerardo – Back from End-Y 11:50 Jeff – Deliver tools to PSL Enclosure 12:15 Jason & peter – Out of the PSL enclosure 12:18 Rick, Sudarshan, & Travis – Out of End-X 12:24 Kiwamu – Going into LVEA to take TF on ISS Outer Loop Servo 12:36 Jim, TJ, & Cheryl – Going into the LVEA to reset the NPRO RRO 14:13 Kiwamu & Sudarshan – Out of LVEA
Sudarshan, Kiwamu,
This is just a brief update of what we did with the ISS during the maintenance window today.
Yesterday, Sudarshan and Matt came up with another idea of a quick hack in order to increase the gain margin of the ISS 2nd loop. The idea is to modify the unused filter path of the ISS 2nd loop servo box to obtain more poles and zeros without making a change in the main servo filers. We pulled out the servo box out of the PSL rack, soldered some components on the board in the EE shop and put the box back to the rack. The above plot is the open loop transfer funciton of the 2nd loop after the modification. As shown, the slope of the open loop is now steeper than it used to be, indicating a more gain margin. We will post more details about the circuit modeling, today's mofication and noise model.
The open loop measurement was done with a PSL power of 2.4 W. PD1-4 were used as in-loop sensors, the second loop gain was at the maximum of 40 dB, the boost and integrator engaged, and the additional gain was also engaged. The raw data is attached -- the first file is the magnitude in dB and the second for the phase in degrees.
J. Oberling, P. King
Power Budget
We measured the power at several points around the PSL:
There are 2 PDs that need to be recalibrated: PD_AMP (which monitors the power out of the frontend) and PMC_TRANS (which monitors the power transmitted by the PMC). Due to time constraints and interference with IFO recovery and commissioning activities (have to turn the ISS off to recalibrate PMC_TRANS), the recalibration has not been performed yet. Will be done ASAP.
HPO Contamination Check and Green Light Inspection
Since we had to take the lid off the HPO box to measure PD_AMP, we also inspected the inside of the box for contamination. This is something that had been on our radar to do next time we opened the HPO box. Matt had noticed back in April (see LLO alog 17972) that the LLO HPO box had a large amount of contamination, specifically underneath the holes where the lid is screwed down to the box itself. We also noticed some particulate underneath the screw holes, but not to the extent that was seen at LLO. Peter took pictures and will post them. We went ahead and wiped the screw holes, lid holes, and screws themselves with wet IPA wipes.
We also tood one of the green flashlights and looked at a few optics to get a feel for general PSL contamination. All and all it wasn't too bad, once again nothing like was seen at LLO. Peter took some pictures of mirror M26 (in the FSS path), and the top and bottom mirrors from the IO periscope. We used a couple small puffs of air to see if we could dislodge some of the dust on M26; this was successful (see pictures). We also looked at the PMC mirrors with the green light; these looked clean, we couldn't see any dust.
Modified TTFSS Box Round 2
Peter had made some more modifications to one of the spare TTFSS boxes (same one we used last week, see LHO alog 19872), so we installed it again. Unlike last time, the FSS would not lock with the modified box installed. It would seem like it was about to lock, we could see flashes of the 00 mode as the NPRO frequency was changed, but it wouldn't lock onto it. At this time we aren't sure as to why. We reinstalled the original TTFSS box and the FSS locked without issue. We measured the UGF at 2 different Common Gain settings (Fast Gain was constant at 22.2 dB):
Peter has the data for these measurements and will post it as a comment. We restored the Common and Fast gain settings to their original values of 20.7 dB and 22.2 dB, respectively. Will investigate why the modified TTFSS box was not working.
The measured TTFSS open loop transfer function with the common gain set to it's "default" of 20.7 dB and when set to maximise the unity gain frequency. (ttfssoltf.png) The gain sliders were left how we found them. Namely common gain 20.7 dB and fast gain 22.2 dB. In the default condition, the unity gain frequency was around 200 kHz. With fast gain at 27 dB, the unity gain was in excess of 600 kHz. One of the mirrors in the beam path after the frequency shifting AOM, before and after using compressed air. The bottom and top mirrors of the IO periscope. For the top mirror, most of the dust was on the back surface - not surprisingly.
Daniel gave me the test rig for the AM stabilized EOM drivers that we should be receiving from Caltech this week. This allowed me to test that the Beckhoff controls and readbacks work as expected. I also made a summary screen (ISC_CUST_EOMDRIVER.adl) of these readbacks and controls, which is accessible from the LSC dropdown menu on the sitemap.
The chassis is labeled "Corner 6", and has 2 unconnected connectors labeled "EOM Driver A" and EOM Driver B".
The "A" connector controls the 45 MHz channels, and the "B" connector controls the 9 MHz channels.
The controls and readbacks performed the same for both channels, so I'll only write out the list once.
Voltage input with voltage calibrator | RF Set Mon readback value |
0.1 V | -13 |
1 V | 7 |
3 V | 16.6 |
5 V | 21.0 |
7 V | 24.0 |
I need to investigate the situation with the "Excitation Enable" switch, but other than that we should be ready to go when the EOM driver arrives, if we decide to install it.
The RF setpoint goes from 4dBm (lowest setting) to 27dBm (highest setting) in steps of 0.2dB. The binary should start at zero for the lowest setting and increase by 1 for each step. This is a PLC problem.
Per ECR E1500322, I've added the Wiener filter sensor correction path to the BSC and HAM ISI master models. Pretty simple change (even if it took ~3 hours to do), as there were already terminated STS paths on both models that just needed connection to a bus and a few filter blocks needed to be added to the Senscor paths. I've commit the changes to the SVN and checked to that HAM2 and ITMX would "make" on the new models. We should be able to install and use on all chambers tomorrow, the MEDMs should be pretty easy, too.
Here is the new and edited medms for this filter path addition.
Modified these medms again. Arnaud reminded me that of course the inputs to the WNR filter and the FIR & IIR filters are distinct. While the input is actually the same instrument they come from different paths through the STS2CART Matrix. So they could conceivably be scaled there but more importantly, they could be off at the matrix and one wouldn't know that as I had depicted it on the medm before (above.) I did not catch a before view but you can see that above. Here you can see the HAMISI chamber overview, the STS2CART matrix and the new HAM SENSCOR OVERVIEW and BSC Senscor overview as well.
Will commit and notify LLO to update.
Since we now do not use the pcal line at 325.1 Hz, I took out the corresponding notch (alog 19839) from LSC-DARM while I left a notch for the one at 331.9 Hz in FM7.