patrick.thomas@LIGO.ORG - posted 22:04, Saturday 28 November 2015 - last comment - 22:36, Saturday 28 November 2015(23788)
Low frequency noise
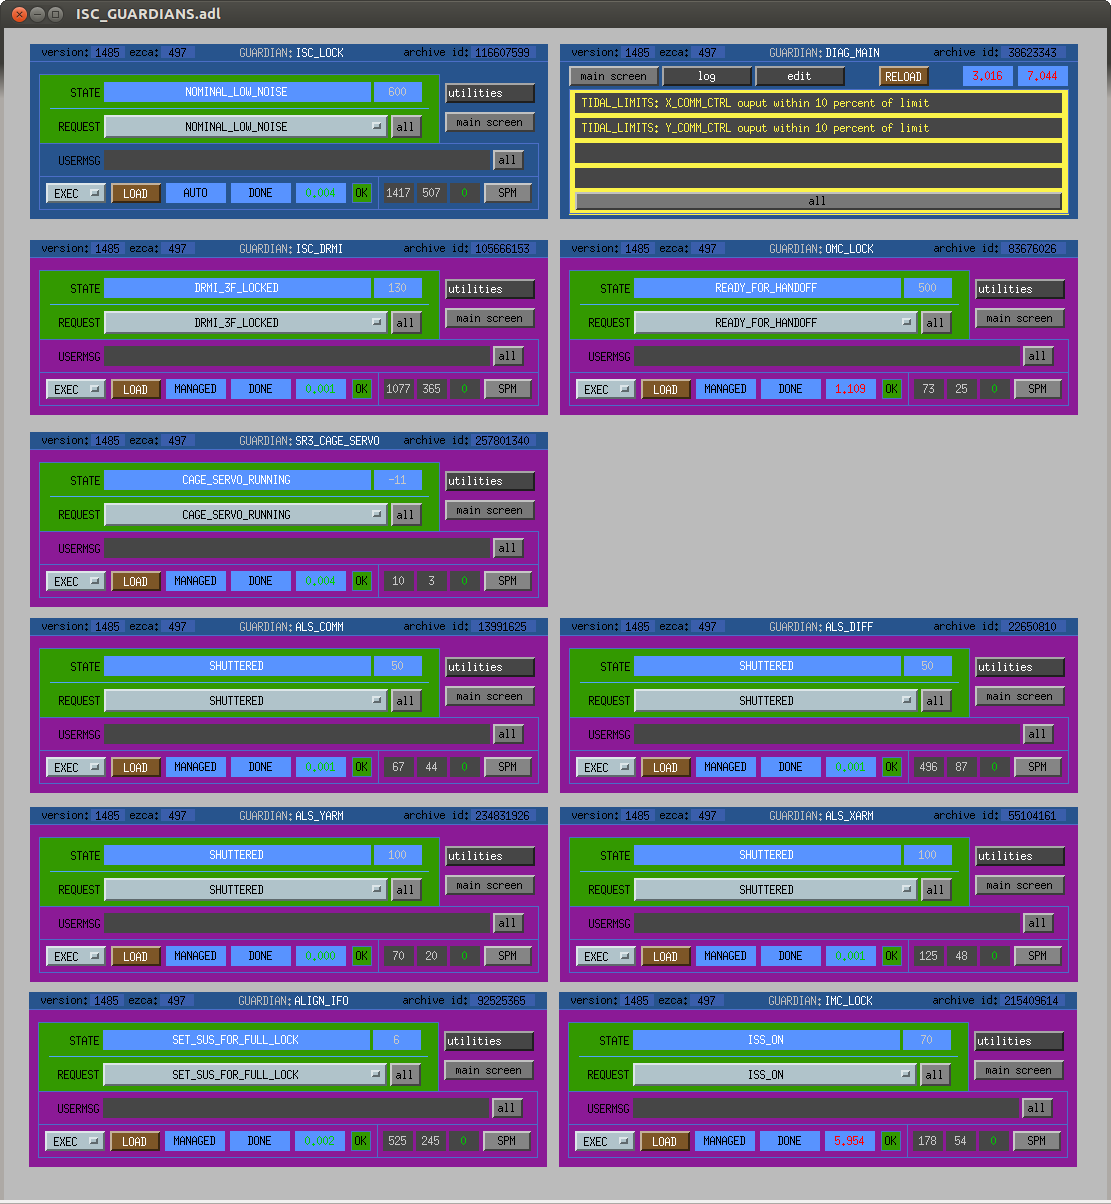
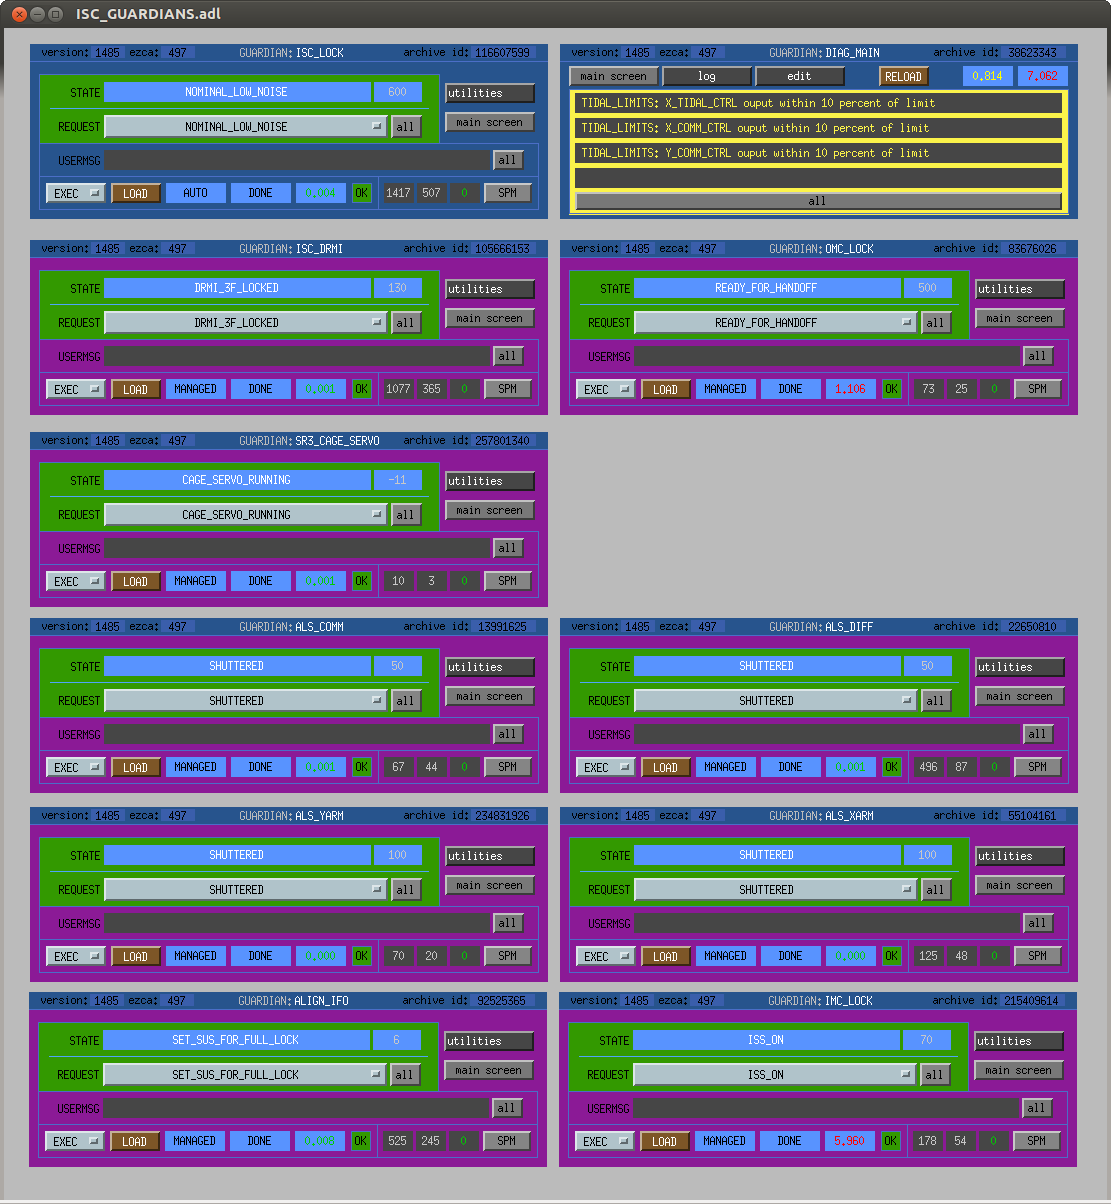
I just noticed that the DARM spectrum is rising significantly on and off up to around 100 Hz. There are diagnostic messages related to TIDAL LIMITS (see attached screenshots). Starting investigation.
Images attached to this report
Comments related to this report
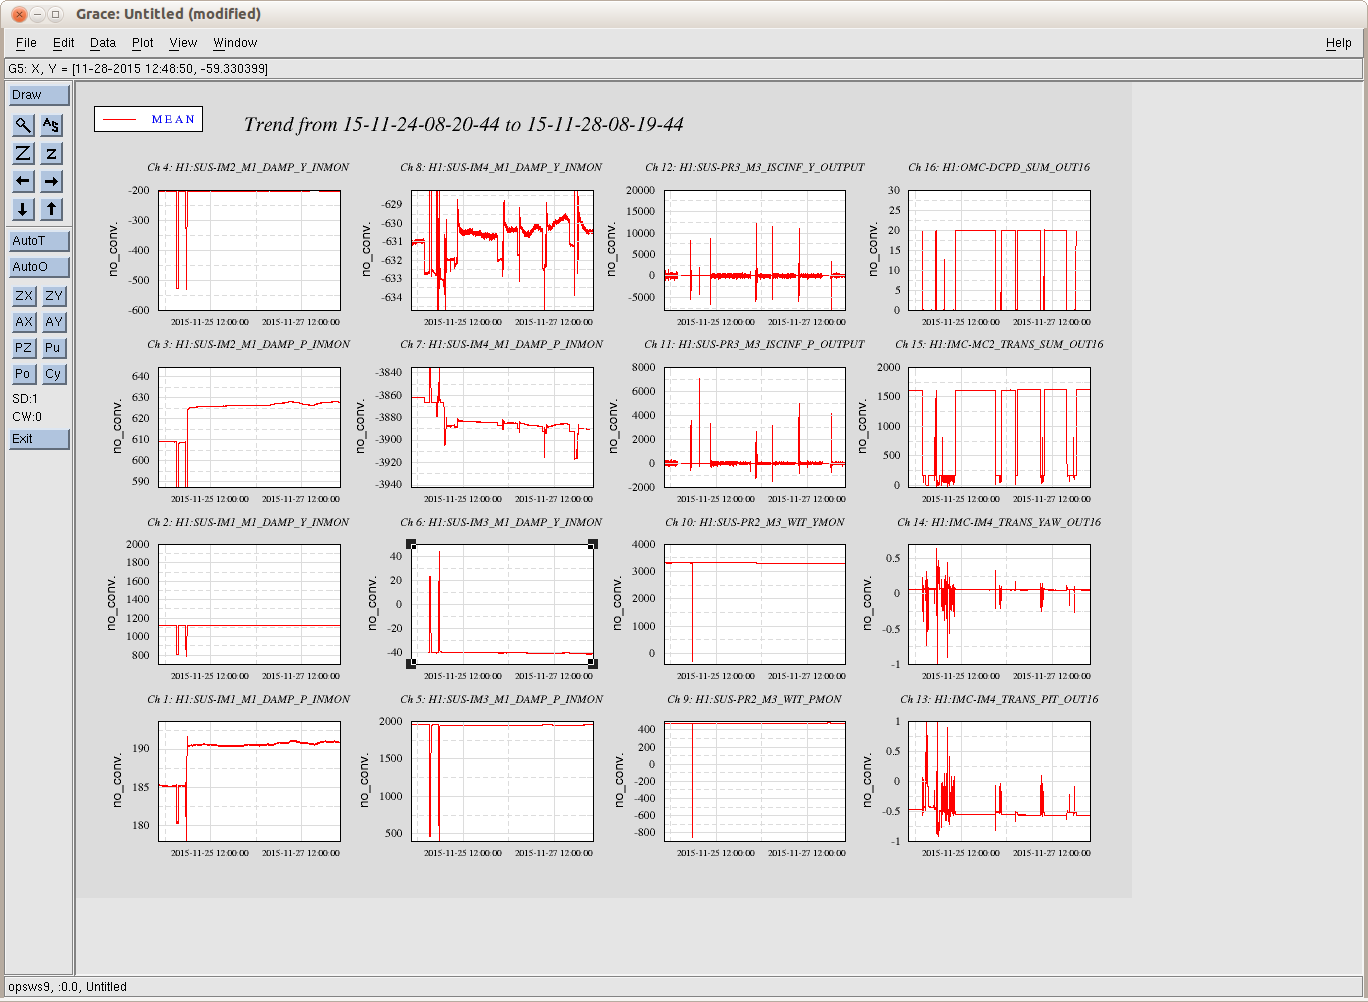
Plots of signals I believe are being referred to in these diagnostic messages for last 3 hours.
Non-image files attached to this comment