J. Kissel

In efforts to finally nail down the mysterious "zero" around 50 [Hz] in the UIM (see LHO aLOG 24296), I've measured the TOP, UIM, and PUM driver using three different measurement configurations. The hope is that, with this "matrix" of differences, we can find out what's going on with the UIM to see if its something specific to the driver, or specific to the OSEM chain upstream of the driver. From what I've seen watching the measurements go by on the SR785, both the TOP and PUM stage show similar zero-like behavior as the UIM, though the TOP mass has a pole-like behavior above the zero and eventually rolls off. Both the PUM and the UIM look as though they are rolling up to "infinity" by 10 [kHz], without even a phase shift indicating their might be a pole "soon" in frequency.  More detailed analysis and plots to come.

The data has been committed to the repo here:
/ligo/svncommon/CalSVN/aligocalibration/trunk/Runs/PostO1/H1/Measurements/Electronics/
EYPUMDriver/2016-01-05/TFSR785*.txt
EYTOPDriver/2016-01-05/TFSR785*.txt
EYUIMDriver/2016-01-05/TFSR785*.txt
where the key to each driver's measurement set is in the log files,
/ligo/svncommon/CalSVN/aligocalibration/trunk/Runs/PostO1/H1/Measurements/Electronics/
EYPUMDriver/2016-01-05/2016-01-05_EYTOP_Measurement_log.txt
EYTOPDriver/2016-01-05/2016-01-05_EYUIM_Measurement_log.txt
EYUIMDriver/2016-01-05/2016-01-05_EYPUM_Measurement_log.txt

I also attach a white board sketch that indicates each of the measurement configurations.
   (0) [Not shown] The "reference" measurement is identical to the reference setup shown in page 2 of the 2nd attachment in 18518, which is divided out of every transfer function to get rid of the response of the differential driver.
   (1) This is measuring the response of the coil driver as it is typically measured on the bench by CDS. It uses a differential to single-ended receiver and the 40 [ohm] internal load (as I only found out later, the documentation on this box, D1000931 leaves something to be desired), so the response differs from configuration (2) only by a scale factor of 2.
   (2) This is measuring the response of the coil driver as is typically done in the field when the OSEM and/or satellite amplifier is not available. The box (D1100278) is, as far as the coil chain is concerned, only a two 20 [ohm] (for a total of 40 [Ohm]) resistor load.
   (3) This is the "real life" scenario, where we measure the response of the driver with the full SatAmp and OSEM included as a load on the output of the driver. It is in this configuration is where the magic happens, apparently.
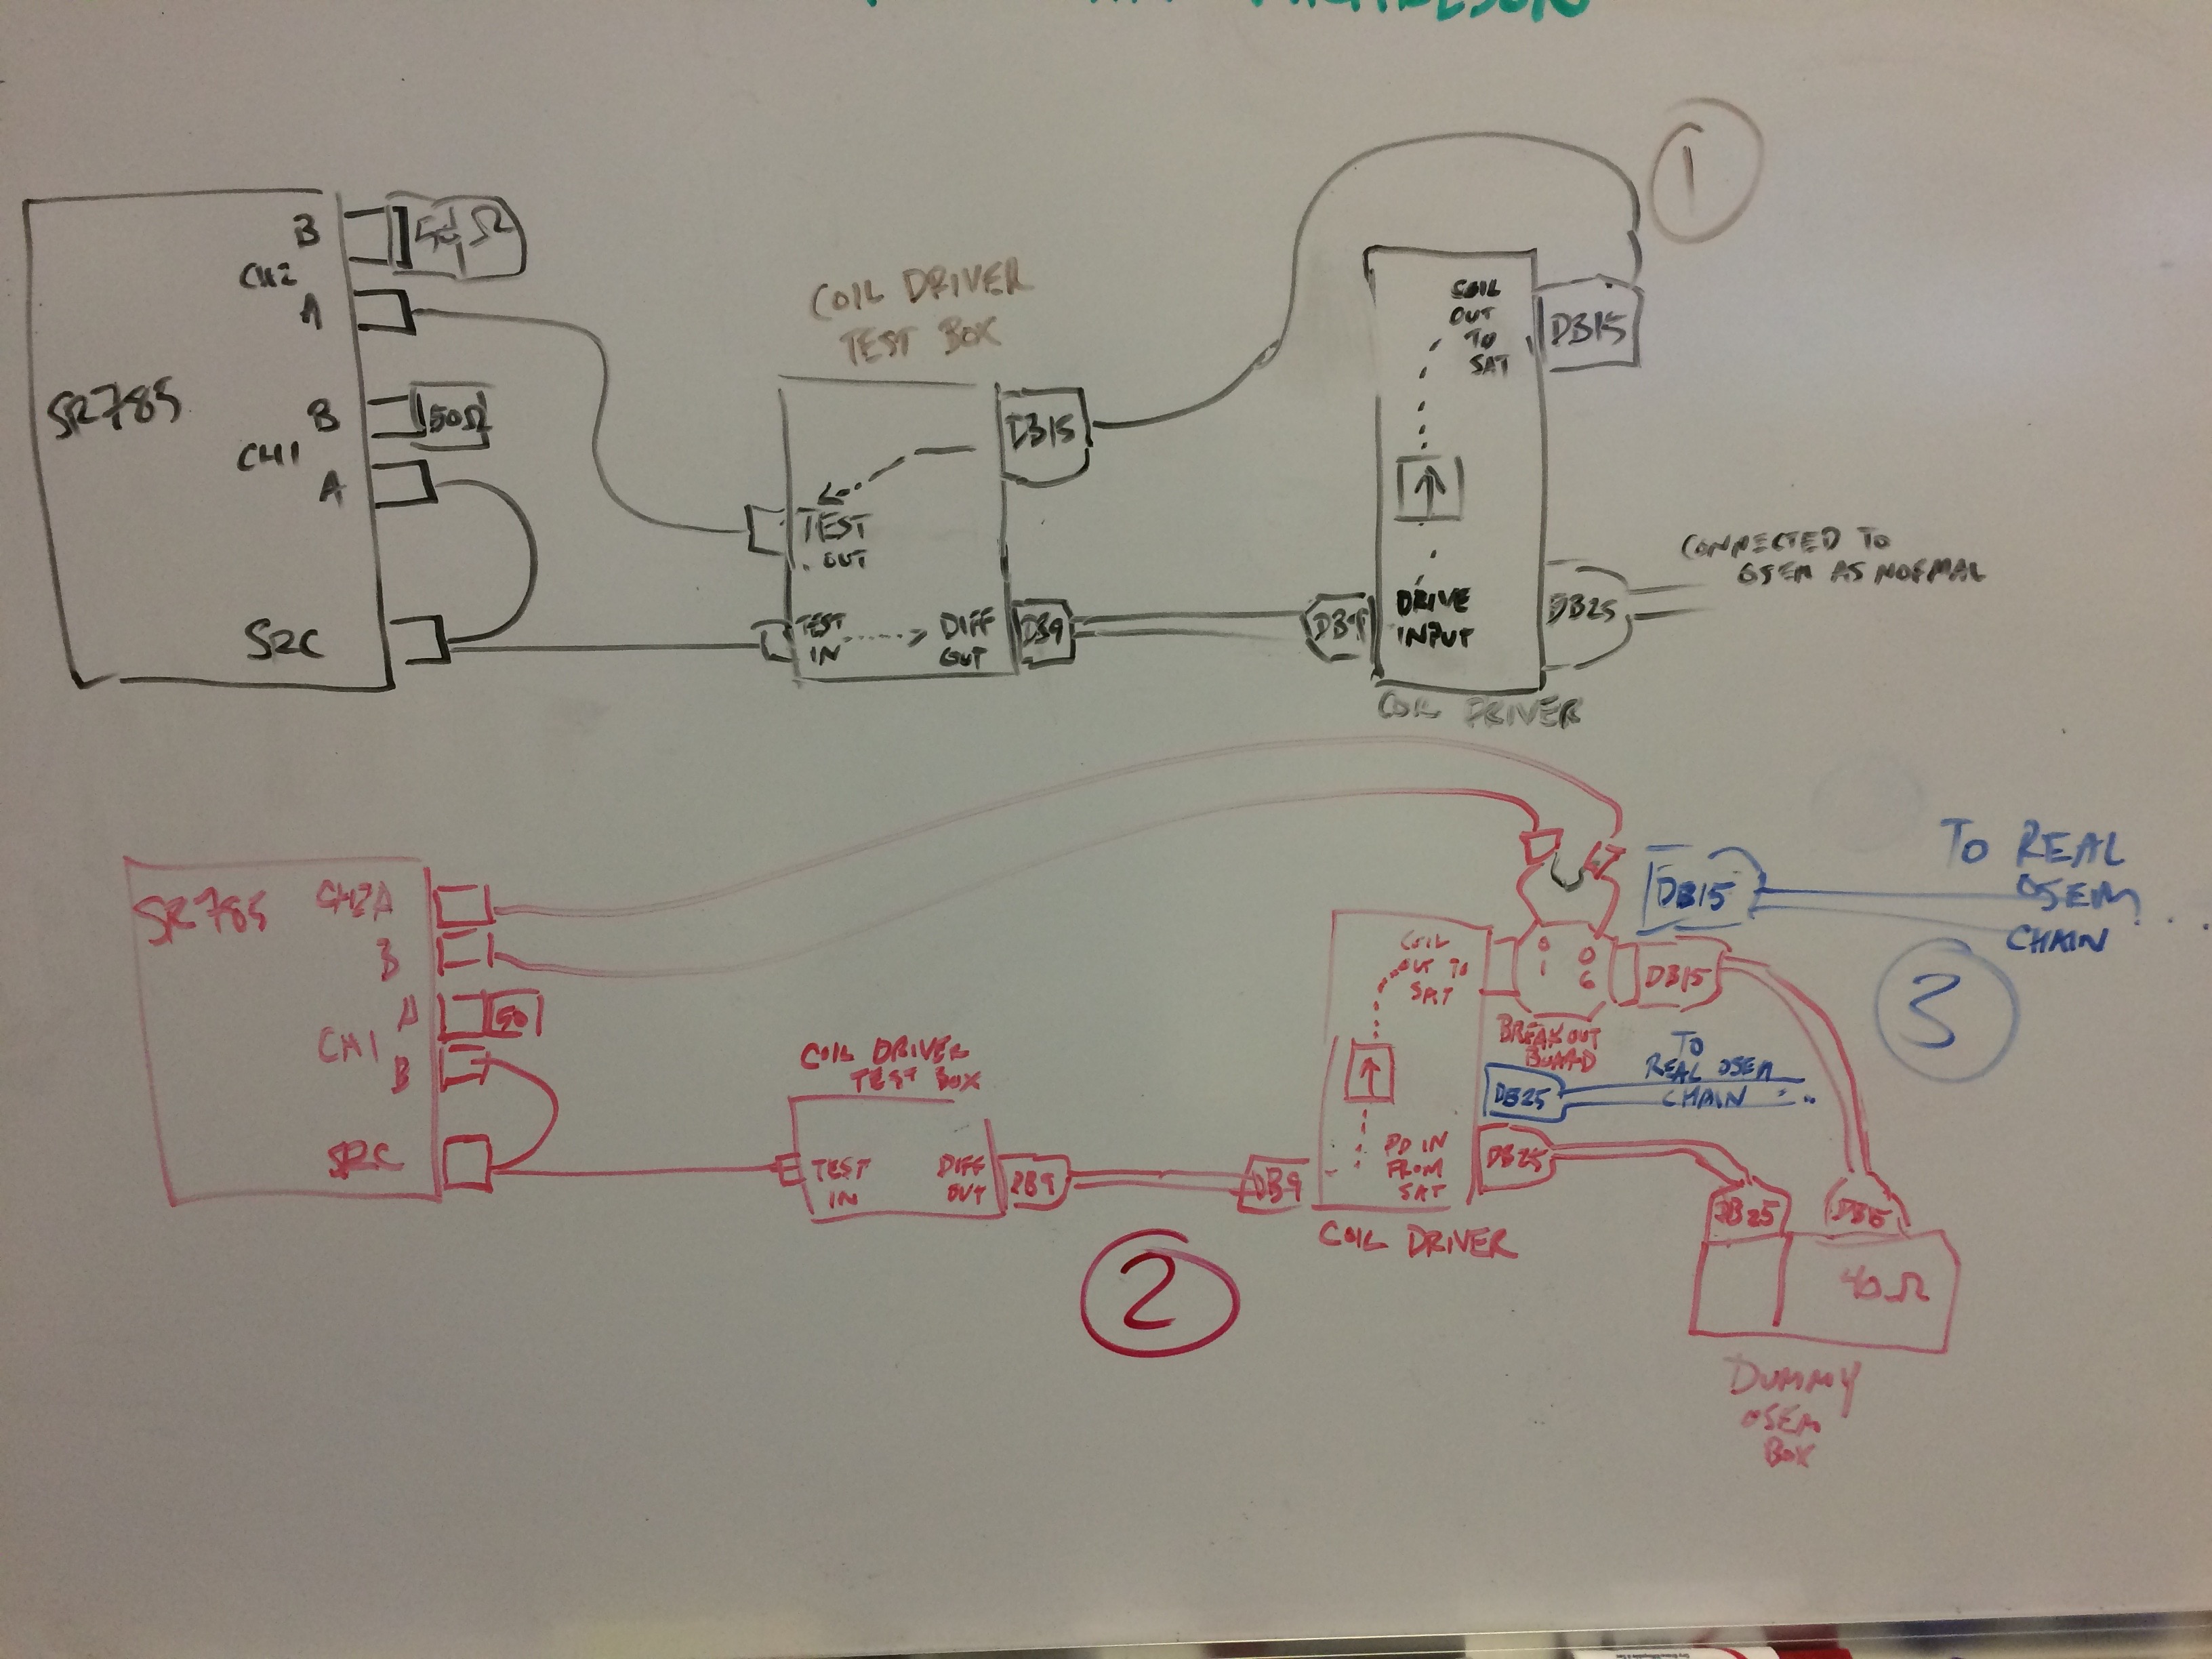
Since the IFO has decided to give up on Calibration Week, I've put together some .graffle diagrams of what I show in the whiteboard picture above such that a future user and/or LLO can more clearly replicate my results, if need be (or they don't trust what Evan G's is about to post).

Also note for future me, the source code for these diagrams lives in
/ligo/svncommon/CalSVN/aligocalibration/trunk/Runs/PostO1/H1/Measurements/Electronics/EYTOPDriver/2016-01-05/
CoilDriverChassisSetup_BenchTestSetup.graffle
CoilDriverChassisSetup_DummyOsemChain.graffle
CoilDriverChassisSetup_RealOsemChain.graffle

Summary:
I plotted the results of Jeff's measurements for the H1 End Y driver electronics for the top, UIM, and PUM masses. All show odd behavior at high frequencies that we cannot model as an ideal inductor.
- The top mass BOSEMs have an odd behavior, approximately f^(1/4) dependence, but can't be fit to a simple pole-zero pair, nor more complicated 2 pole/1 zero, or 2-complex-pole/1 zero models.
- The UIM BOSEMs show an f^(3/4) dependence and also have 180-degree phase flip with respect to the top mass BOSEMs.
- The PUM AOSEMs in state 1 and 3 show an odd high frequency behavior something like f^(3/4) dependence, especially with the phase turn-over at 60 degrees and we cannot fit a 2-complex-pole/1 zero to this.
- AOSEMs in state 2 and 4 have the complicated aquire electronics that change the Bode plots but we ignore these issues as they are expected
Details:
For each measurement of a given mass' driver electronics (TOP, UIM, or PUM), I divided the measured BOSEM (for TOP/UIM) or AOSEM (for PUM) transfer functions (normalized) by the corresponding transfer function for when there is a dummy 40 ohm resistor terminating the output of the drive electronics (also normalized). In addition to plotting the results of the measurements, I also investigated the high frequency behavior. Nominally, we expect to observe the inductance of the BOSEMs or AOSEMs as a simple zero--the high frequency dependence goes as f. Instead, we observe different dependences for the BOSEMs of the top and UIM masses and the AOSEMs of the UIM (state 1 and 3). We attempted to fit by hand some zero-pole models to these Bode plots but were unsuccessful to replicate the high frequency dependence.
- For the top mass, it appears like there is a pole-zero pair, but we are unable to replicate the transfer function behavior with simple pole-zero or more complicated 2 pole/1 zero and 2-complex-pole/1 zero. In the 1 kHz region, the frequency dependence is approx. f^(1/4). For all top mass BOSEMs, in both states, we observe the same issue.
- For the UIM, It definitely appears that the BOSEM frequency dependence is f^(3/4) from the measurements above 1 kHz for all UIM BOSEMs and all states.
- The PUM AOSEMs in states 1 and 3 show an interesting ~f^(3/4) dependence and phase turn over at 60 degrees. We were unable to fit this to zero-pole pair.
- State 2 and 4 in the PUM AOSEMs show the complicated acquire electronics that we do not attept to model here.