corey.gray@LIGO.ORG - posted 15:57, Thursday 31 December 2015 (24586)
DAY Ops Summary
TITLE: 12/31 DAY Shift: 16:00-00:00UTC (08:00-04:00PDT), all times posted in UTC
STATE of H1: Locked for 6+hrs at or under 80Mpc.
Incoming Operator: Jeff B.
Support: Kiwamu called in for OWL & DAY
Quick Summary:
After Kiwamu fought the fight early this morning, H1 has been in Observing ever since (even with a few notable [red Terramon] rumblers). Will be curious to see how H1 fares during its next Initial Alignment (see note for possible work-around for Input Align portion of Initial Alignment from Kiwamu's alog earlier).
There was warning (albeit after-the-fact) of another EQ at 22:40 from Alaska with motion of 0.6um/s, but it had no effect here.
Shift Activities:
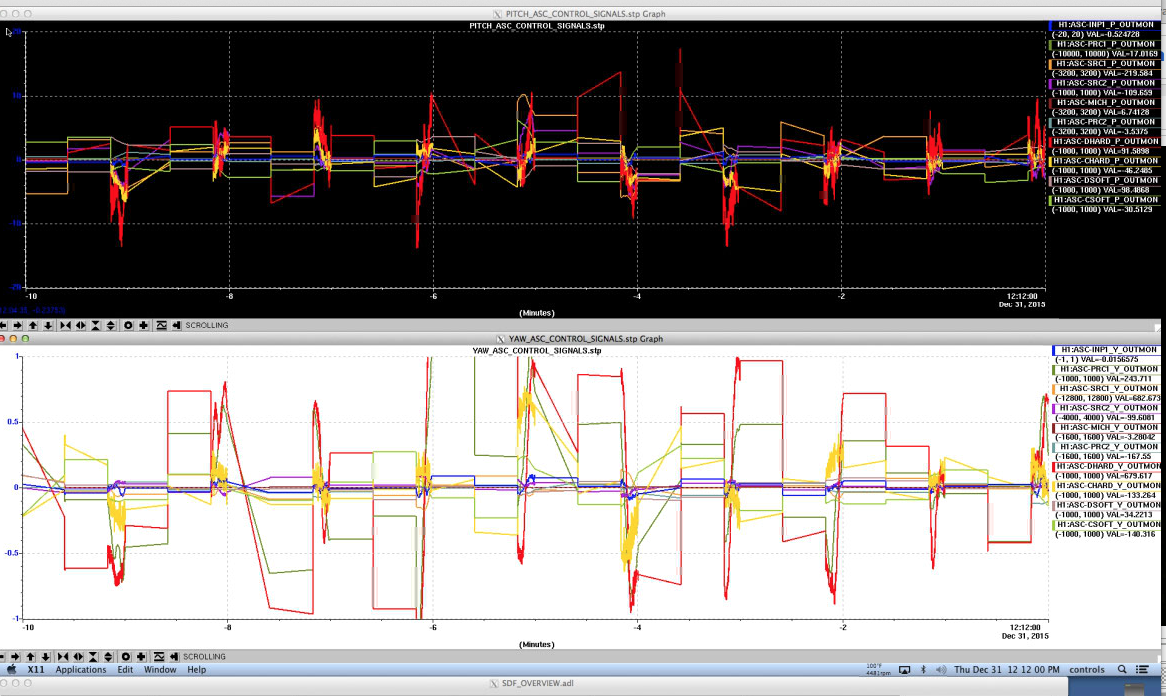


Around 22:13 Tidal, ASC (huge in yaw), and POP_A_LF all started getting big oscilations, but we appear to have ridden out the 22:18:52 R-wave arrival time. Didn't really see anything obvious in the 0.03-0.1 seismic band. Range has trended down to around 76Mpc over the last few minutes.
And all of this as the winds slowly get above 10mph.
Go H1! #knockonwood