Maintenance Summary: 17:45 Lockloss --> 20:49 Undisturbed
Not clear why we had the lockloss (LN2 truck came 30min after lockloss).
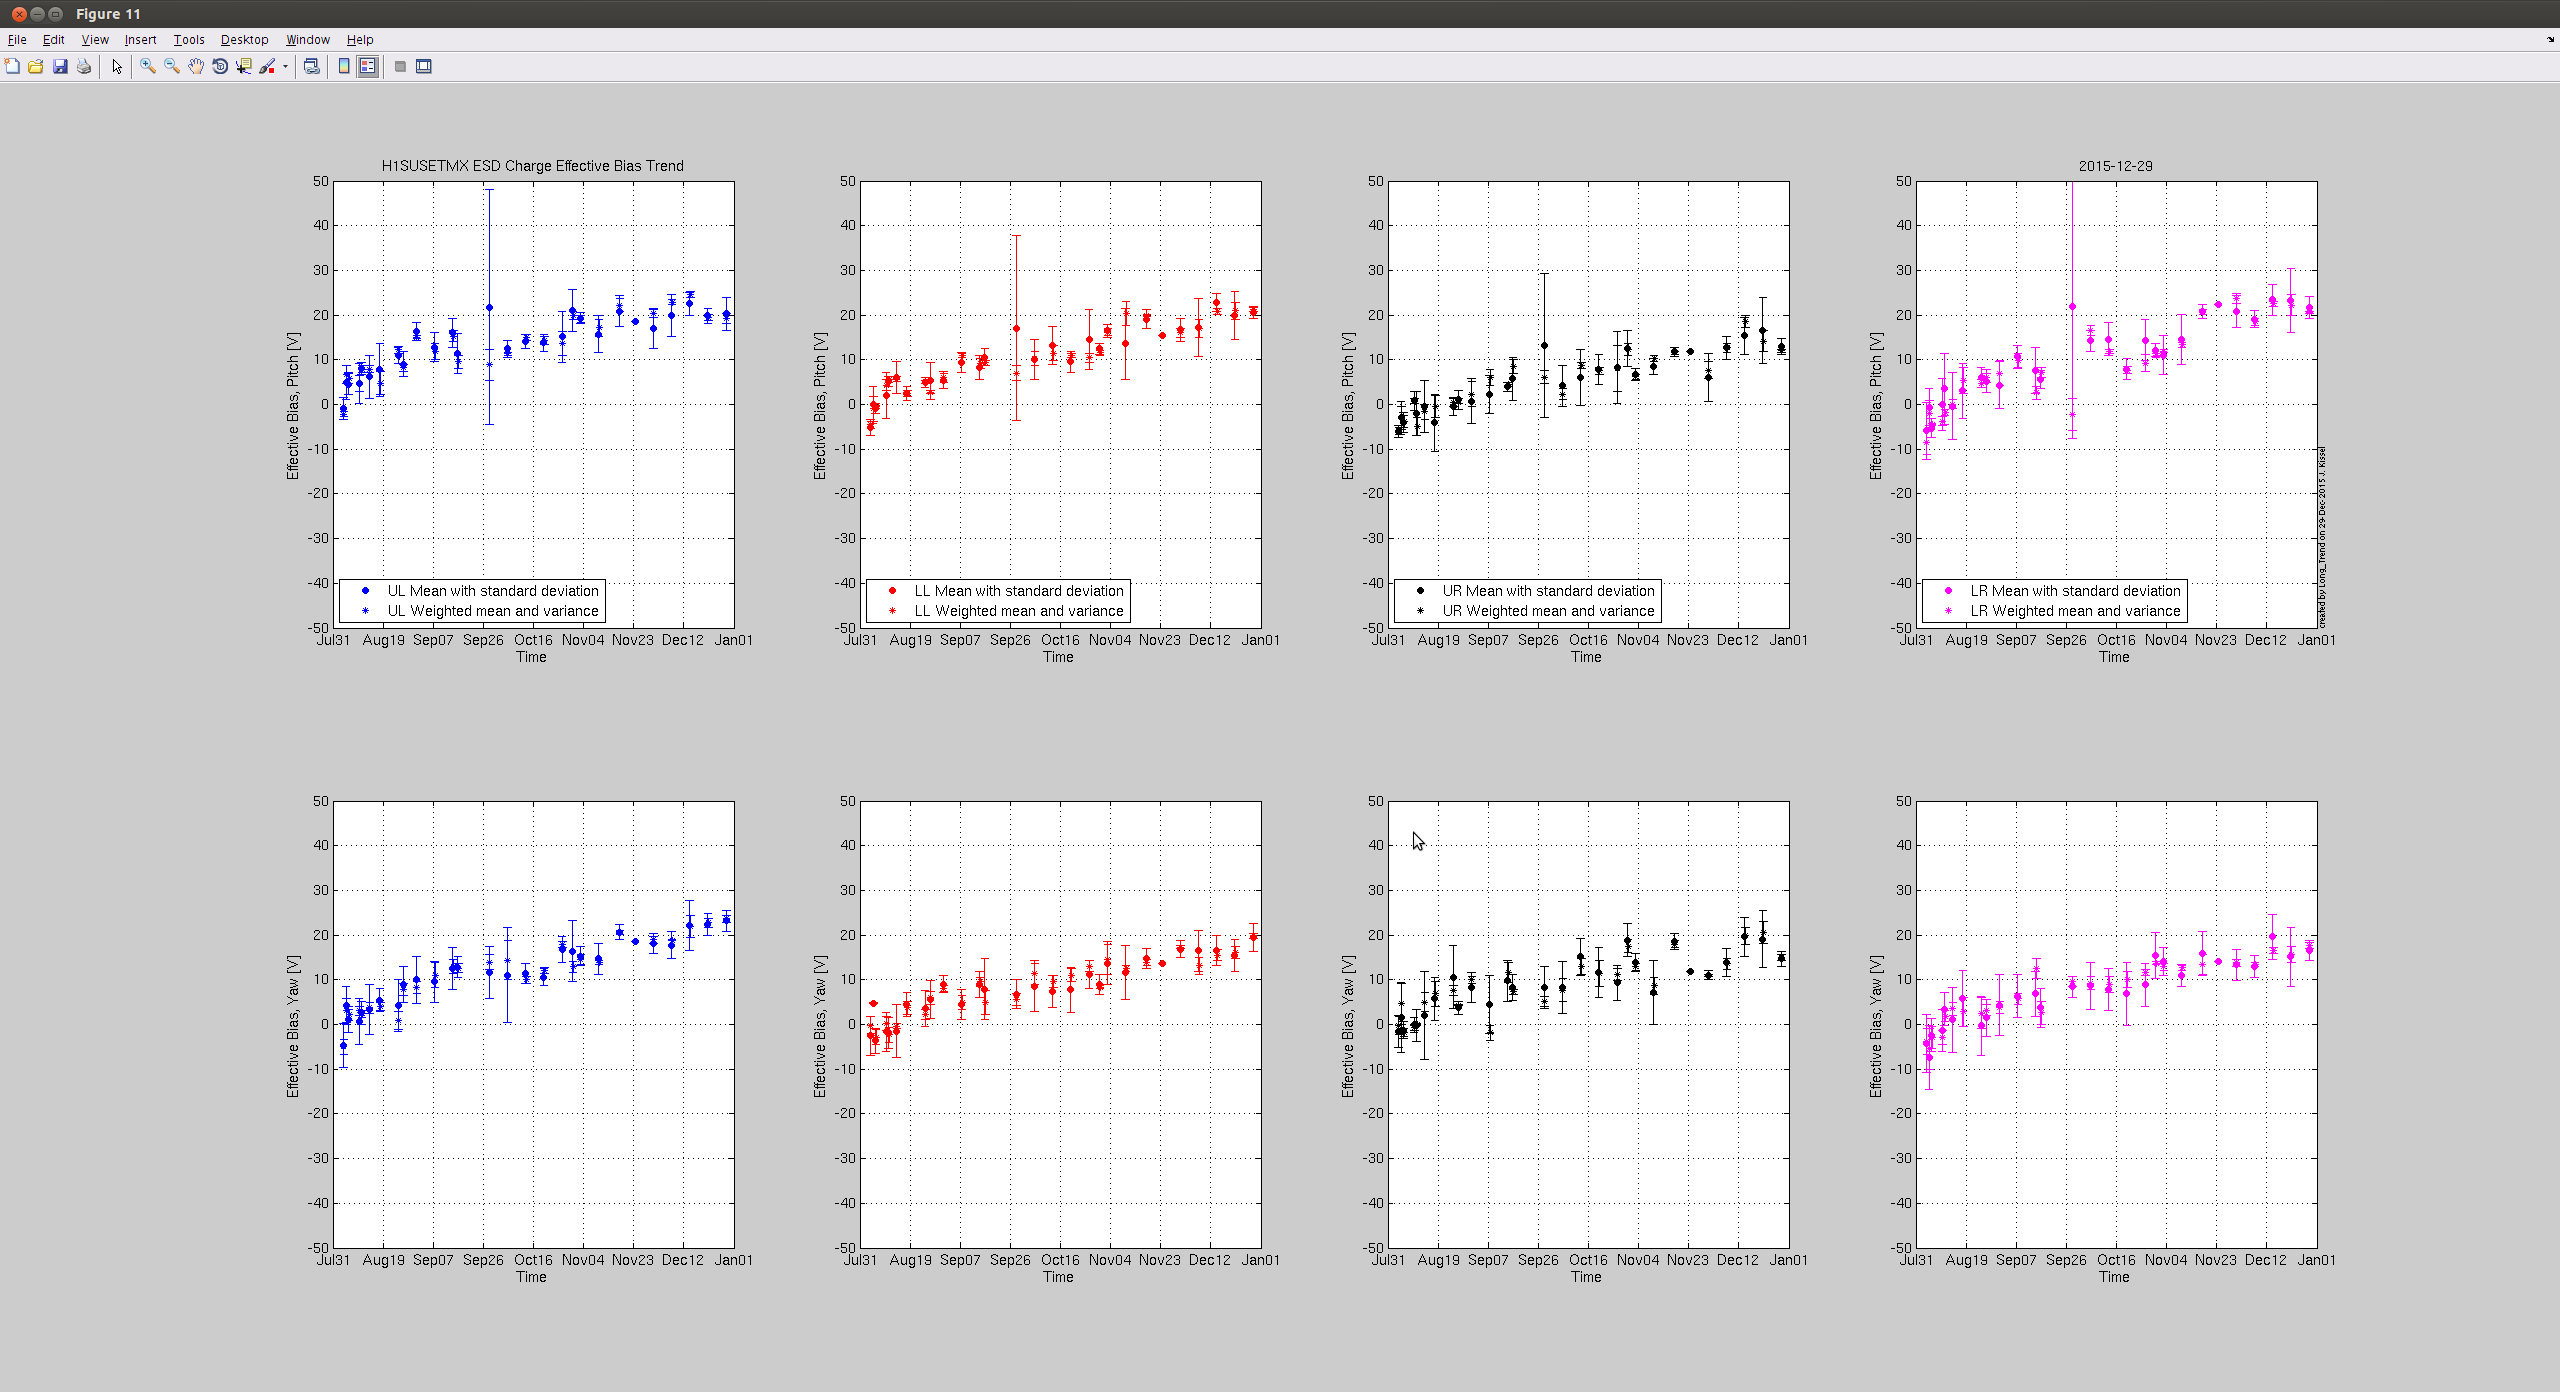
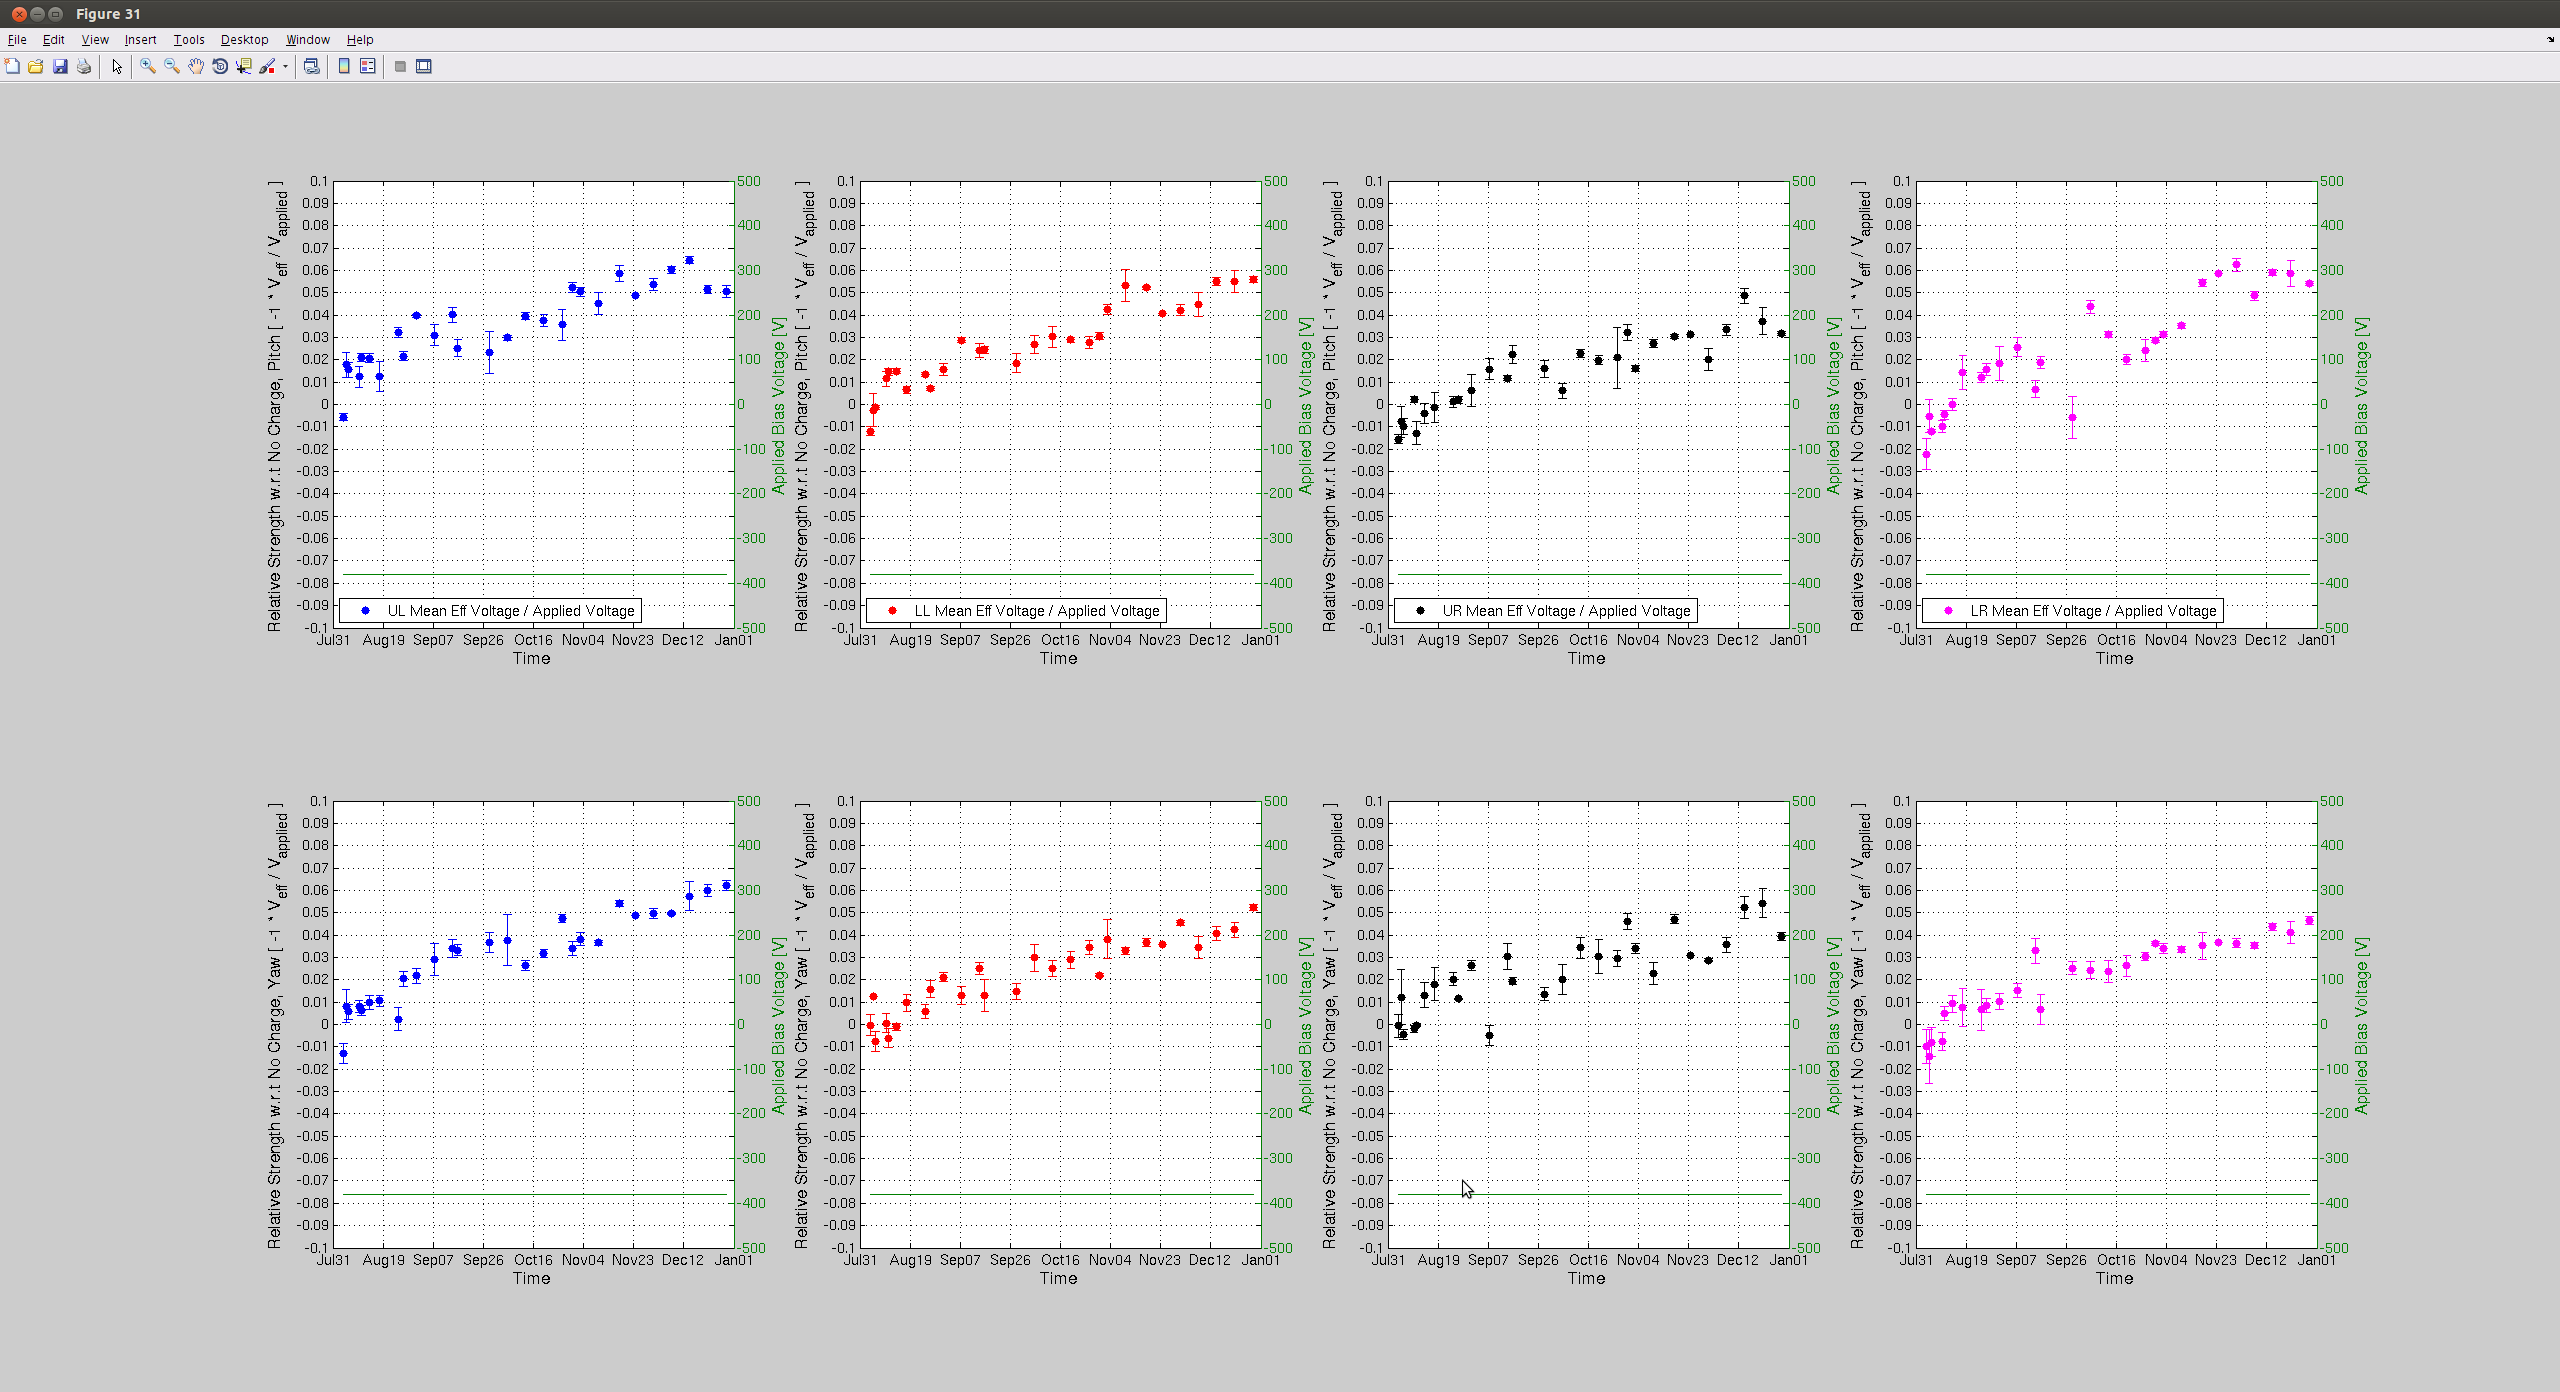
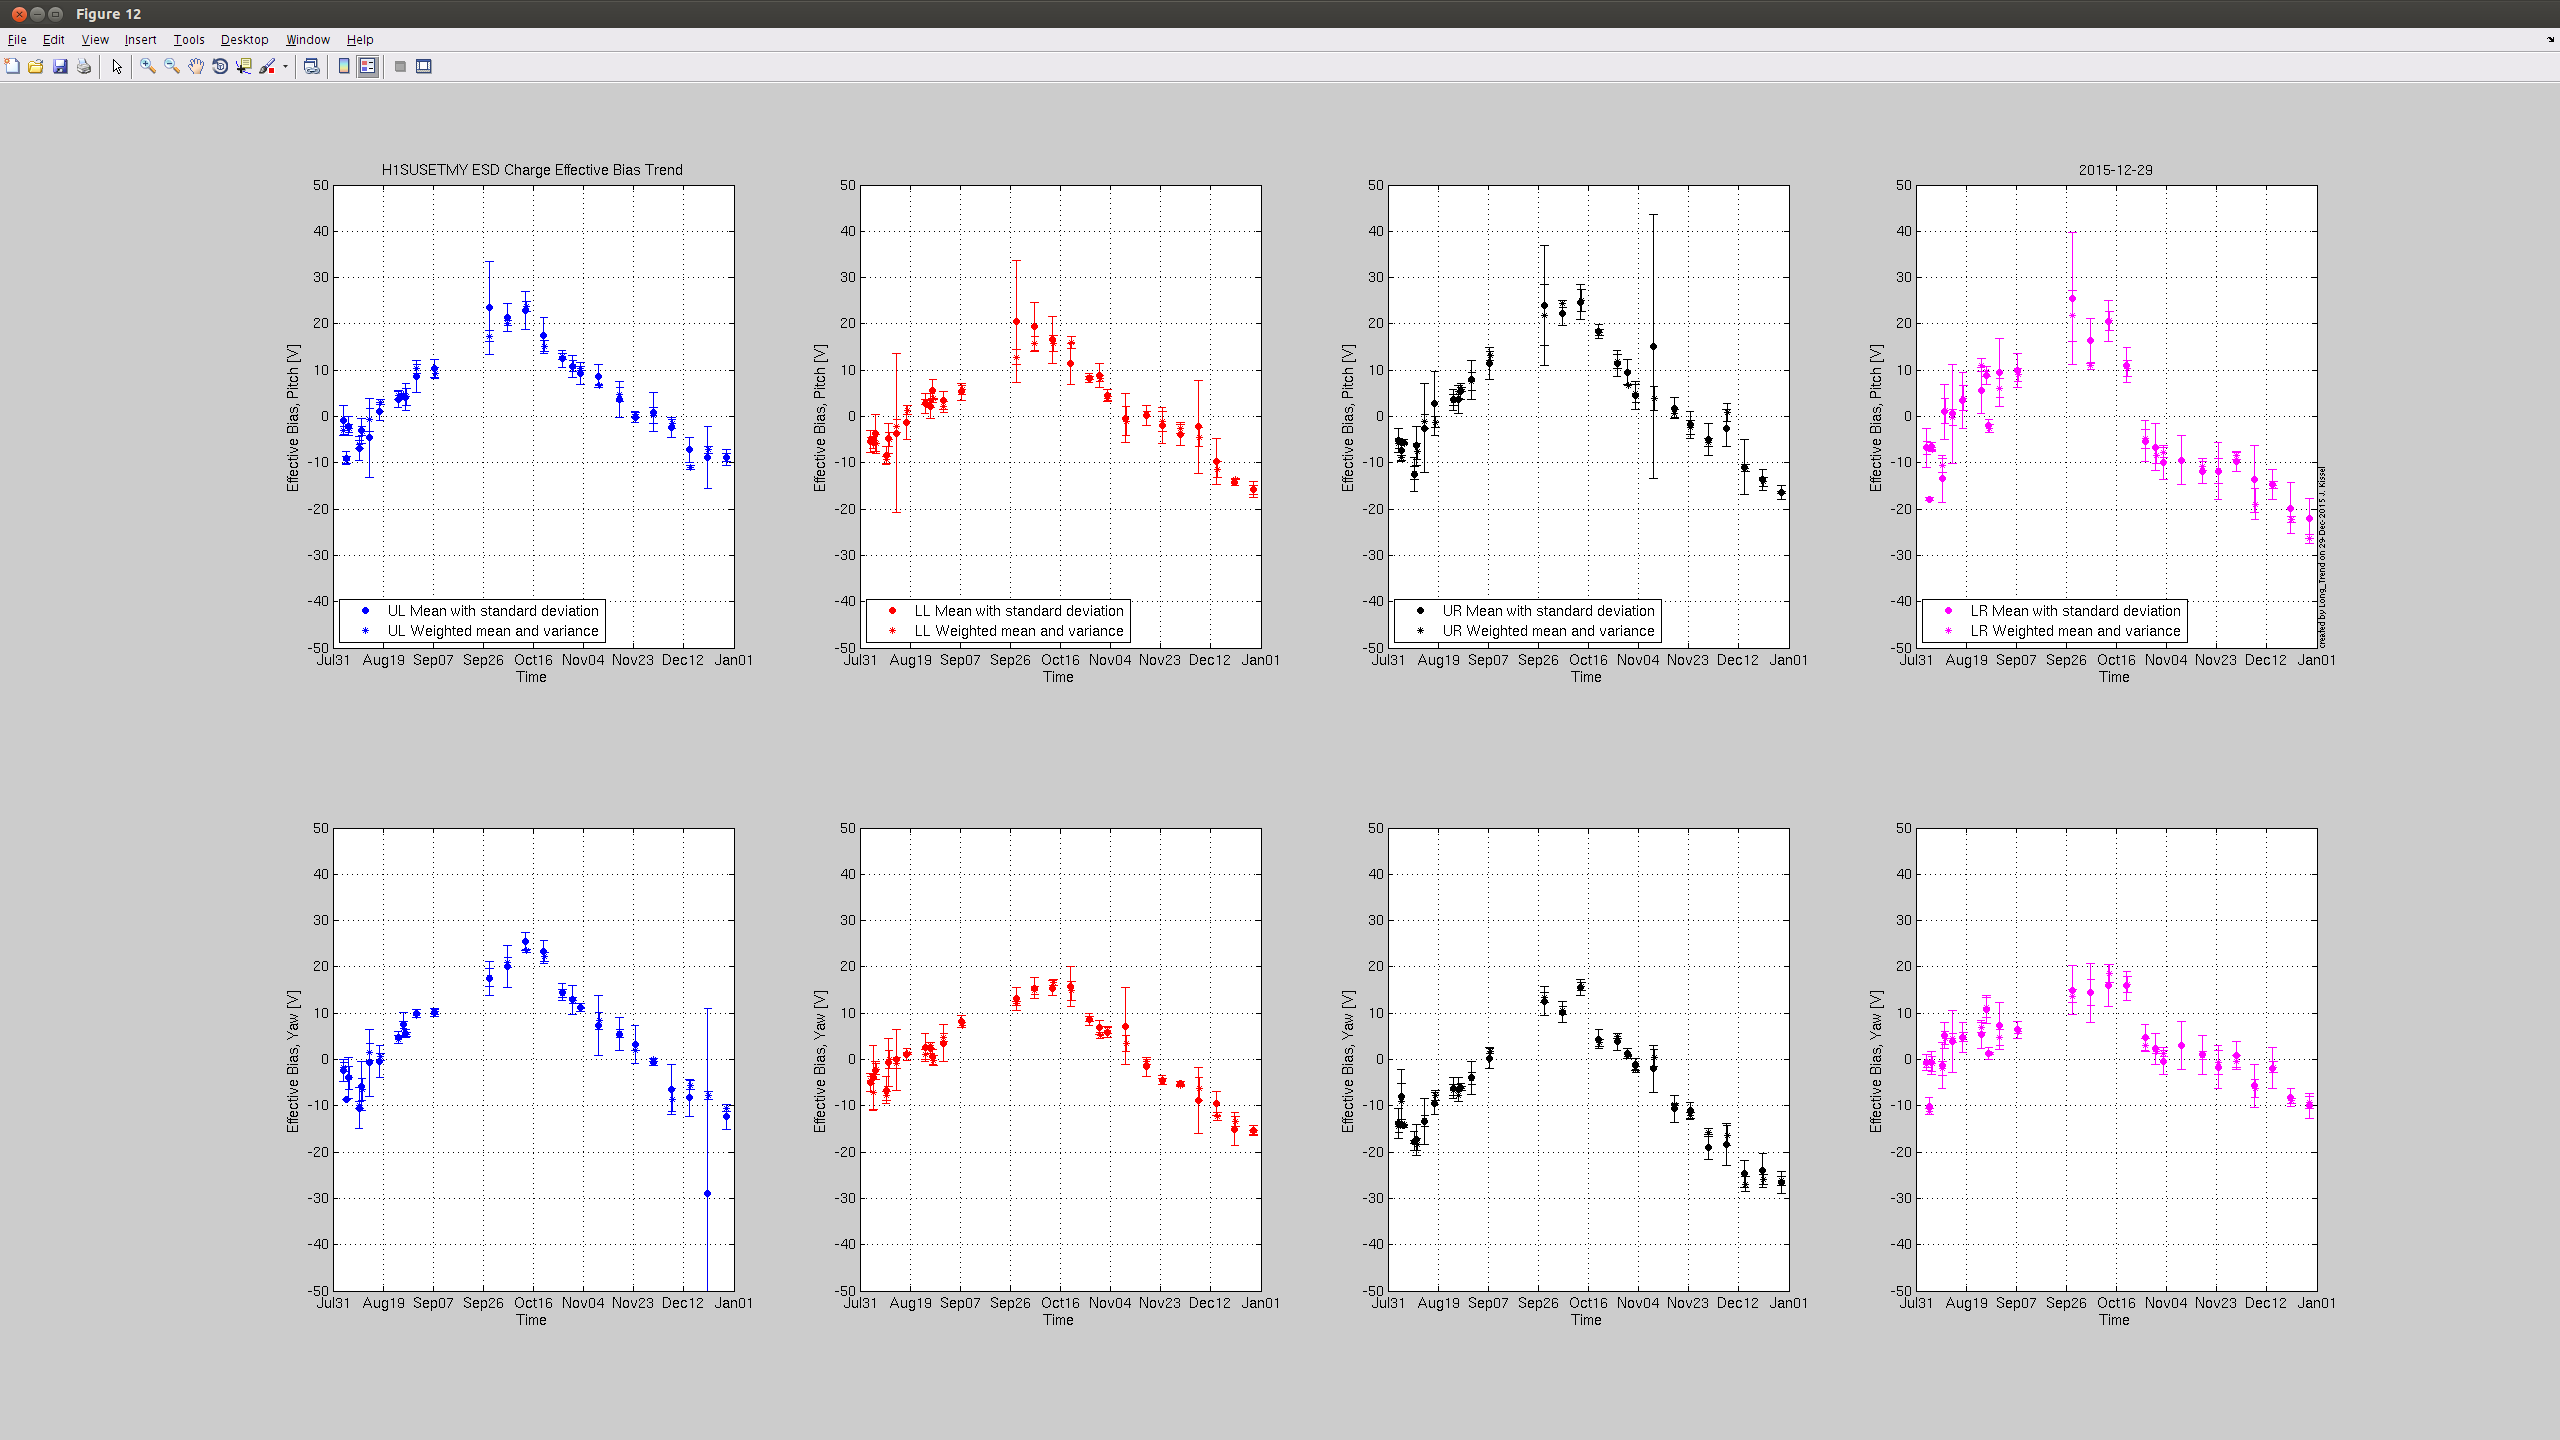
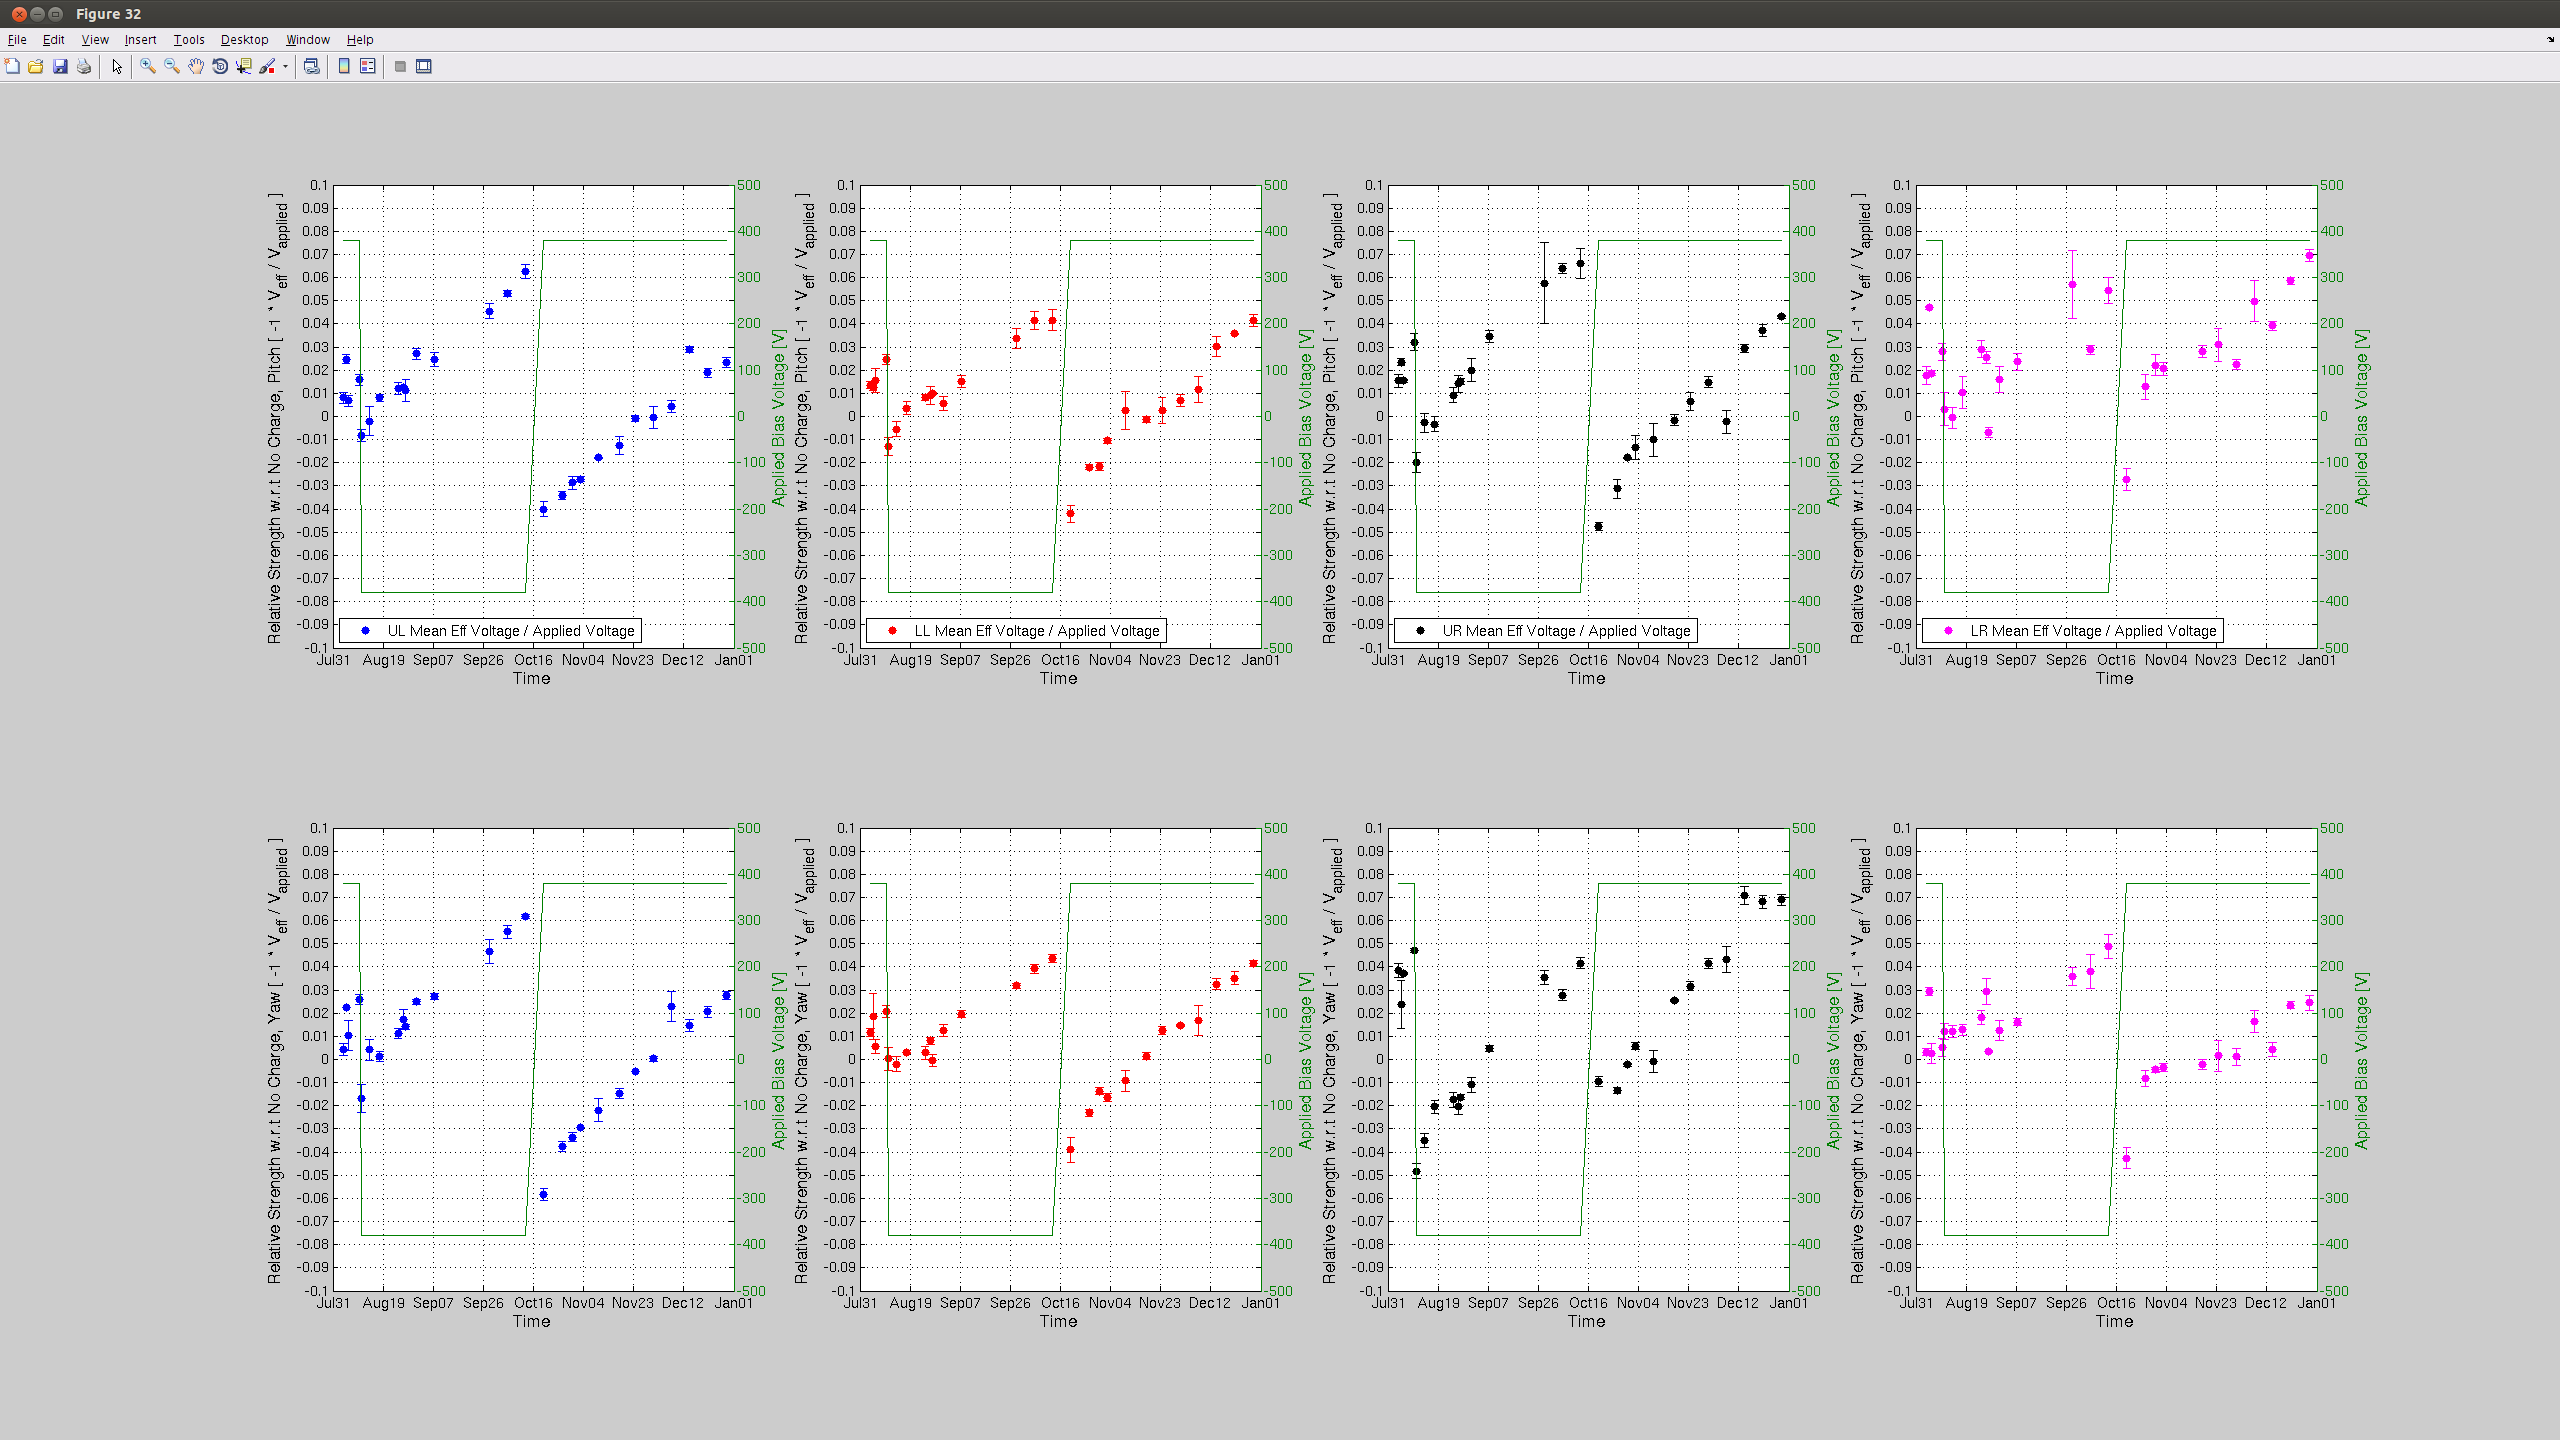
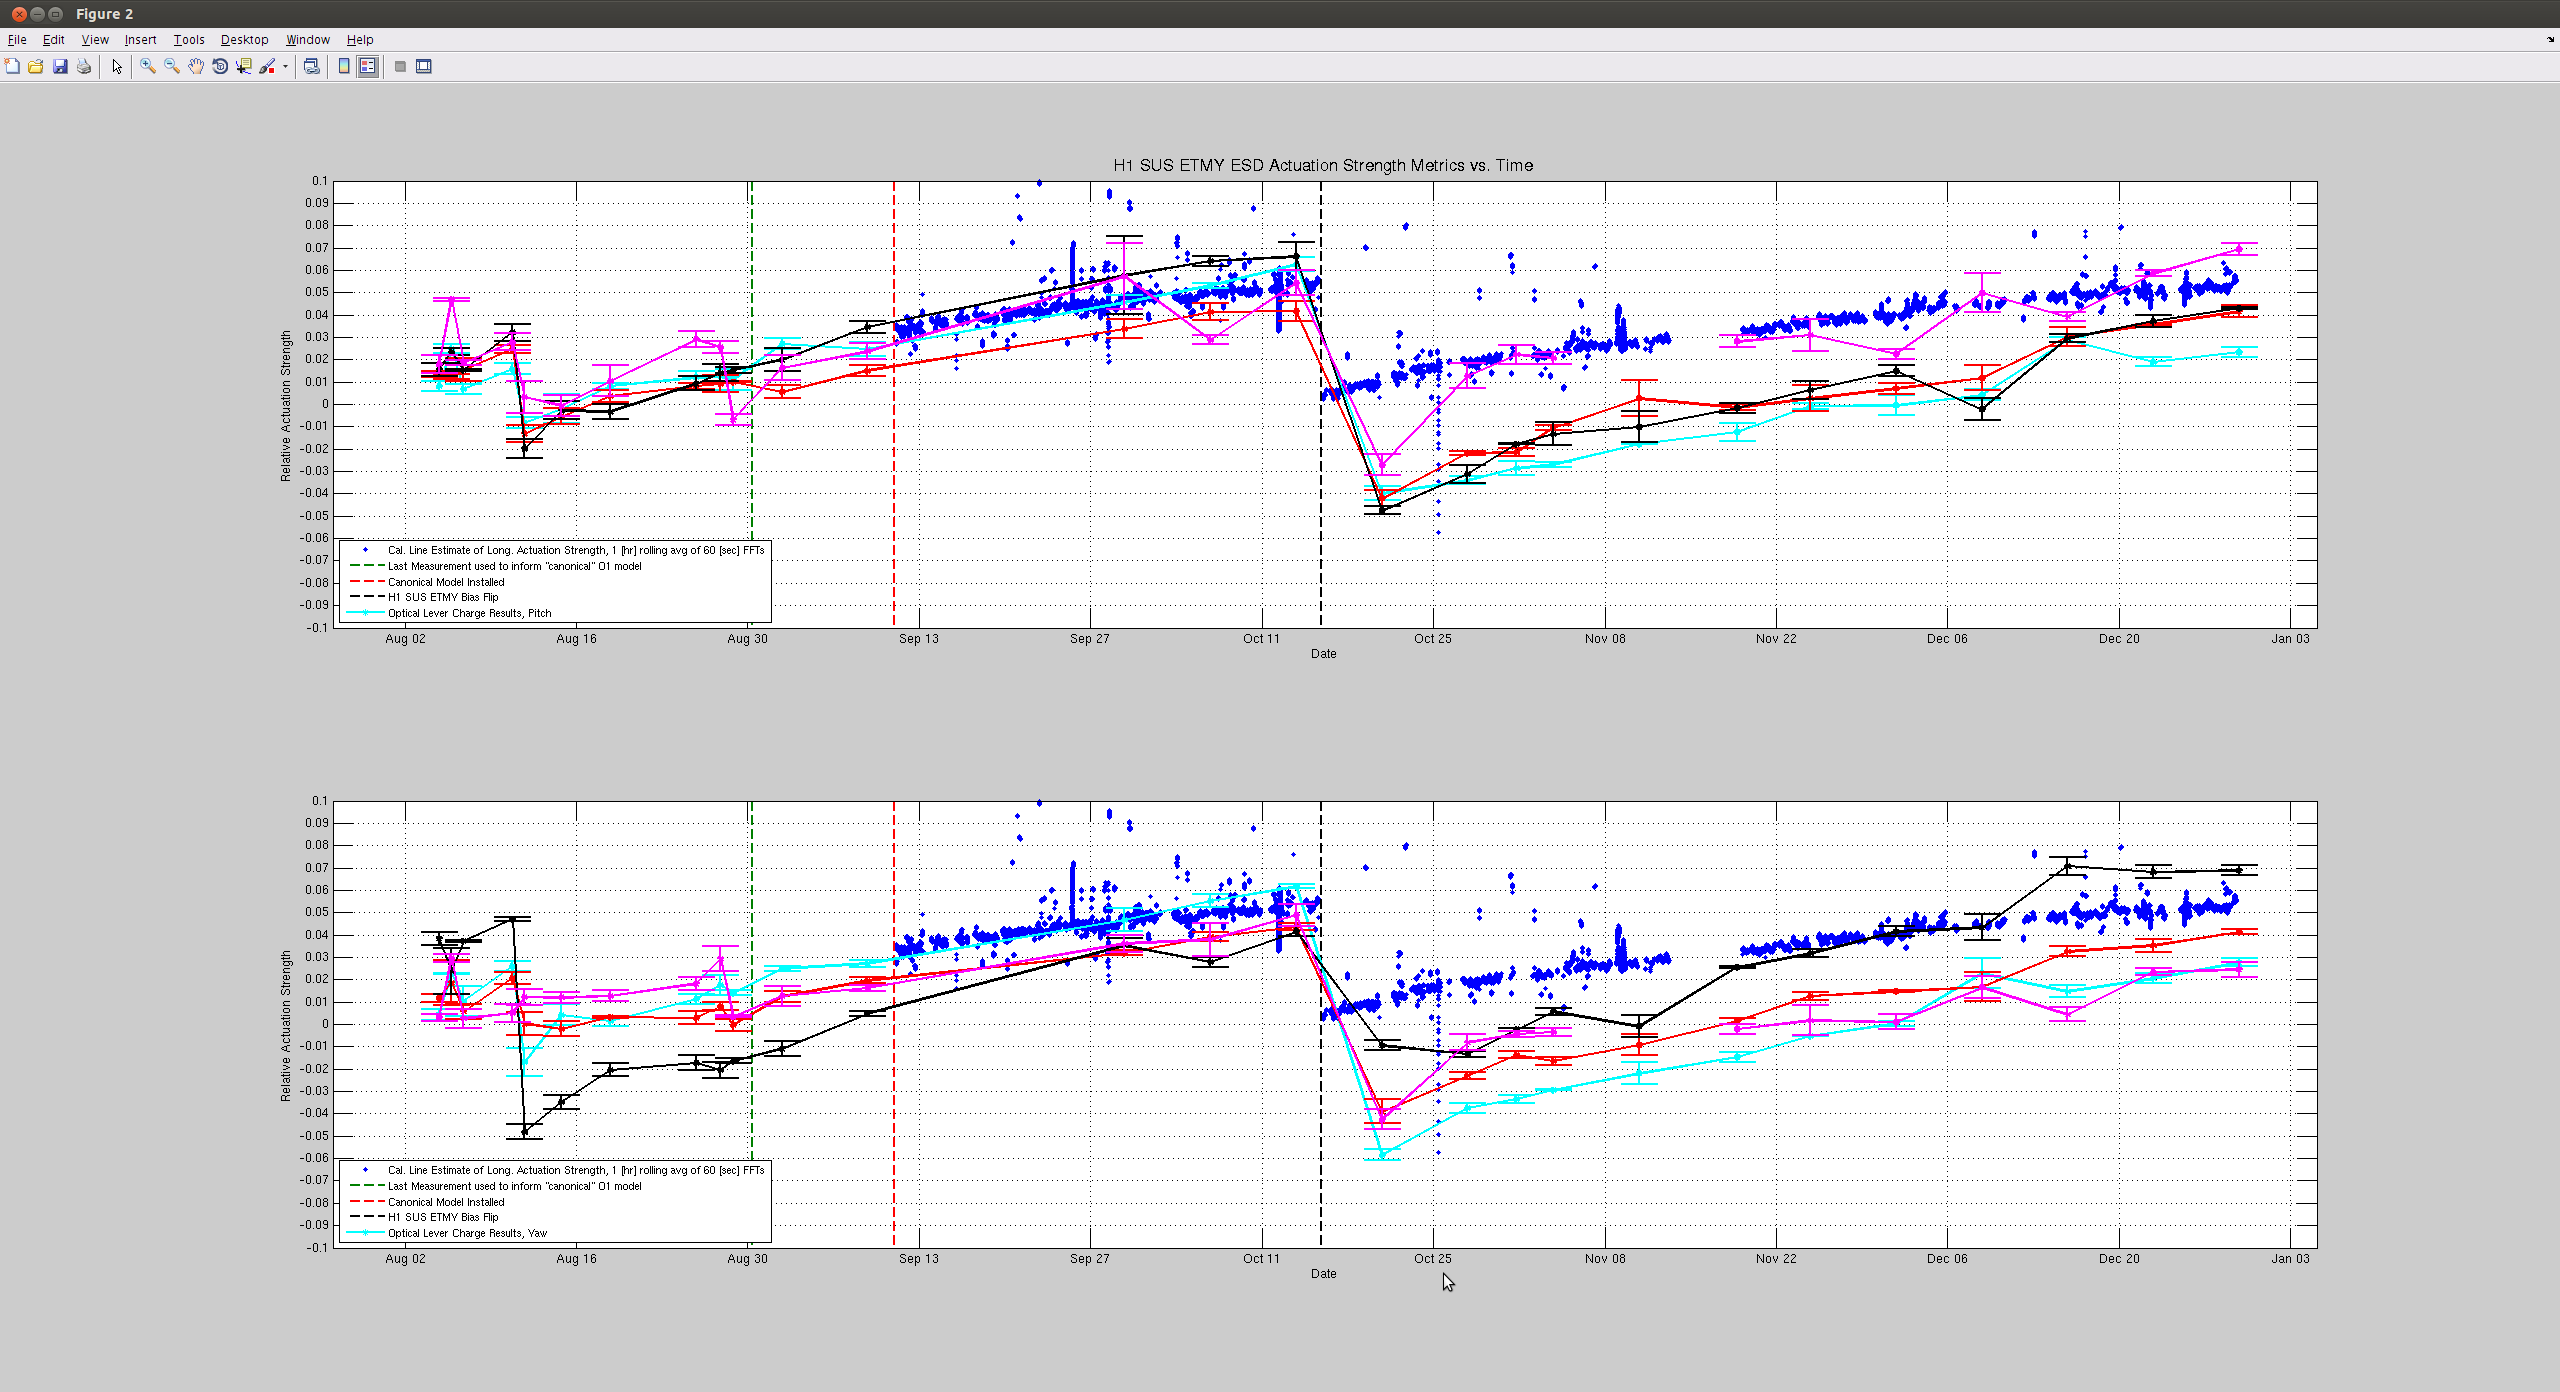
17:47 - 18:53: Charge measurement, PSL WD Reset, LN2 at MY CP3
18:53 - 19:31: Initial Alignment. Here are two notable:
-
ALS Alignment: After GREEN WFS OFFLOAD, ETMy had output of 39 in yaw, so I tweaked ETMy yaw to get it down to 4 (is that worth doing?). Also tweaked PR3 to take COMM Beatnote from 3.8 to 4.8.
-
Dark Michelson: This was straightforward, EXCEPT for not being able to lock a Dark Michelson. After tweaking BS & also SR2 (while looking at AS_C QPD) to no avail, restored those optics and moved on.
19:32 - 20:34: Lock Acquisition. Notes below:
Since I didn't get to align BS in MICH_DARK_LOCK, I selected LOCK_PRMI in ISC_LOCK guardian, but this apparently doesn't work. Sheila mentioned I should have selected PRMI_LOCKED instead. Sheila looked into making the guardian script handle what I did better, but DRMI eventually locked on its own! SOOOOO, I did NOT get to touch the alignment of the BS during Initial Alignment or PRMI.
For DC READOUT (or around there), we received a "Wrong Mode" message. It eventually went away on its own, but will need to figure out what an Operator should do if this message holds us up in the future.
20:41 - 20:48: Ran A2L (per Tues Regular Mainteance) & it took ~7min.