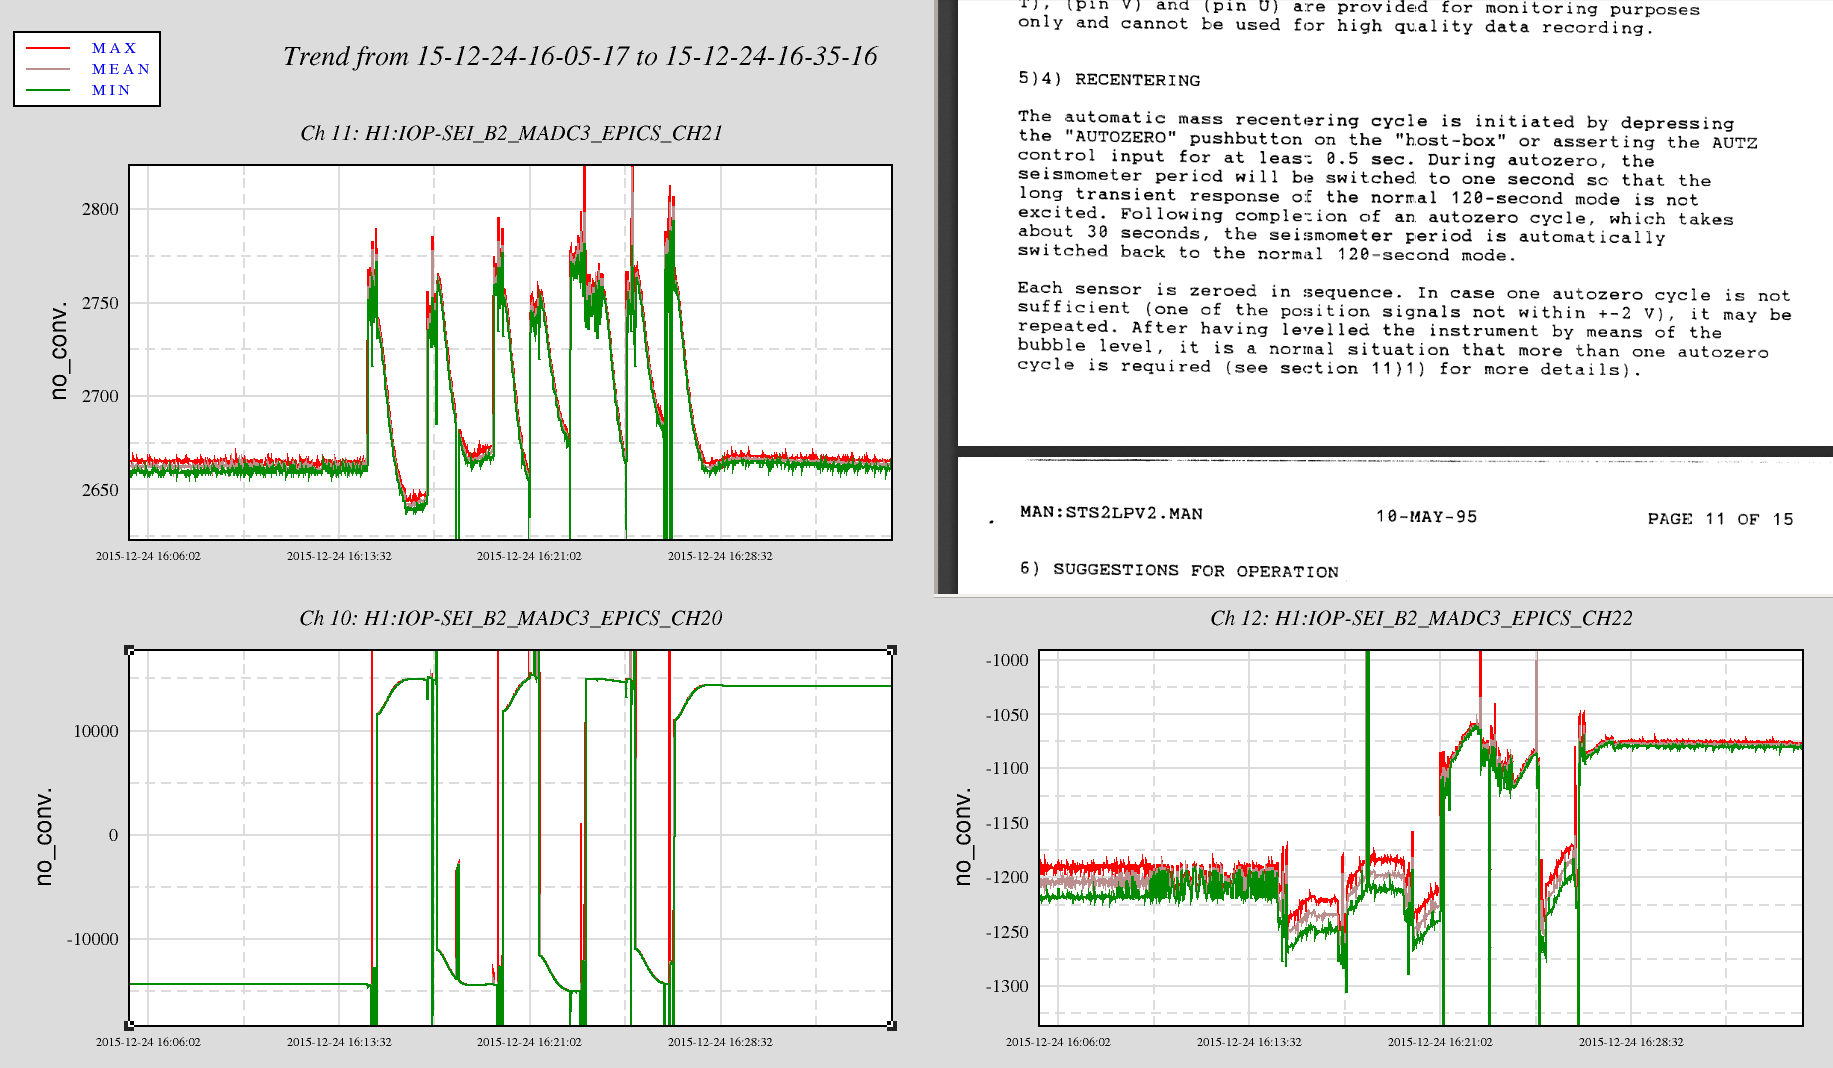
Attached are 30 minutes of trends of the mass positions for the STS2-B ground seismometer used for SEI sensor correction. With the U mass x3 out of position spec and the IFO down for environment, I decided to really try centering. With Jeff's guidance, we figured out what we were looking at and now understand the process. Included in the attachment is a clip from the manual about the centering--hold the AutoZ for 5 0.5 seconds and after 30 seconds it is switched from 1 sec period back to 120 second period. Process may need repeating.
Well, bottom line, the U mass is still not centered and looks worse than just not being centered. I attempted this six times.
The U mass position is the lower left trace ...EPICS_CH20. The other two traces show that they are not moved very far during and return pretty close to where they started after the centering. The big glitch off the graph about mid way is when I toggled the FP switch to UVW and the 5th center attempt looks different as I manually switch the instrument to 1 sec.
The U mass position just jumps back and forth from +-15000 counts, 4.57V [3.0518e-04 V/ct.] What does this mean, at best...maybe the seismo is not well leveled. I pride myself in this and I think it is well leveled but the bubble could be poorly adjusted. Could there be a big offset in the position readout? Seem like it would always be the same sign if that were the case. Could the mass be stuck or maybe more likely dragging? Maybe if the machine was out of level, makes some sense. Could it be worse and just toast? Yes.
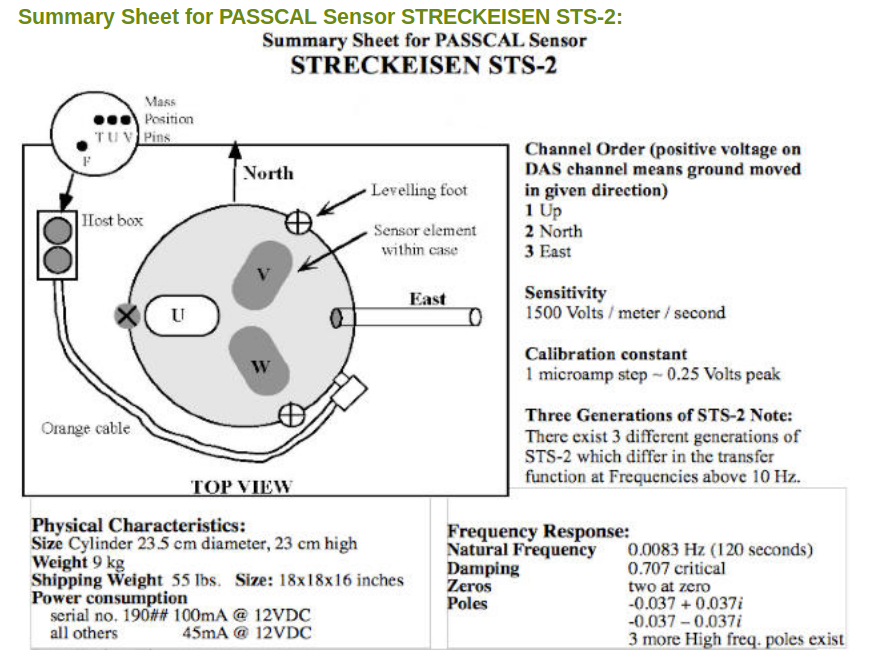
The second attachment is a view of the machine from Passcal. It shows the orientation of the UVWs wrt 'North/East.' For LIGO we've oriented these as North being the Yarm and East is the X arm. The UVW axes of the machine angle upward so that U V & W motion contribute to the Z and X determined motions but Y has only V and W mass movement contributions. This may tie in nicely with my post yesterday 24414 where it looks like the Y signal is good but the X and Z not so much.
I again recommend moving (carefully) the STS2-C instrument from the HAM5 area to the area near the BS where the tilt motion is minimal for the LVEA. And then we can look at the U axis leveling of the STS2-B unit.
Oh yes, of course while doing this, the HPI and ISI sensor correction were ramped down and then returned easily with the SDF. Oh how I love RCG 2.9.6.