TITLE: Dec 8 DAY Shift 16:00-00:00UTC (08:00-16:00 PDT), all times posted in UTC
STATE Of H1: Commissioning
SUPPORT: Sheila, Hugh, TJ, Evan, Jenne
LOCK DURATION:
INCOMING OPERATOR: Cheryl
SHIFT SUMMARY: After maintenance day, winds picked up, sometimes in excess of 45 mph. Locking has been tedious and not gotten past ASC part_3.
ACTIVITY LOG:
15:55 Tv crew is on site
16:00 Christina and crew will start at End-Y
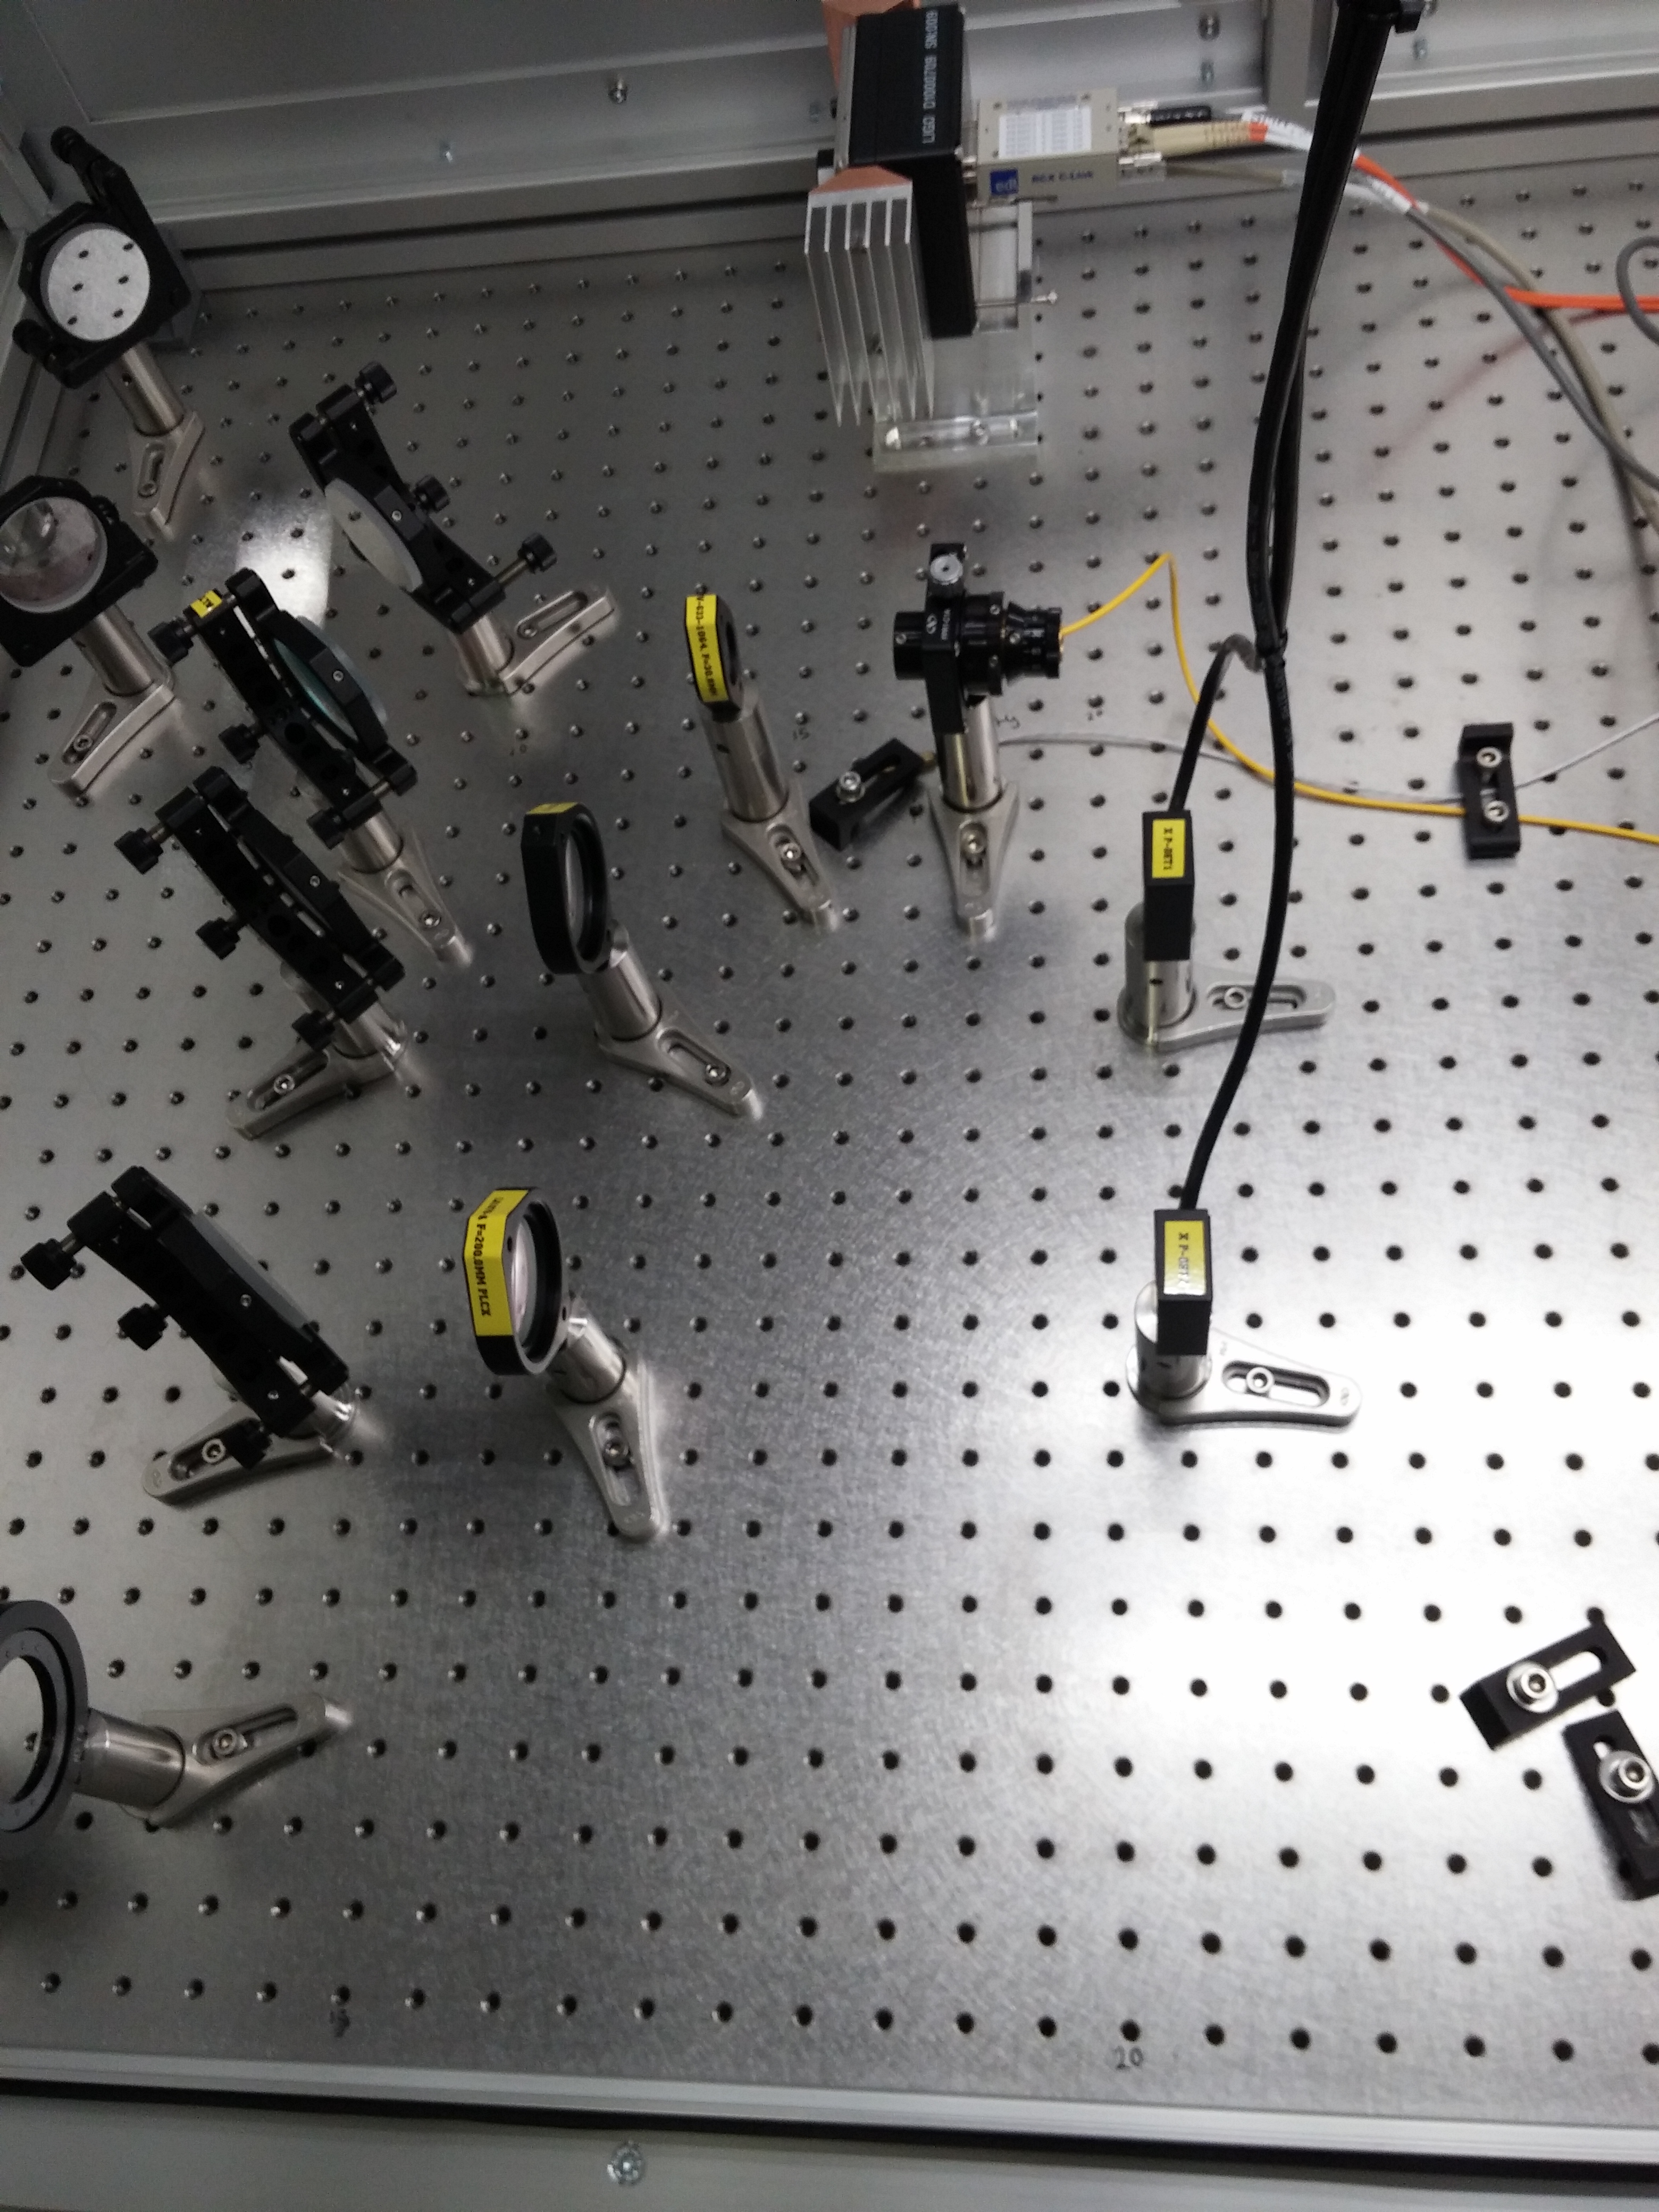
16:03 Jeff B out to LVEA. pulling vacuum plumbing for dust monitors along input arm. Mitch will be joining him when he arrives
16:04 Bubba is going to LVEA to inspect the supports on the crane/snorkel lift
16:10 Richard testing phones at out buildings. Will be calling ops to confirm numbers.
16:12 Schofield and Jordan out to CER.
16:21 Jodie 3IFO Storage monitoring
16:21 Gerardo out to LVEA to replace annulus ion pump on Y manifold.
16:25 took IMC down for Hugh to do some Guardian/ISI work HAM2/3 WP5640
16:28 Betsy into LVEA
16:41 Karen called from End-Y to report water on floor under pump in the mechanical room. John is going to investigate.
16:44 Fill out to LVEA to survey for a future cable run
16:45 Cleaning crew donw at Y heading to X
16:46 Richard is done with phones.
16:56 Jodi is done in LVEA
17:00 Joe returning a hose into the LVEA.
17:03 Travis out to LVEA to join Betsy.
17:04 Port-o-let service on site
17:05 GW/EM Test alarm received
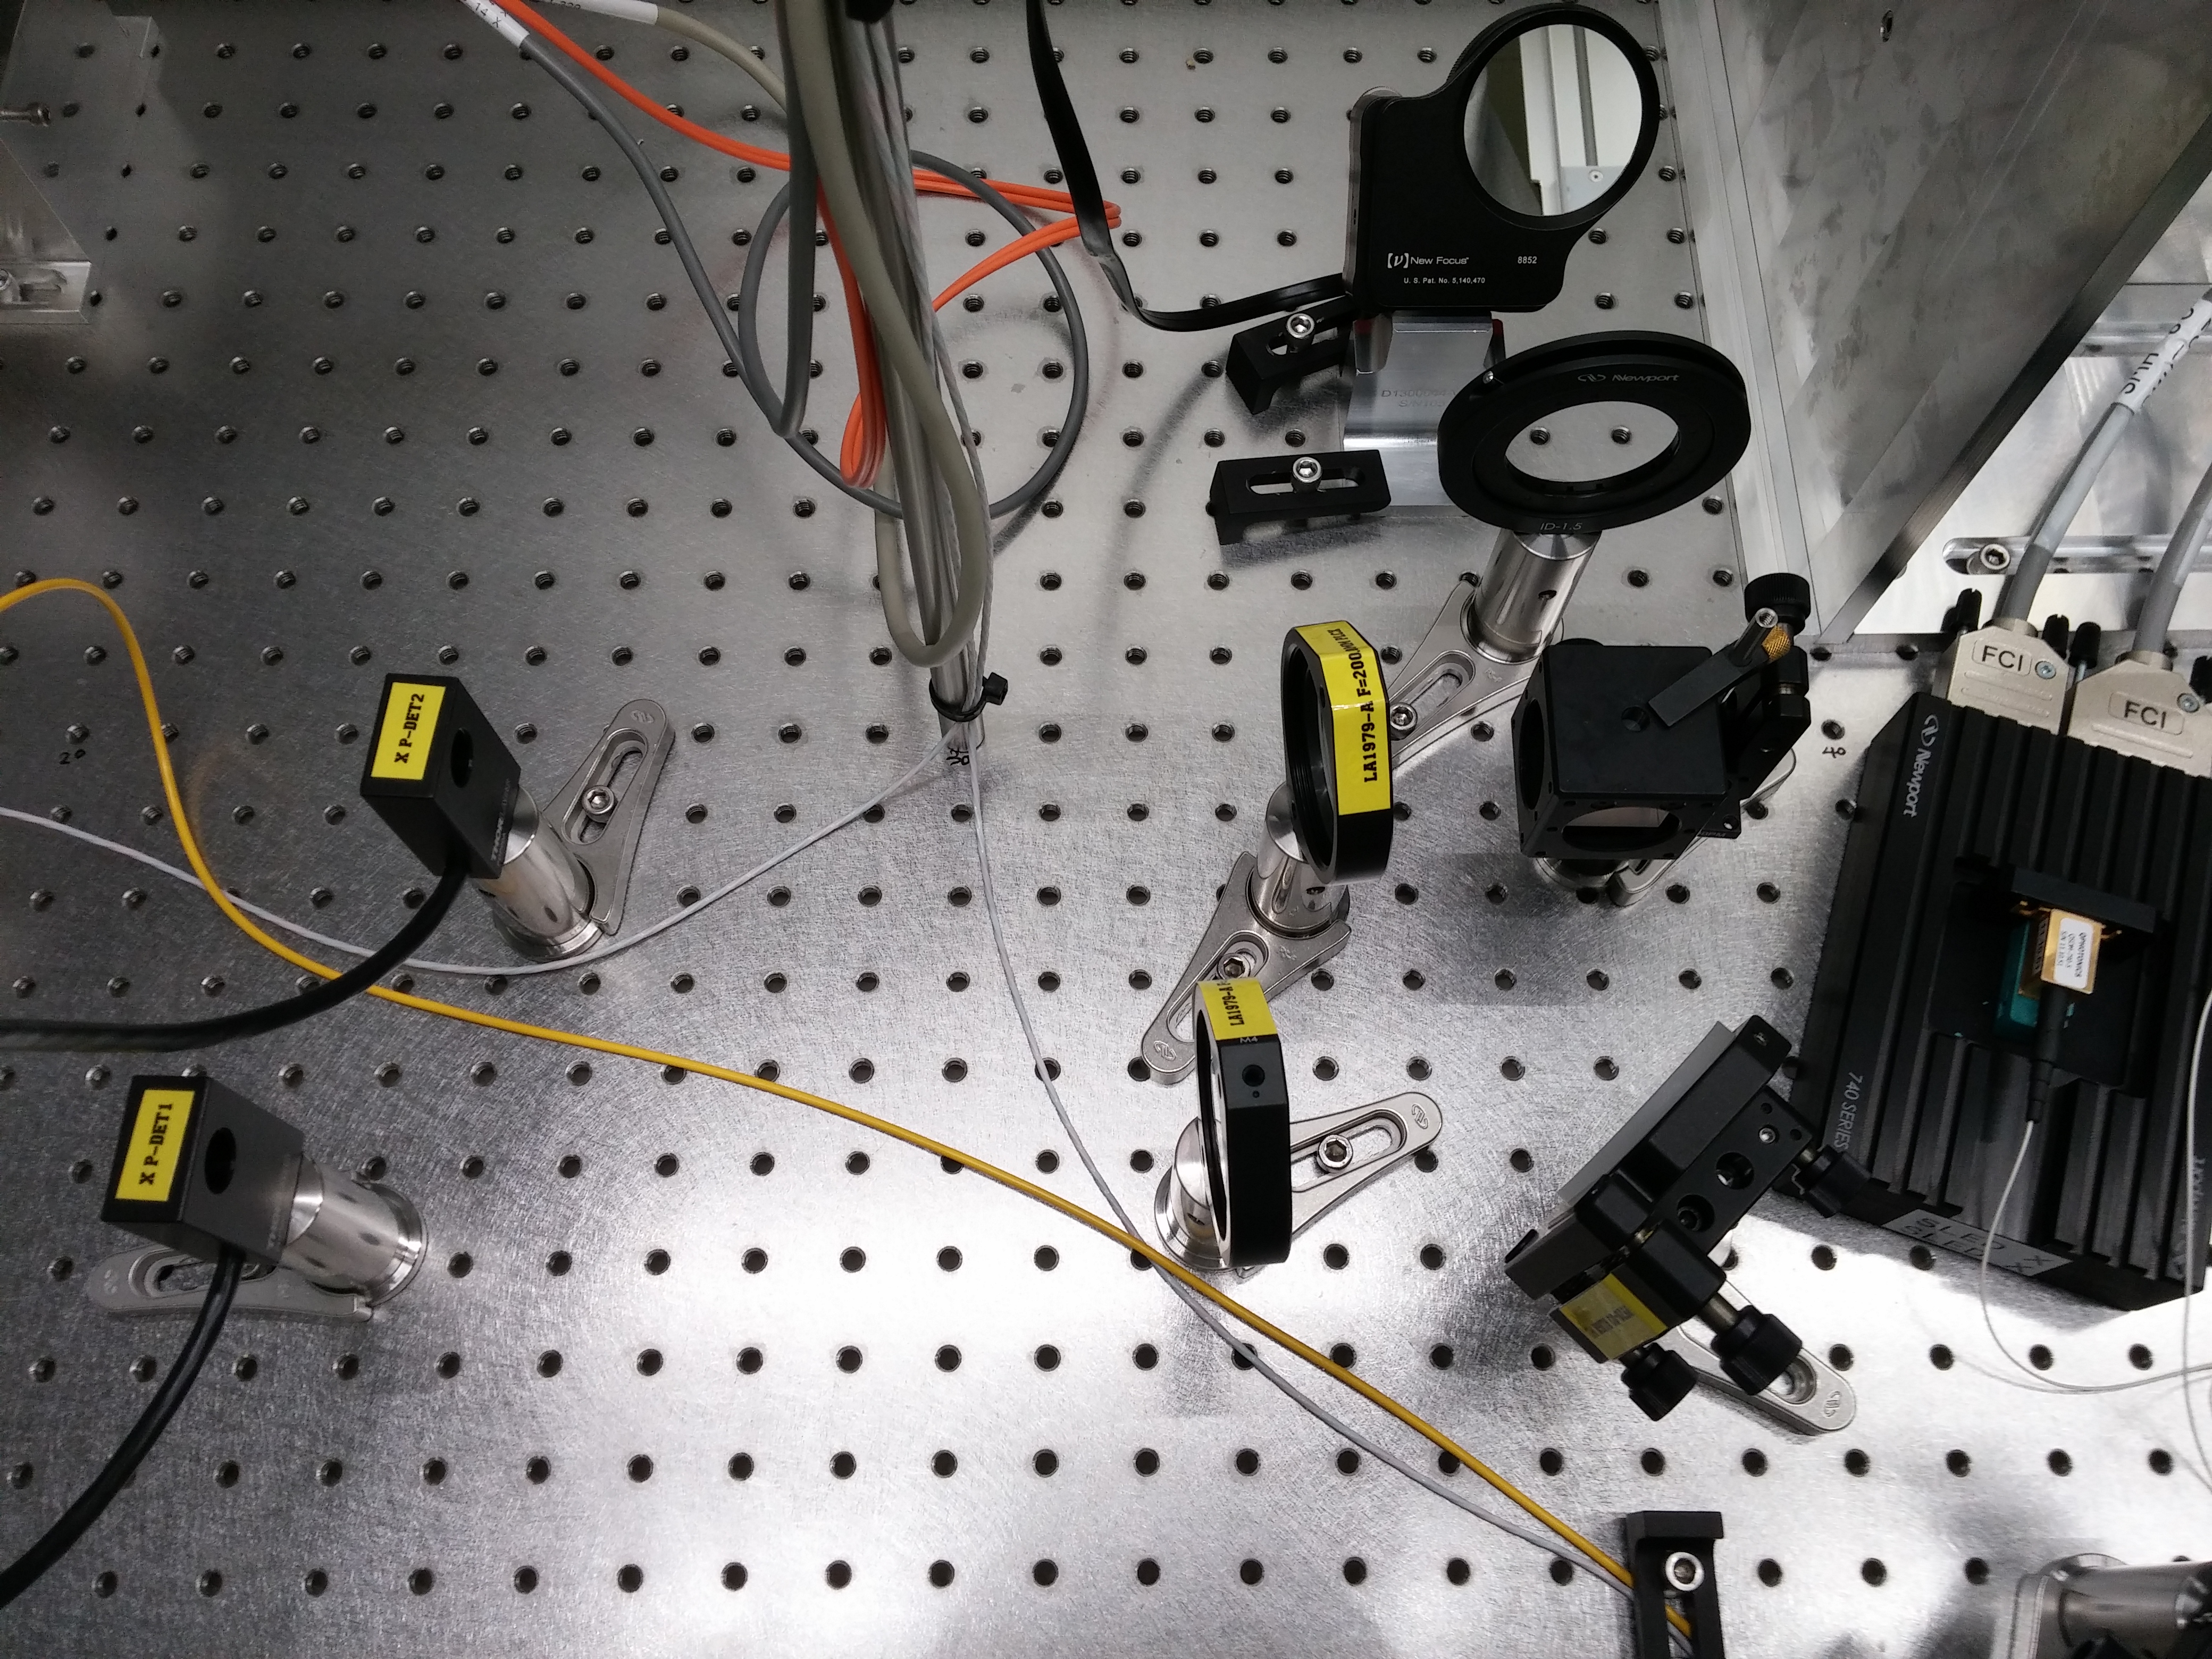
17:11 Betsy called from LVEA. HWFS team can begin.
17:11 Richard out to join Fil in LVEA
17:15 Karen called from End-X. Lights not turning on.
17:23 HFD on site.
17:25 Kyle headed to Y-2-8 to start generator
17:35 Fil and Pete pulling a cable or two on the input arm and also around HAM4. WP5644
17:43 John and Bubba to EX and then EY. Water damage will have the lights down at EX until further notice.
17:46 Betsy into LVEA to check on maintenance work progress.
17:56 Hugh headed out to Ends to do weekly HEPI fluid checks.
18:14 re-locked IMC
18:15 Chris out to join crew at End-X
18:15 Alistair arrived on site
18:20 Jason reset the PSL WD
18:28 Hugh back from HEPI checks at End Stations
18:45 Hugh finished doing HEPI fluid checks.
18:52 Hugh into LVEA looking for 3IFO parts
18:56 Gerardo finished with annulus pump. Aux cart will stay on until noon.
18:58 CDS WP5637 executed.
19:04 Coca-Cola on site.
19:05 Hugh back from LVEA
19:24 Bartlett to End-Y to take pictures.
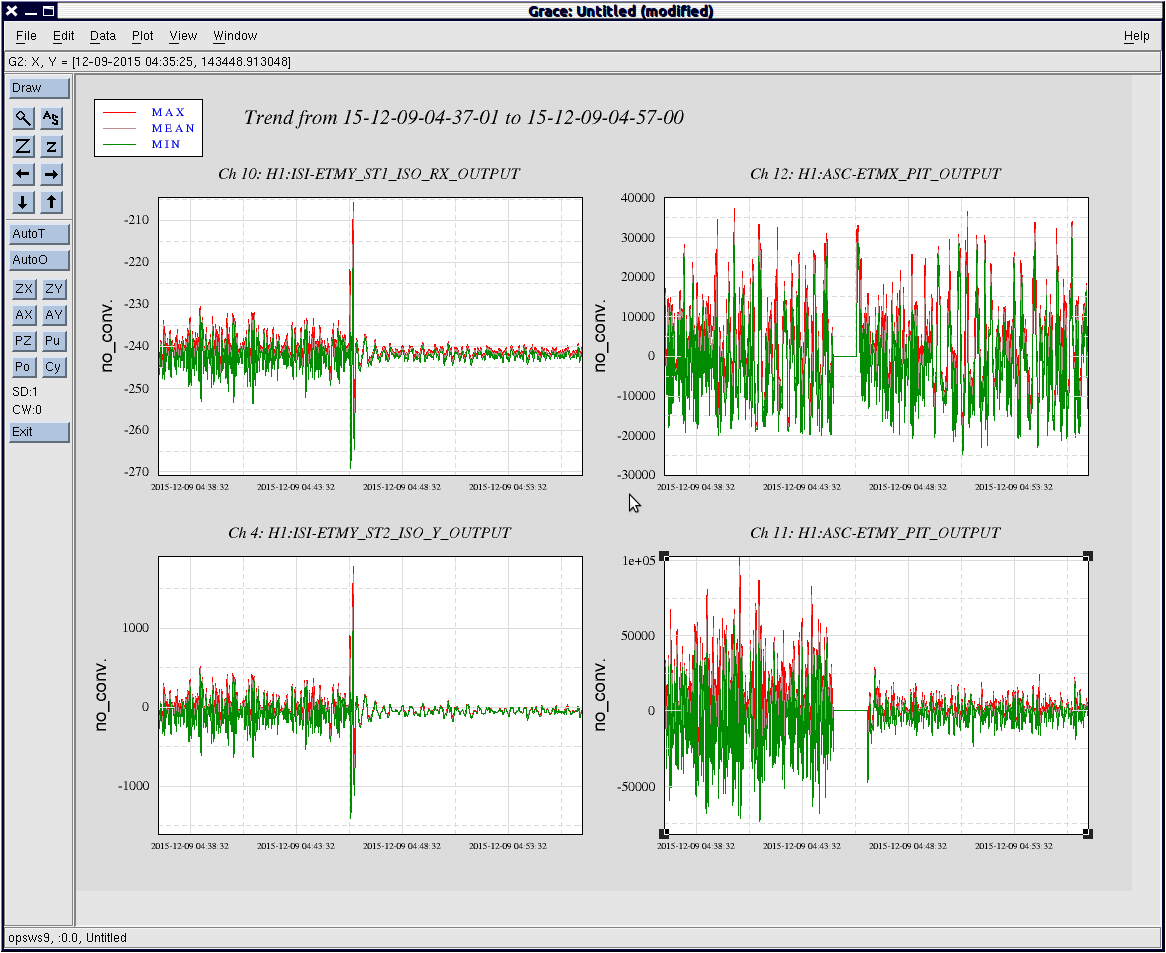
19:40 Cleared L4C saturation accumullators.
19:42 Jodi heading into LVEA to check equipment (scope) for auditor.
20:00 Jeff B doing LVEA sweep.
20:10 Begin Initial Alignment
20:20 Gerardo exits LVEA and turns out lights. Richard headed out for a minute before I move on.
20:23 Begin full Locking sequence.
20:35 Kyle heading back down from Y-2-8 arm.
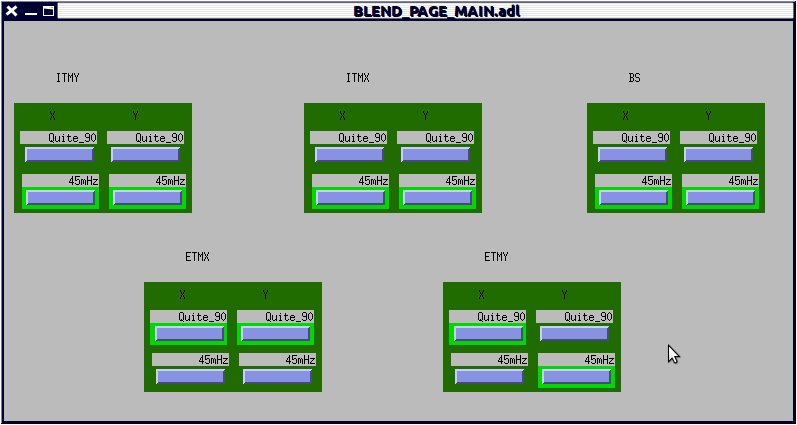
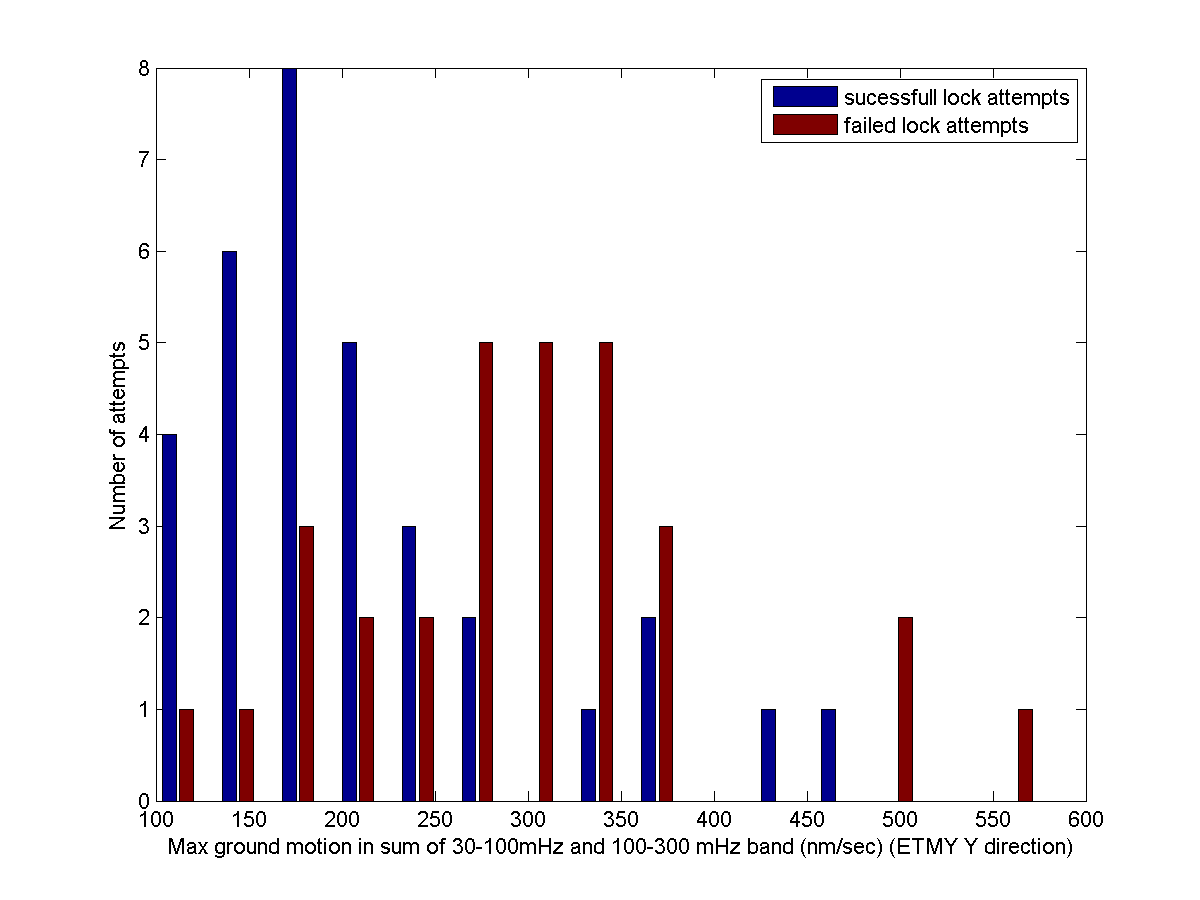
21:43 switching to 90mHz blends in corner after many failed attempts w/high winds.
21:51 Kyle driving out to Y-2-8 again.
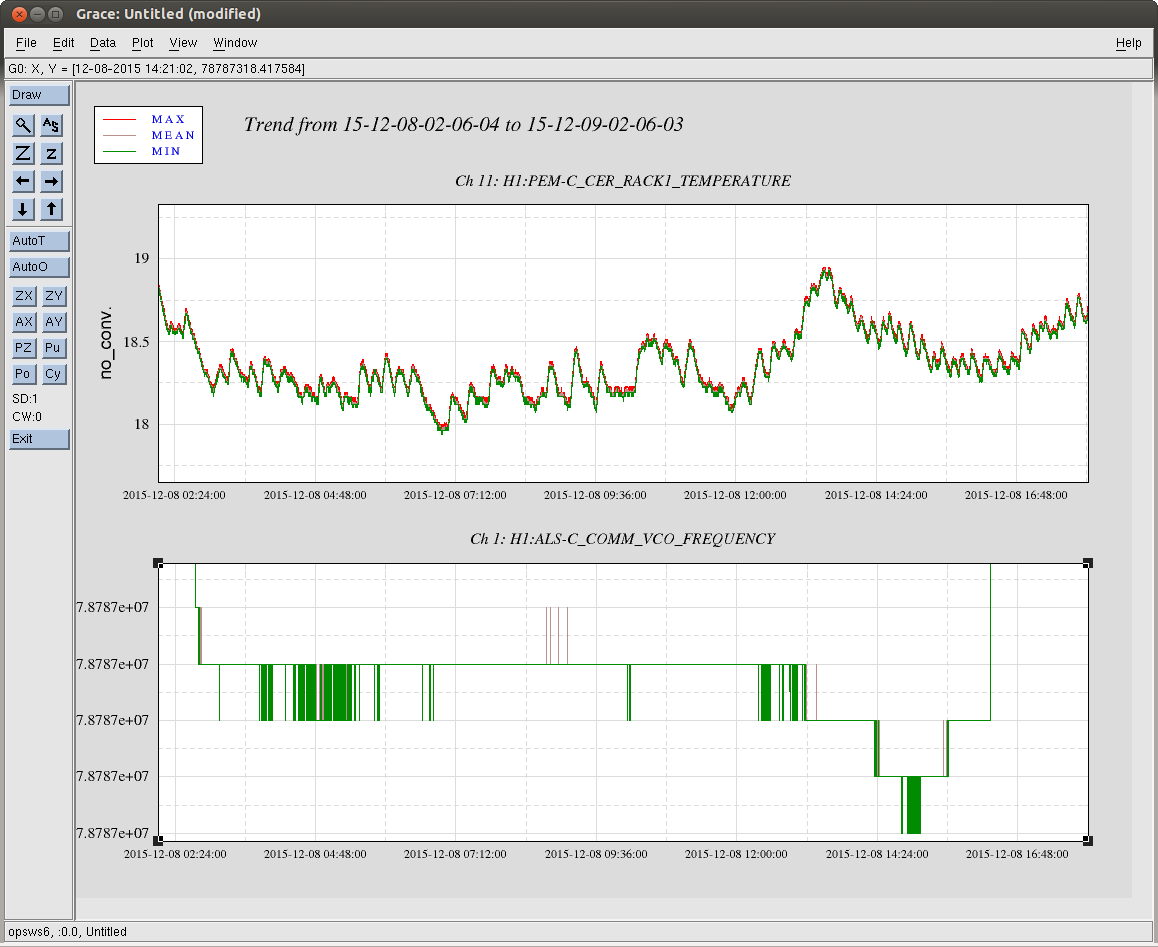
22:02 Switched corner back to 45mHz blends and changed ETMX to 45 on axis and 90 off axis. ETMY has been configured this way the whole time. Wind speeds seem to have decreased slightly at EX.
23:00 after many failed attempts, this has been put in the commissioner’s hands.
