The mystery ~650Hz noise reported here and here also shows up in the PEM rf antenna (in both 9MHz and 45MHz located in CER and LVEA). Further investigation revealed that this peak shows up in the PEM antenna during lock aquisition at the start of the DC Readout Transition step (if it appears at all; it's not present in every lock--more on this later). At the start of this step the ALS COMM VCO is parked at some value.
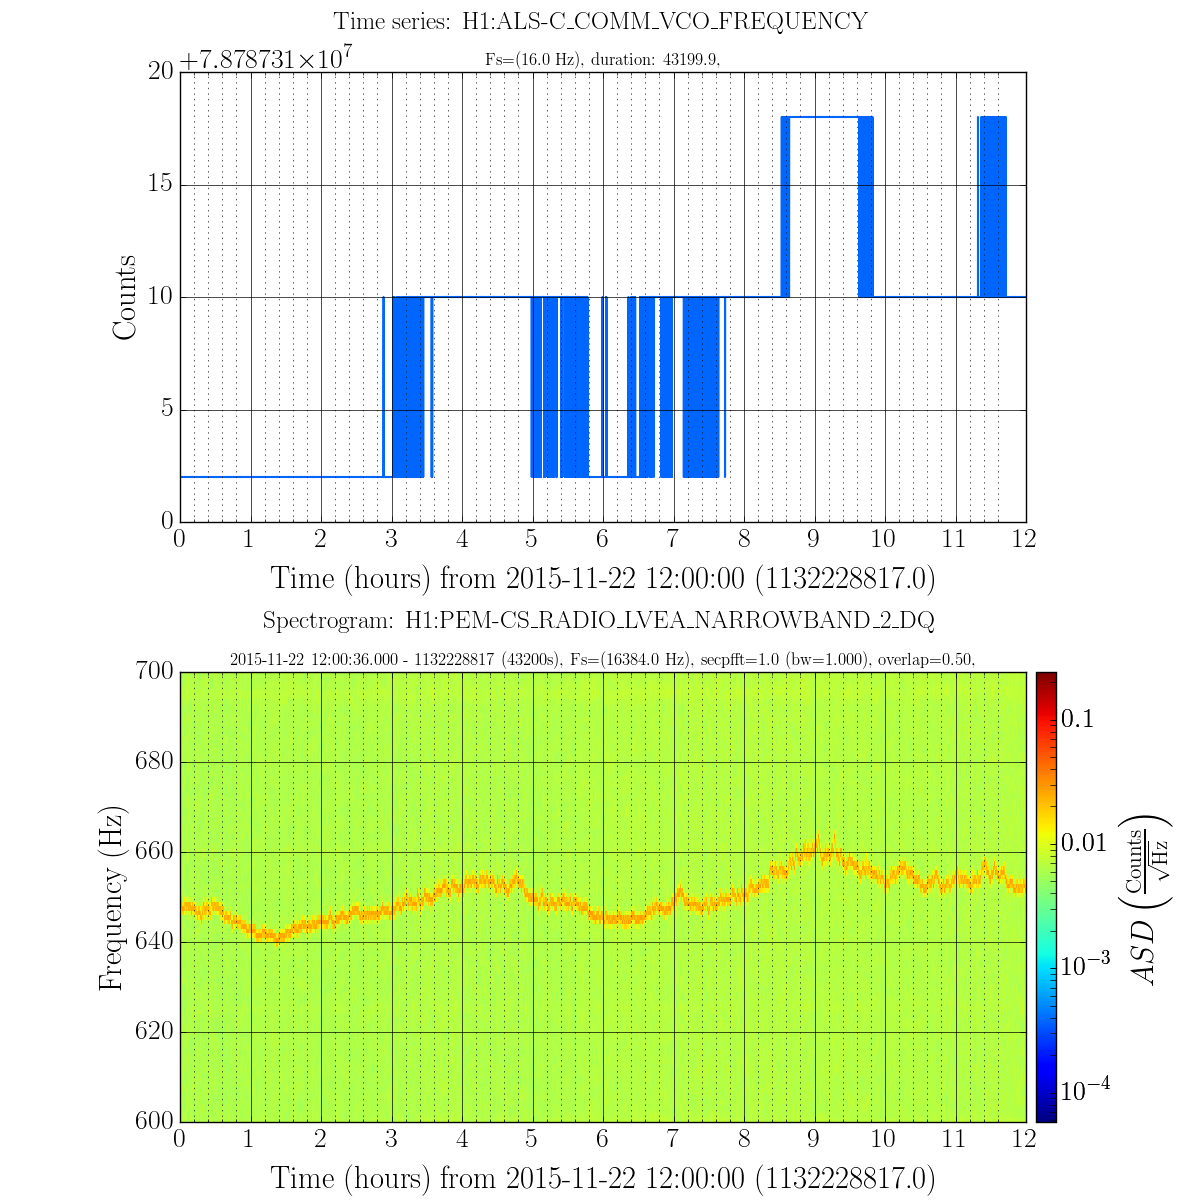
To determine whether this VCO could be responsible for the ~650Hz noise, the frequency readback of the VCO was compared to the frequency of the mystery peak in the PEM antenna. Attached (figure 1) is a plot of H1:ALS-C-COMM_VCO_FREQUENCY timeseries on top and spectrogram of the PEM 45MHz LVEA antenna on the bottom. The frequency of the peak seems to track with the VCO frequency if you take into account the fact that the VCO frequency readback is digitized into steps of 8Hz (does anyone know why / can we fix this?).
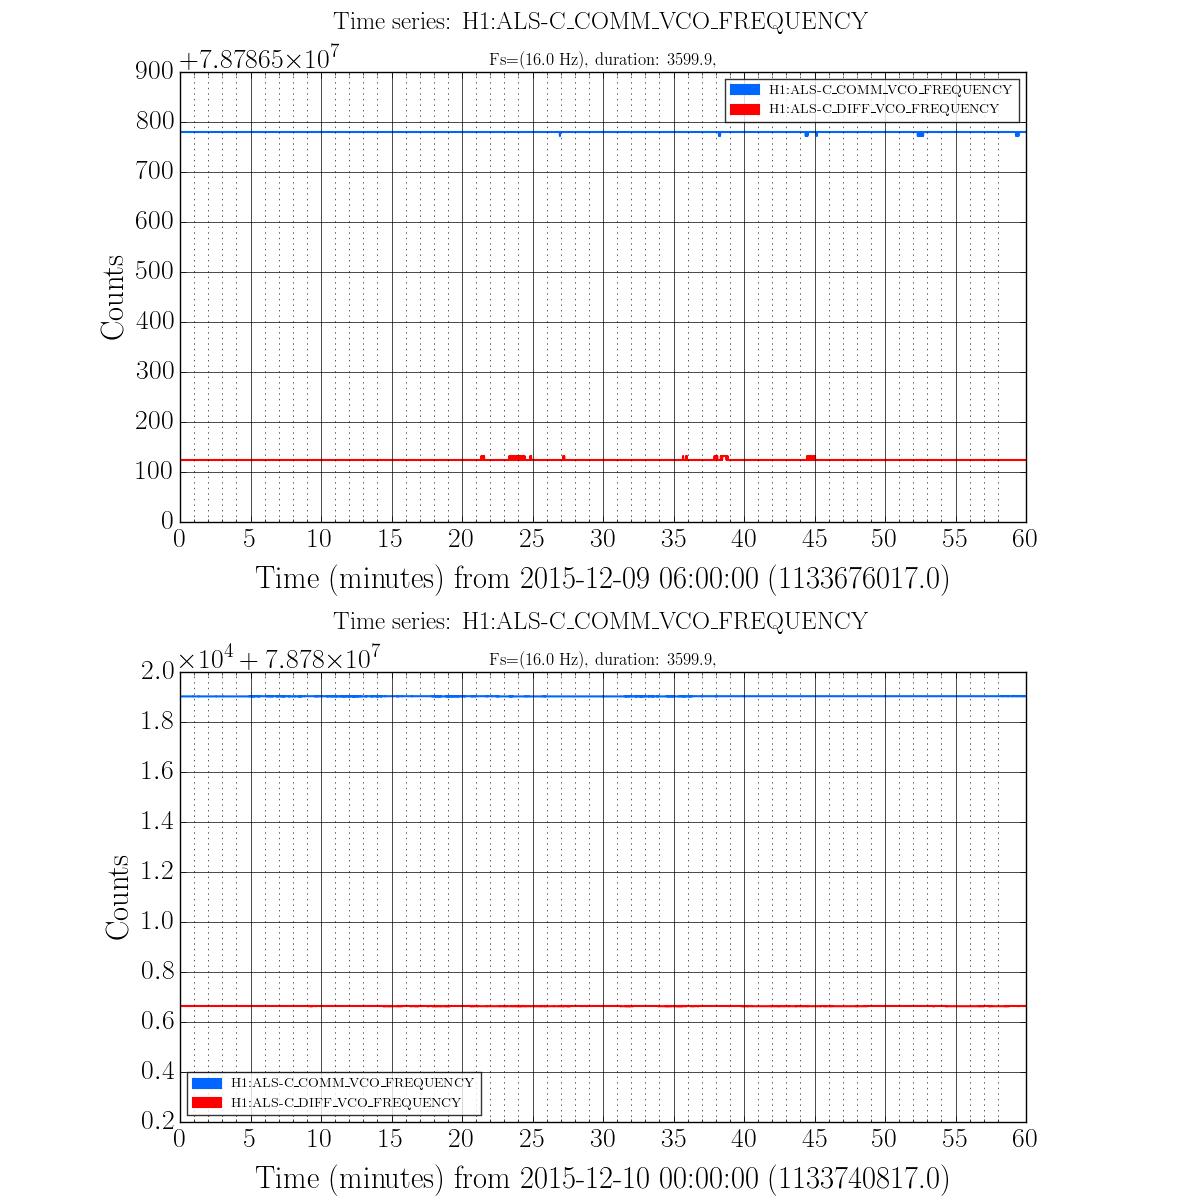
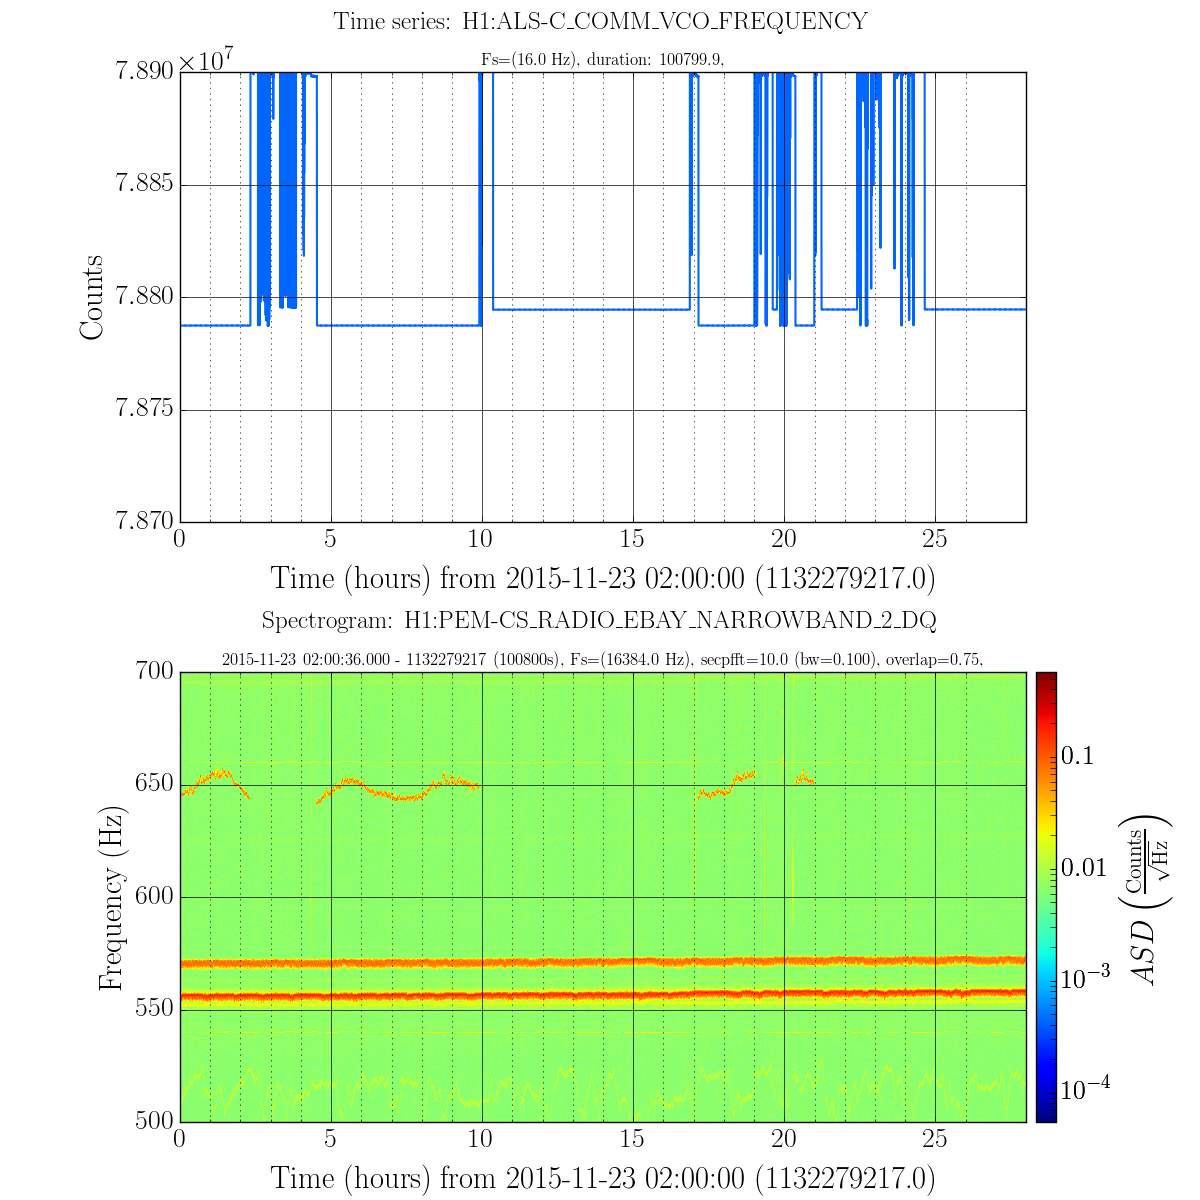
Also, there appears to be 2 different values where the VCO can be parked. Figure 2 has similar plots to figure 1, over a 28hr stretch which contained multiple locks where the peak was sometimes present. In locks where the peak was present, the VCO was set to ~78.7873MHz. For locks where the peak is not there the VCO was set to ~78.7944MHz. These values correspond with two different values of H1:ALS-C_COMM_VCO_TUNEOFS : ~-1.39 and ~1.25, respectively.
To test this, we tried moving the COMM VCO TUNE OFS slider with the IFO locked (before continuing to NLN / Observing). While initially it looked like the peak in the PEM rf channel moved as the slider was moved, the lock broke before we could conclusively tell. The lockloss occurred right as Sheila was moving the slider. We don't know why this should cause a lockloss, so this is a subject for further investigations (it was windy and ground motion-y at the time so it could have been a coincidence).
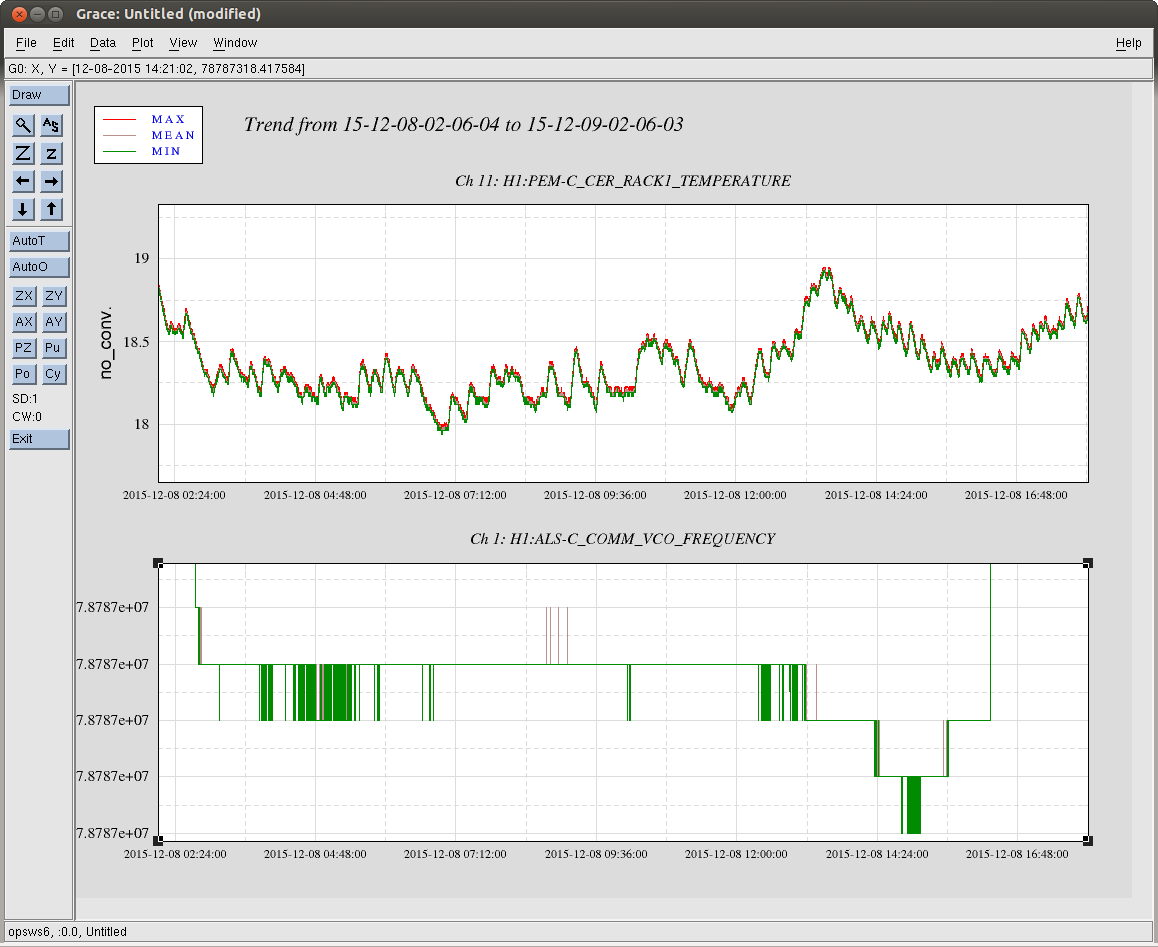
Also included (figure 3) is a plot of the VCO frequency (again, 8Hz digitization) and the CER Rack temperature. More data is needed, but it looks like the freqency trends down after the temperature rises.
Finally, there is still the question as to why this is showing up in the 9MHz and 45MHz channels (and, ultimately, DARM). As a first check, I compared 9.100230 MHz and harmonics to 78.7873 MHz and harmonics to see if a beat would show up within 600 Hz. Out to 10 harmonics of the VCO frequency the closest they came to each other was 200 kHz--still a mystery.
Jordan, Robert, Sheila