jason.oberling@LIGO.ORG - posted 10:33, Tuesday 08 December 2015 (24045)
H1 PSL FE Watchdog Reset
I reset the 35W FE watchdog at 18:21 UTC (10:21 PST).
I reset the 35W FE watchdog at 18:21 UTC (10:21 PST).
The lights at End X are not functioning. The lighting controller died. I will make arrangements to get a system back up and running but in the meantime take a flashlight to the End station if you need to work down there.
Verified the functionality of the phones near the entrance door at each Mid and End station.
Placed a call from the phone and received a call back.  Verified that the number registered properly on the phone I called.
Mid-X 236
End-X 238
Mid-Y 237
End-Y 239
TITLE: Dec 8 DAY Shift 16:00-00:00UTC (08:00-16:00 PDT), all times posted in UTC
STATE Of H1: Observing 80Mpc
OUTGOING OPERATOR: Patrick
QUICK SUMMARY: IFO is locked at NLN and Observing @ 80 Mpc. EQ bands are around .04µm/s and µSeis is trending down to around .6µm/s. Wind is ≤20mph. MAINTENANCE DAY.
TITLE: 12/08 [OWL Shift]: 08:00-16:00 UTC (00:00-08:00 PDT), all times posted in UTC

STATE Of H1: Observing @ ~ 78 MPc.
SHIFT SUMMARY: Quiet shift. Rode through ~ 5.6 magnitude earthquake in Chile. A couple of SUS ETMY saturations. Microseism is trending down.
INCOMING OPERATOR: Ed
STATE Of H1: Observing @ ~ 81 MPc.
QUICK SUMMARY: Microseism has continued to trend down. SUS ETMY saturation at around 09:40 UTC.
TITLE: 12/07 EVE Shift 00:00-08:00UTC (16:00-00:00 PST), all times posted in UTC
STATE Of H1: Observing
SUPPORT: Sheila, Jenne, Evan
LOCK DURATION: 5 hr 19 mins
INCOMING OPERATOR: Patrick
END-OF-SHIFT SUMMARY: Observing for the most part. Wind stays low. Useism continues to decrease. DMT Omega looks clean for the past hour. No noticable EQ band seismic activity. The BS butterfly mode started off high causing a few OMC DC PD saturations but ring down on its own afterward.
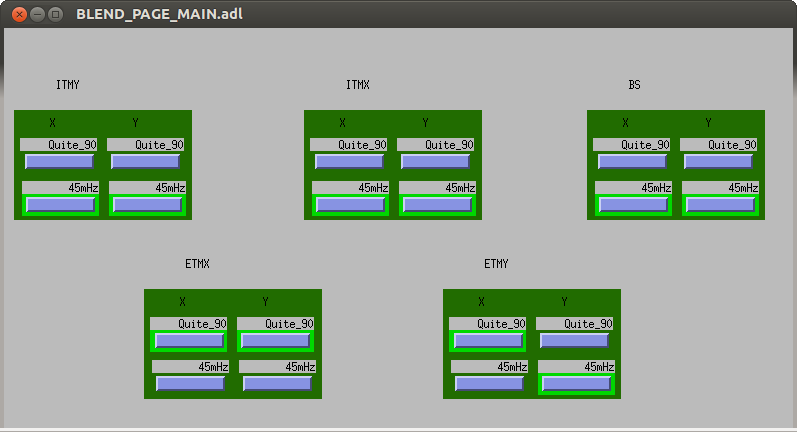
TITLE: 12/08 [OWL Shift]: 08:00-16:00 UTC (00:00-08:00 PDT), all times posted in UTC

STATE Of H1: Observing @ ~ 78 MPc.
OUTGOING OPERATOR: Nutsinee
QUICK SUMMARY:
From the cameras:
The lights are off in the LVEA.
The lights are off in the PSL enclosure.
I can not tell if the lights are on or off at mid X and mid Y.
The lights are off at end X.
The lights are off at end Y.

The 0.03 - 0.1 Hz (earthquake) seismic band is between ~ 0.01 and 0.1 um/s.
The 0.1 - 0.3 Hz (microseism) seismic band is trending down and is currently between ~ 0.2 and 1 um/s.

The winds are between ~ 0 and 10 mph.

The ISI blends are on 45 mHz at ITMY, ITMX and BS. They are on Quite_90 at ETMX. They are on Quite_90 at ETMY X DOF and 45mHz at ETMY Y DOF. (see attached screenshot)

From pinging:
CDS WAP is off at the LVEA.
CDS WAP is on at mid X.
CDS WAP is on at mid Y.
CDS WAP is off at end X.
CDS WAP is off at end Y.
Useism slowly decreasing (now crossing 5e-1 um/s). Low wind (< 10 mph). DARM ball dropped off the table at 4:57 UTC. Just want to write that down in case something shows up in DARM...
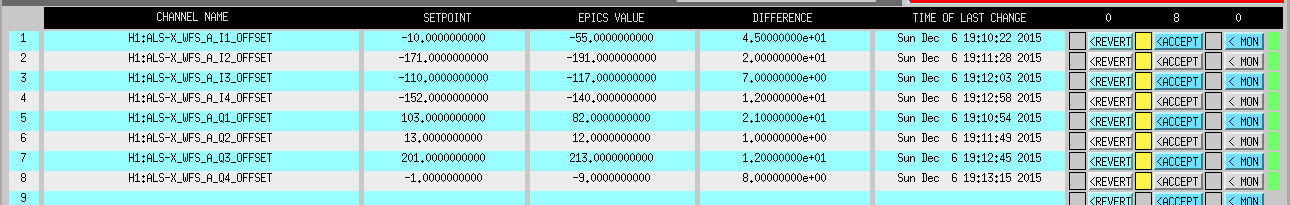
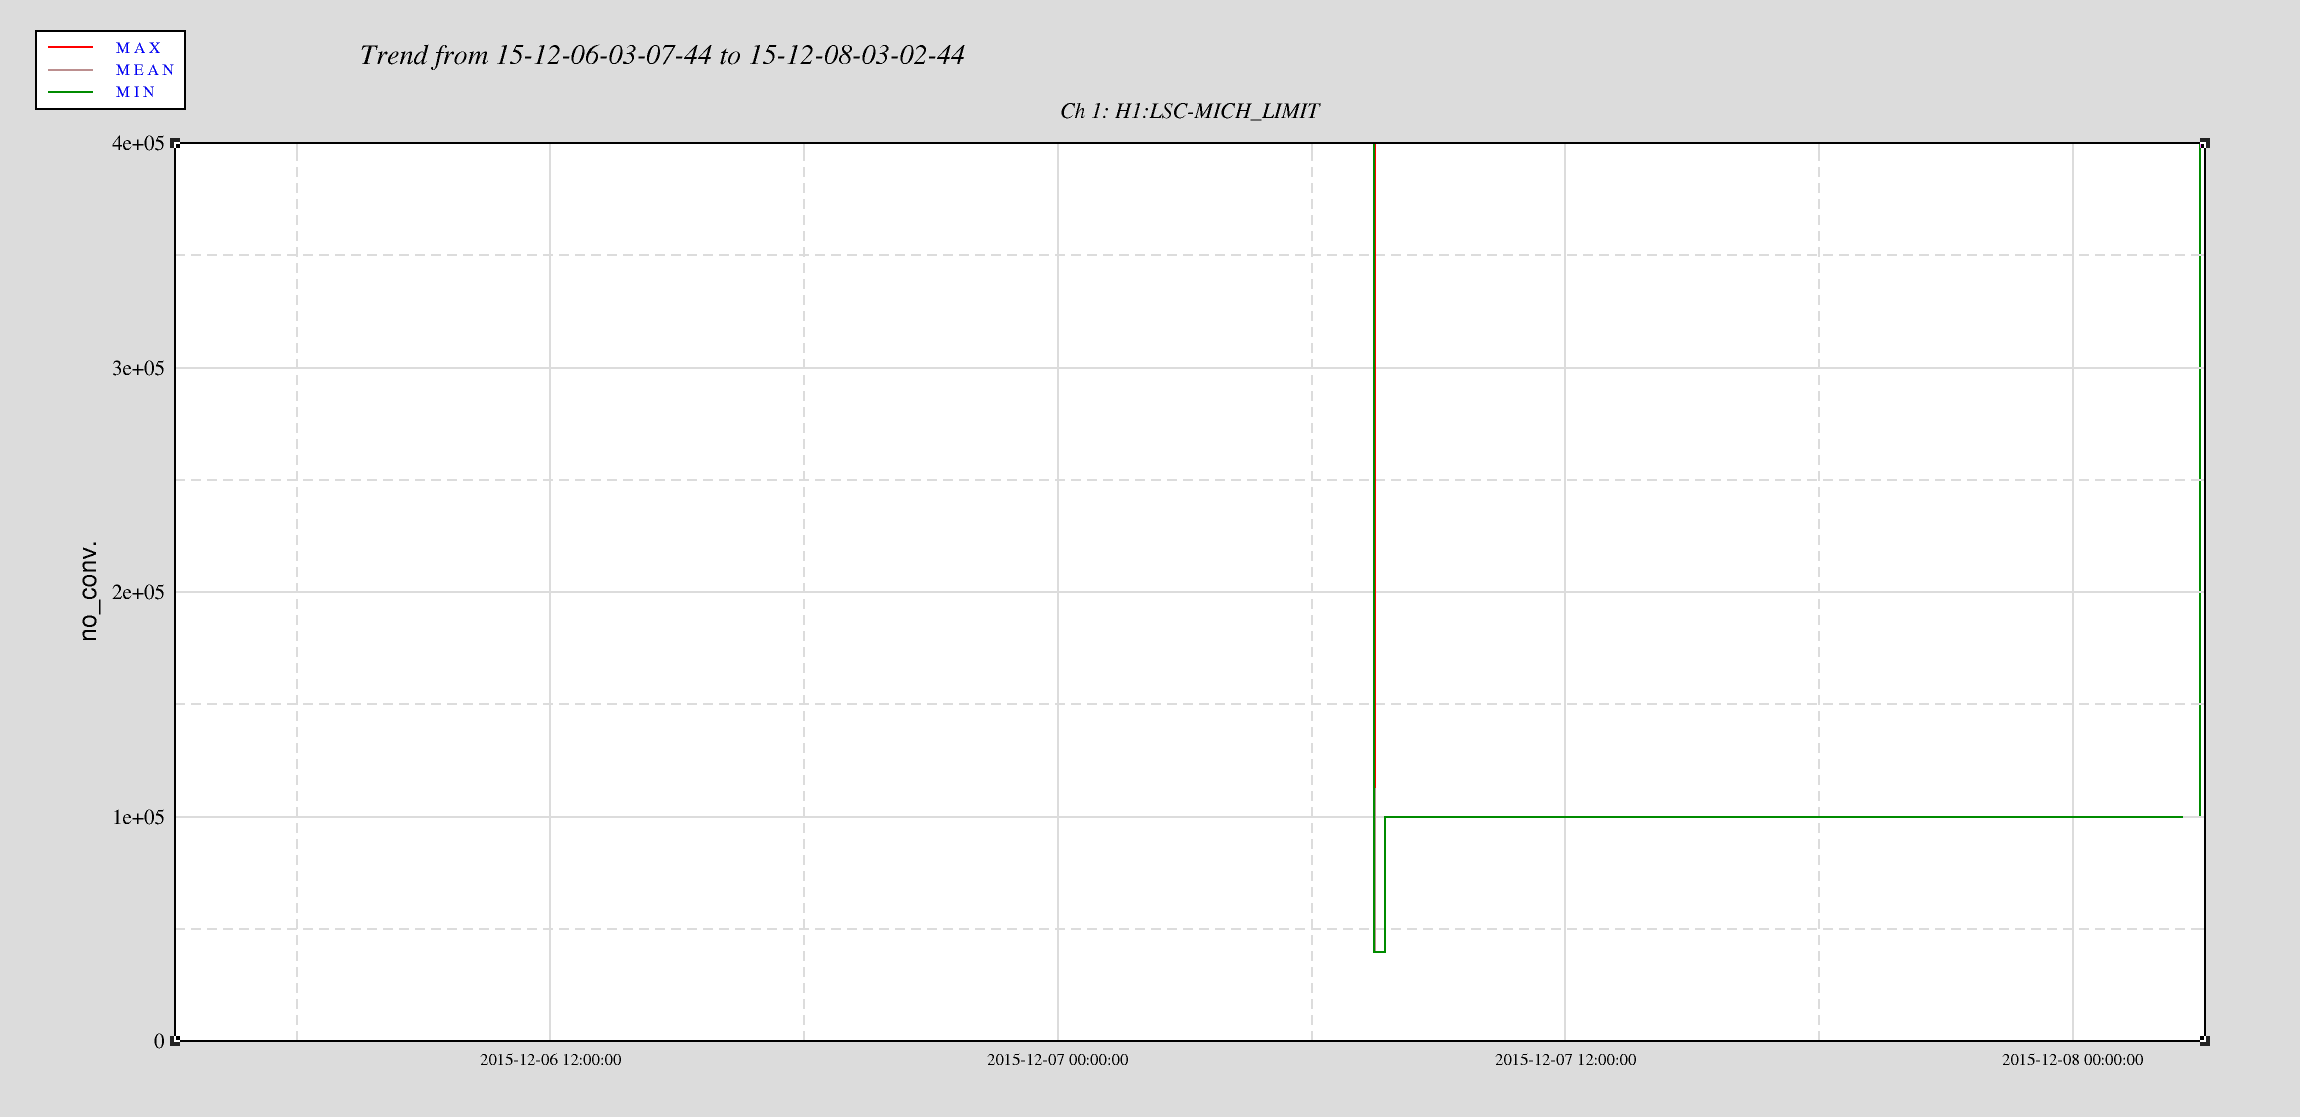
There were several SDF differences. Ones worth noting are the WFS dark offsets (screenshot attached). MICH limiter was also decreased by a factor of 4 but that seems to happen after Cheryl started having problem.
This isn't a big deal since we seem to have most of the cameras displayed on one of the monitors around the room, but I can't switch the image that is displayed on the monitors in the front row, and earlier Corey couldn't change the images in the operator displays.
Observation: It has been reported on the DetChar calls that there are lines observed in the Pcal spectrograms that are wandering in the 10-50 Hz range and some higher harmonics. The worry would be that this is actually on the light and causing an extra force on the optic, albeit at several orders of magnitude less than the nominal Pcal injection lines.
Investigation: Taking a DTT spectrum of the calibrated PD readback channels, H1:CAL-PCAL(X|Y)_(R|T)X_PD_OUT_DQ (apparently calibrated in Newtons of force applied to the optic--helpful!), we can easily see peaks corresponding to the injected lines (see attached, H1pcalYpd.pdf). Conveniently, since the channels are calibrated, the force applied to the mirror is within ~1% at the injection frequencies. So, if the observed wandering lines were actually on the light, then we would expect to see the lines at the the same amplitude in the two channels. Instead, there is ~25% difference in peak values for an example wandering line near 15 Hz.
This would suggest the line is not on the Pcal laser light. Robert S. suspects these Pcal wandering lines are more likely a DAQ issue. He says that he has observed other wandering lines within a factor of a few of the DAQ noise floor in many PEM channels. Recall that for the Pcal channels, all of them are being read into the DAQ on the same ADC card, so it's not surprising that these wandering lines are seen in many channels (see attached, H1pcalYall.pdf).
Additionally, due to the large amount of change in the observed line frequencies, this would eliminate mechanical resonances as a culprit.
I checked for coherence between Pcal PD readback and the nearby magnetometer, H1:PEM-EY_MAG_VEA_FLOOR_(X|Y|Z)_DQ, but did not find any significant coherence at the fundamental wandering line frequency seen recently, ~15 Hz (see attached, H1pcalYpdMag.pdf). Also, the nearby magnetometer shows no peak in the spectrum at ~15 Hz.
Conclusion: It would seem then that the wandering lines in Pcal are more likely a DAQ issue than a Pcal issue.
This explanation seems plausible based on a study from 2013 done during the HIFO-Y test
at Josh's request (see slides I showed at the Hannover Sept 2013 LVC meeting).
Attached are a couple of slides showing spectrograms on different days for a
terminated DAQ channel.
TITLE: 12/7 DAY Shift: 16:00-00:00UTC (08:00-16:00PDT), all times posted in UTC
STATE of H1:
Incoming Operator: Nutsinee
Support: Hugh, TJ, Jenne, Ed, Sheila
Quick Summary:
Shift Log:
After the HAM2/3 were brought back went about restoring input pointing alignment since whenever these HAM ISIs trip, the IM mirrors get shifted. Cheryl has a procedure for checking/restoring this alignment here.
So from about 9:30 to about 11:30am PST addressed input mirror alignment.
Made changes to several optics. One oddity was the IM3 Pitch. It's slider has a limits of +/-25,000, but the value is ~ 57,000 (and only way to move more positive is to enter a value by hand.) After restoring optics, checked that we were in the ball park by looking at IM4 Trans QPD (and we looked fairly close).
Attached is a trend of last 24hrs (with earthquake at ~9:00utc.
My previous entry about the PRMI branch in the ISC_LOCK guardian isn't as clear as it could be, so here is a newer version.
If you find that DRMI won't lock and seems to be missalinged (you see a lot of higher order modes on the AS camera, POP90 and POP18 flashes are low) you may want to lock PRMI to adjust alignment manually:
The transition from PRMI to DRMI only works sometimes, so this is probably best used only when the alignment is bad for now. (Its not a reliable way to speed up DRMI locking).
The above instructions have changed, only in that the name of the state to request is now PRMI_LOCKED:
If you find that DRMI won't lock and seems to be missalinged (you see a lot of higher order modes on the AS camera, POP90 and POP18 flashes are low) you may want to lock PRMI to adjust alignment manually:
The transition from PRMI to DRMI only works sometimes, so this is probably best used only when the alignment is bad for now. (Its not a reliable way to speed up DRMI locking).
As Patrick reported, the Guardians for HAM2 & 3 ISI were reporting some issue; TJ is looking into that more deeply now. Regarding the Guardian update I did on 24 November, that update was only for common files and the code had been exercised on most platforms as of 1 Dec. It had not been exercised on HAM 2 3 4 6 BS or ITMX before this morning according to my notes.
This morning I decided to restart the guardian for HAMs 2 & 3 and the error condition went away. Still don't know why there was the error condition.
Next, both the ISIs were tripping during the Isolation process. It looked like this was occurring as the ISI was switching the GS13 back to high gain. I disabled the Sensor Correction thinking the high microseism might be the problem but tripping was still occurring. So I disabled the guardians, SEI and ISI, and brought the ISI to Isolation using the commands scripts. This way the GS13s could be kept in low gain. I was then able the switch the GS13 back to high gain after giving the platforms a few moments after Isolation was completed.
I tested the guardian this morning on HAM5 and it worked fine so while the first reported error gives us reason to suspect, the fundamental performance of the guardian seems to function. Again, while there are runtime parameter files unique for each ISI (although they are generally the same,) the guardian are all running the same common code. Isolation is the same on a HAM and the two stages of the BSC.
My first theory would be that the position offsets on HAMs 2 & 3 are larger than those for the other platforms. This may cause the GS13s to be noisier after the completion of Isolation just as the GS13s are switched causing the trip. However, HAM6 verticals are about 5 to 10 times that of all the others and the HAM2 & 3 horizontals are maybe only a little larger than the HAM5 drives. So, that may be the issue but it looks to be suttle. Does the payload contribute with the high microseism and the GS13 switch to trip the platform? Maybe except the HAM3 payload is much different from HAM5 and is much different from HAM2. What about the alignment wrt IFO? The HAM2 & 3 platforms, both HEPI and ISI are rotated compared to the other HAMs. What about FeedForward? HAM2 & 3 are getting X & RY FF from HEPI as is HAM6 but HAM6 GS13s aren't switched like HAM 2 & 3. HAM4 & 5 are getting their FF signals from the ISI Stage0 L4Cs.
So, could the alignment of HAM2 & 3 make them more vulnerable to the incoming high microseism? The BLRMS would not suggest this and the arrangement of the arms (NW & SW) would indicate the coastal noise woould be the same for the arms.
So the FF may be the issue. The guardian update also turns on the FF but this has proven to be a non issue in turn on transients but the microseism environment may be contributing.
A couple of things:
Remember that just because different systems are all running the same common code, that doesn't mean they all excersize the same code paths. The actual code run by the BSC ISI stages may be slightly different than what is run by the HAMs. Different functions may be executed. In some cases the different parameters given to the different chamber guardians actually specify which different code paths should be executed.
If a guardian node throws an error, a restart may cause the immediate issue to clear by resetting the state of the system, but it doesn't actually fix the error. If no code has been changed, then the error will necessarily occur again when the same conditions are met.
Study the exception traceback message, since usually that's pointing to exactly what the problem is. In this case, the error was:
2015-12-07T11:12:59.06689 ISI_HAM3 [INIT.main] determining how to get to defined state...
2015-12-07T11:12:59.08430 ISI_HAM3 W: Traceback (most recent call last):
2015-12-07T11:12:59.08432   File "/ligo/apps/linux-x86_64/guardian-1485/lib/python2.7/site-packages/guardian/worker.py", line 459, in run
2015-12-07T11:12:59.08433     retval = statefunc()
2015-12-07T11:12:59.08433   File "/opt/rtcds/userapps/release/isi/common/guardian/isiguardianlib/ISI_STAGE/states.py", line 52, in main
2015-12-07T11:12:59.08434     error_message = isolation_util.check_if_isolation_loops_on(control_level)
2015-12-07T11:12:59.08434   File "/opt/rtcds/userapps/release/isi/common/guardian/isiguardianlib/util.py", line 30, in wrapper
2015-12-07T11:12:59.08435     .format(nth=const.NTH[arg_number].lower(), func=func.__name__, allowed=allowed, passed_arg=args[arg_number]))
2015-12-07T11:12:59.08435 WrongArgument: The 1st argument of check_if_isolation_loops_on must be in {'HIGH': {'INDEX': 400, 'MAIN': ('FM4', 'FM5', 'FM6', 'FM7'), 'BOOST': ('FM8',)}}. Passed ROBUST.
This is telling you exactly what/where the error is: the check_if_isolation_loops_on function is getting an incorrect input argument when called during the INIT state.
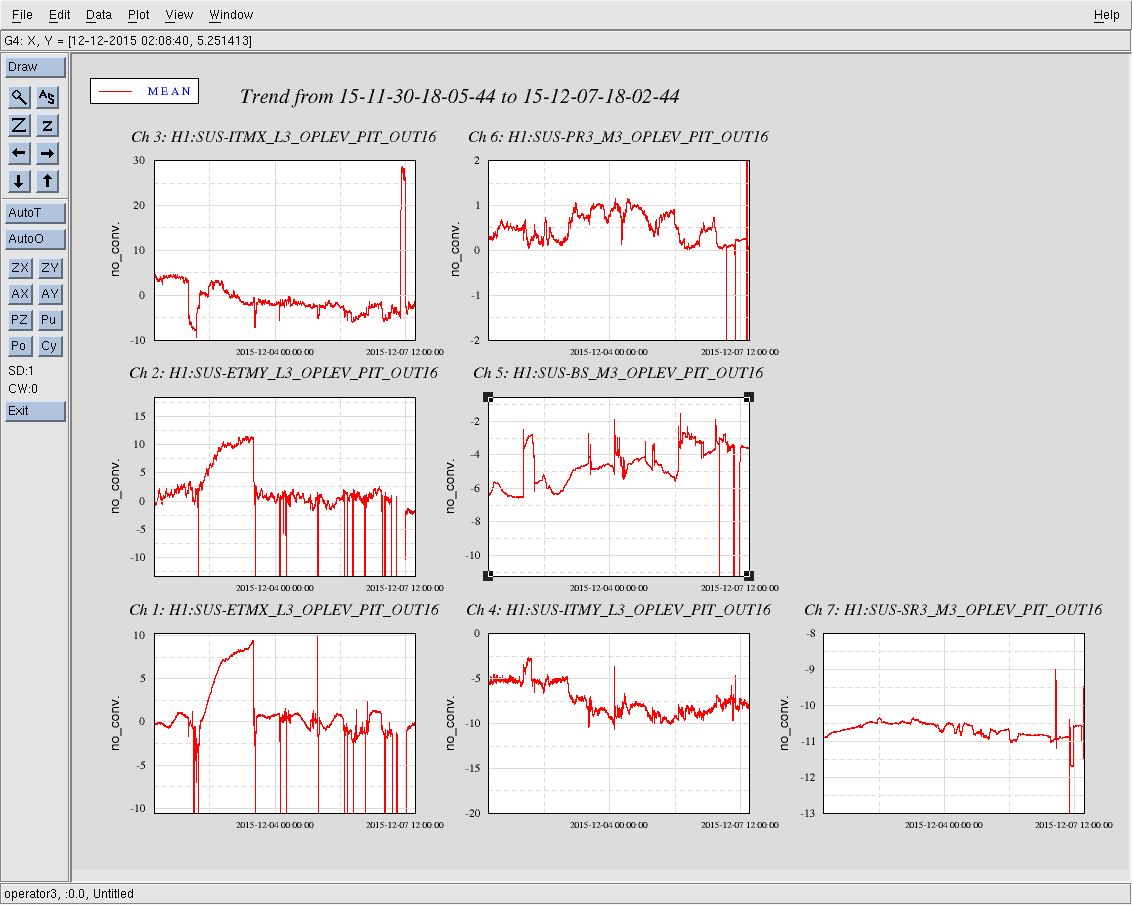
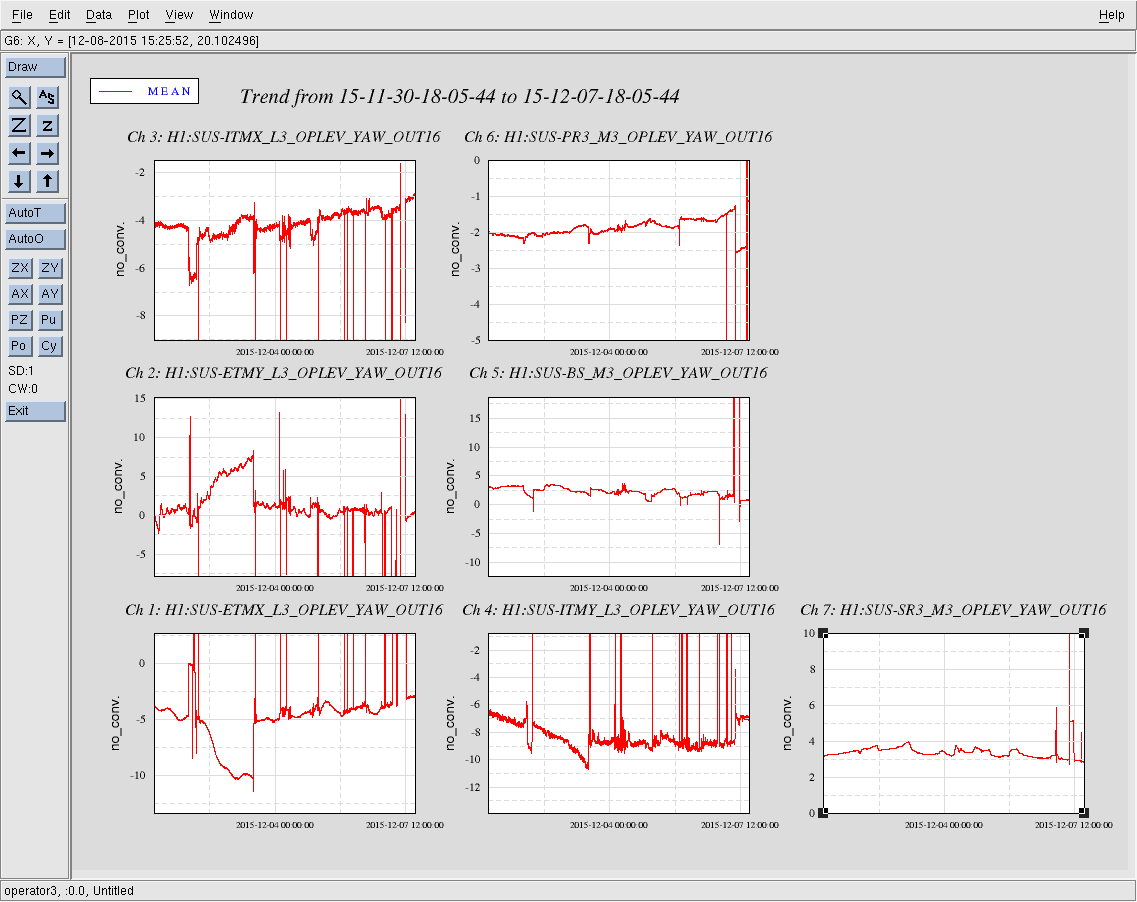
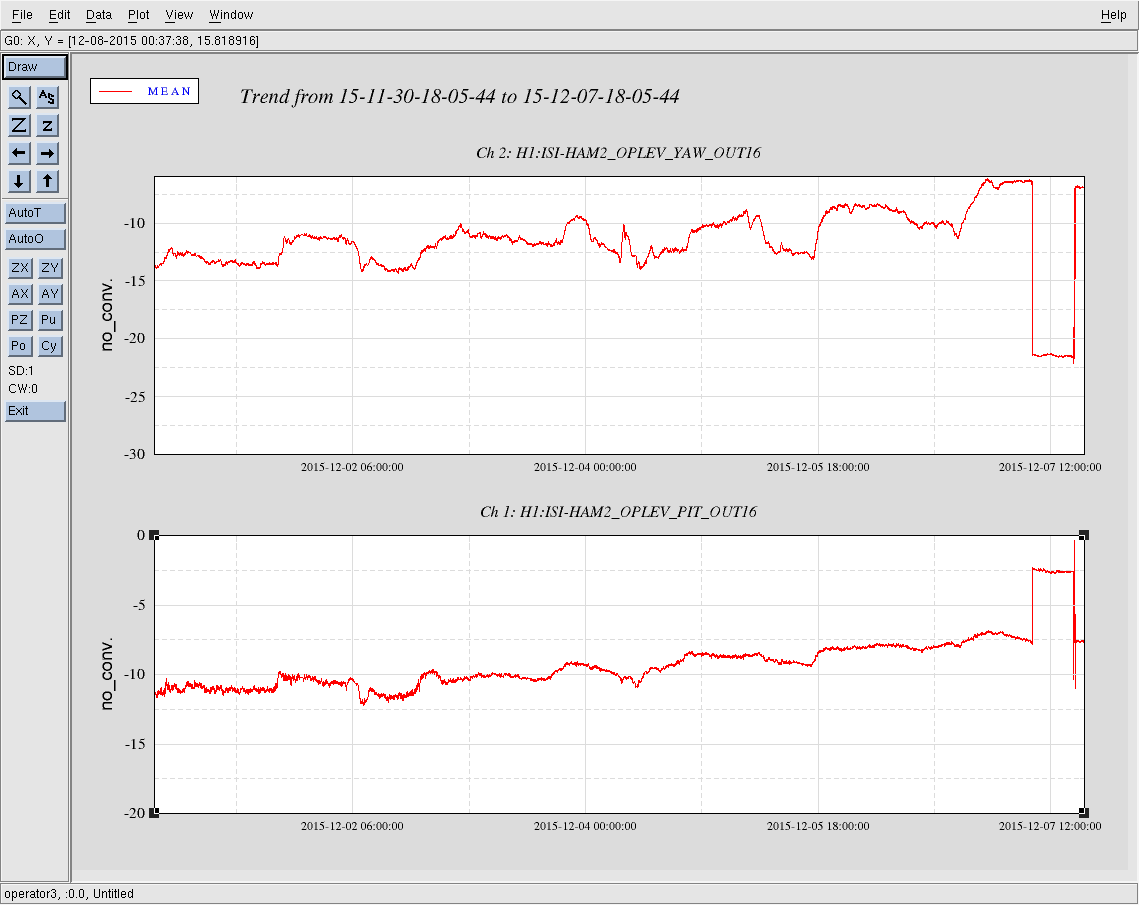
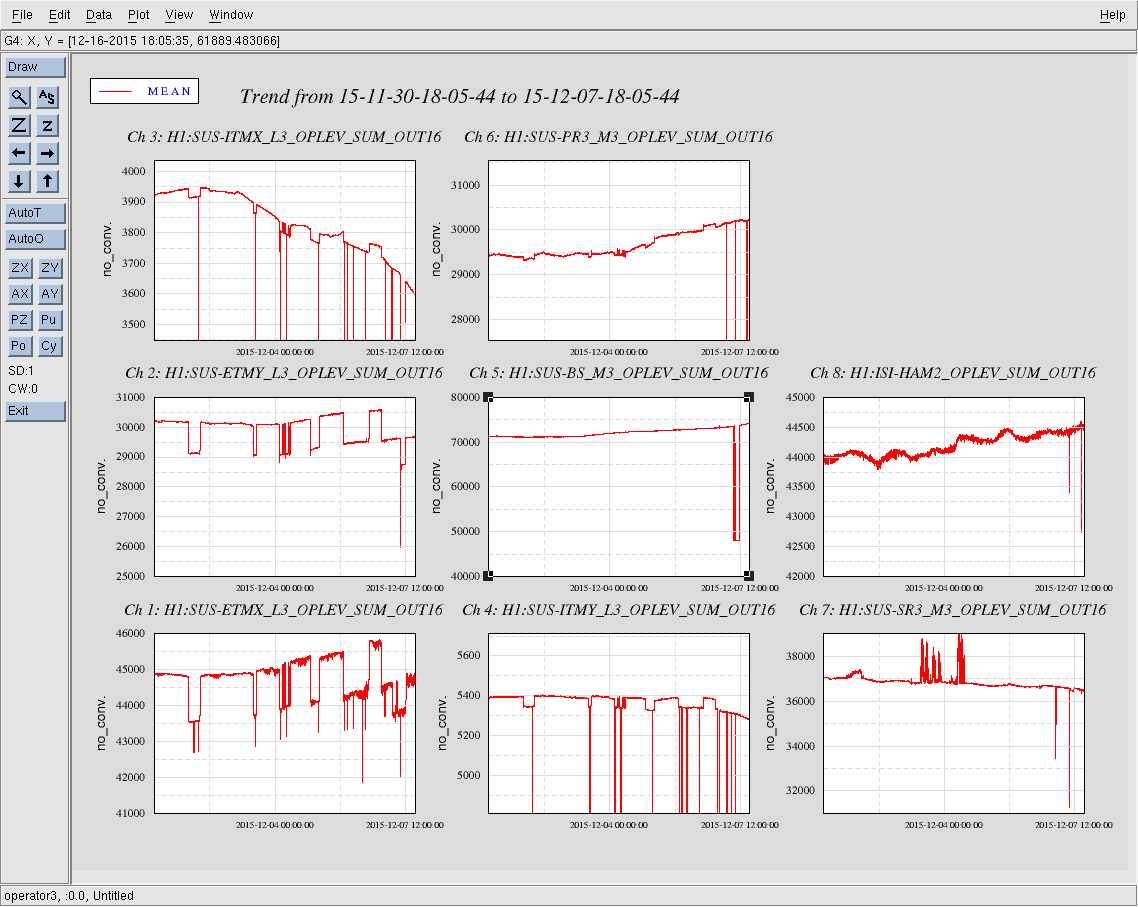
Attached are the oplev pitch, yaw, and sum trends for the last 7 days for all active H1 optical levers.