patrick.thomas@LIGO.ORG - posted 00:39, Monday 07 December 2015 - last comment - 01:09, Monday 07 December 2015(24002)
Ops Owl Beginning Shift Summary
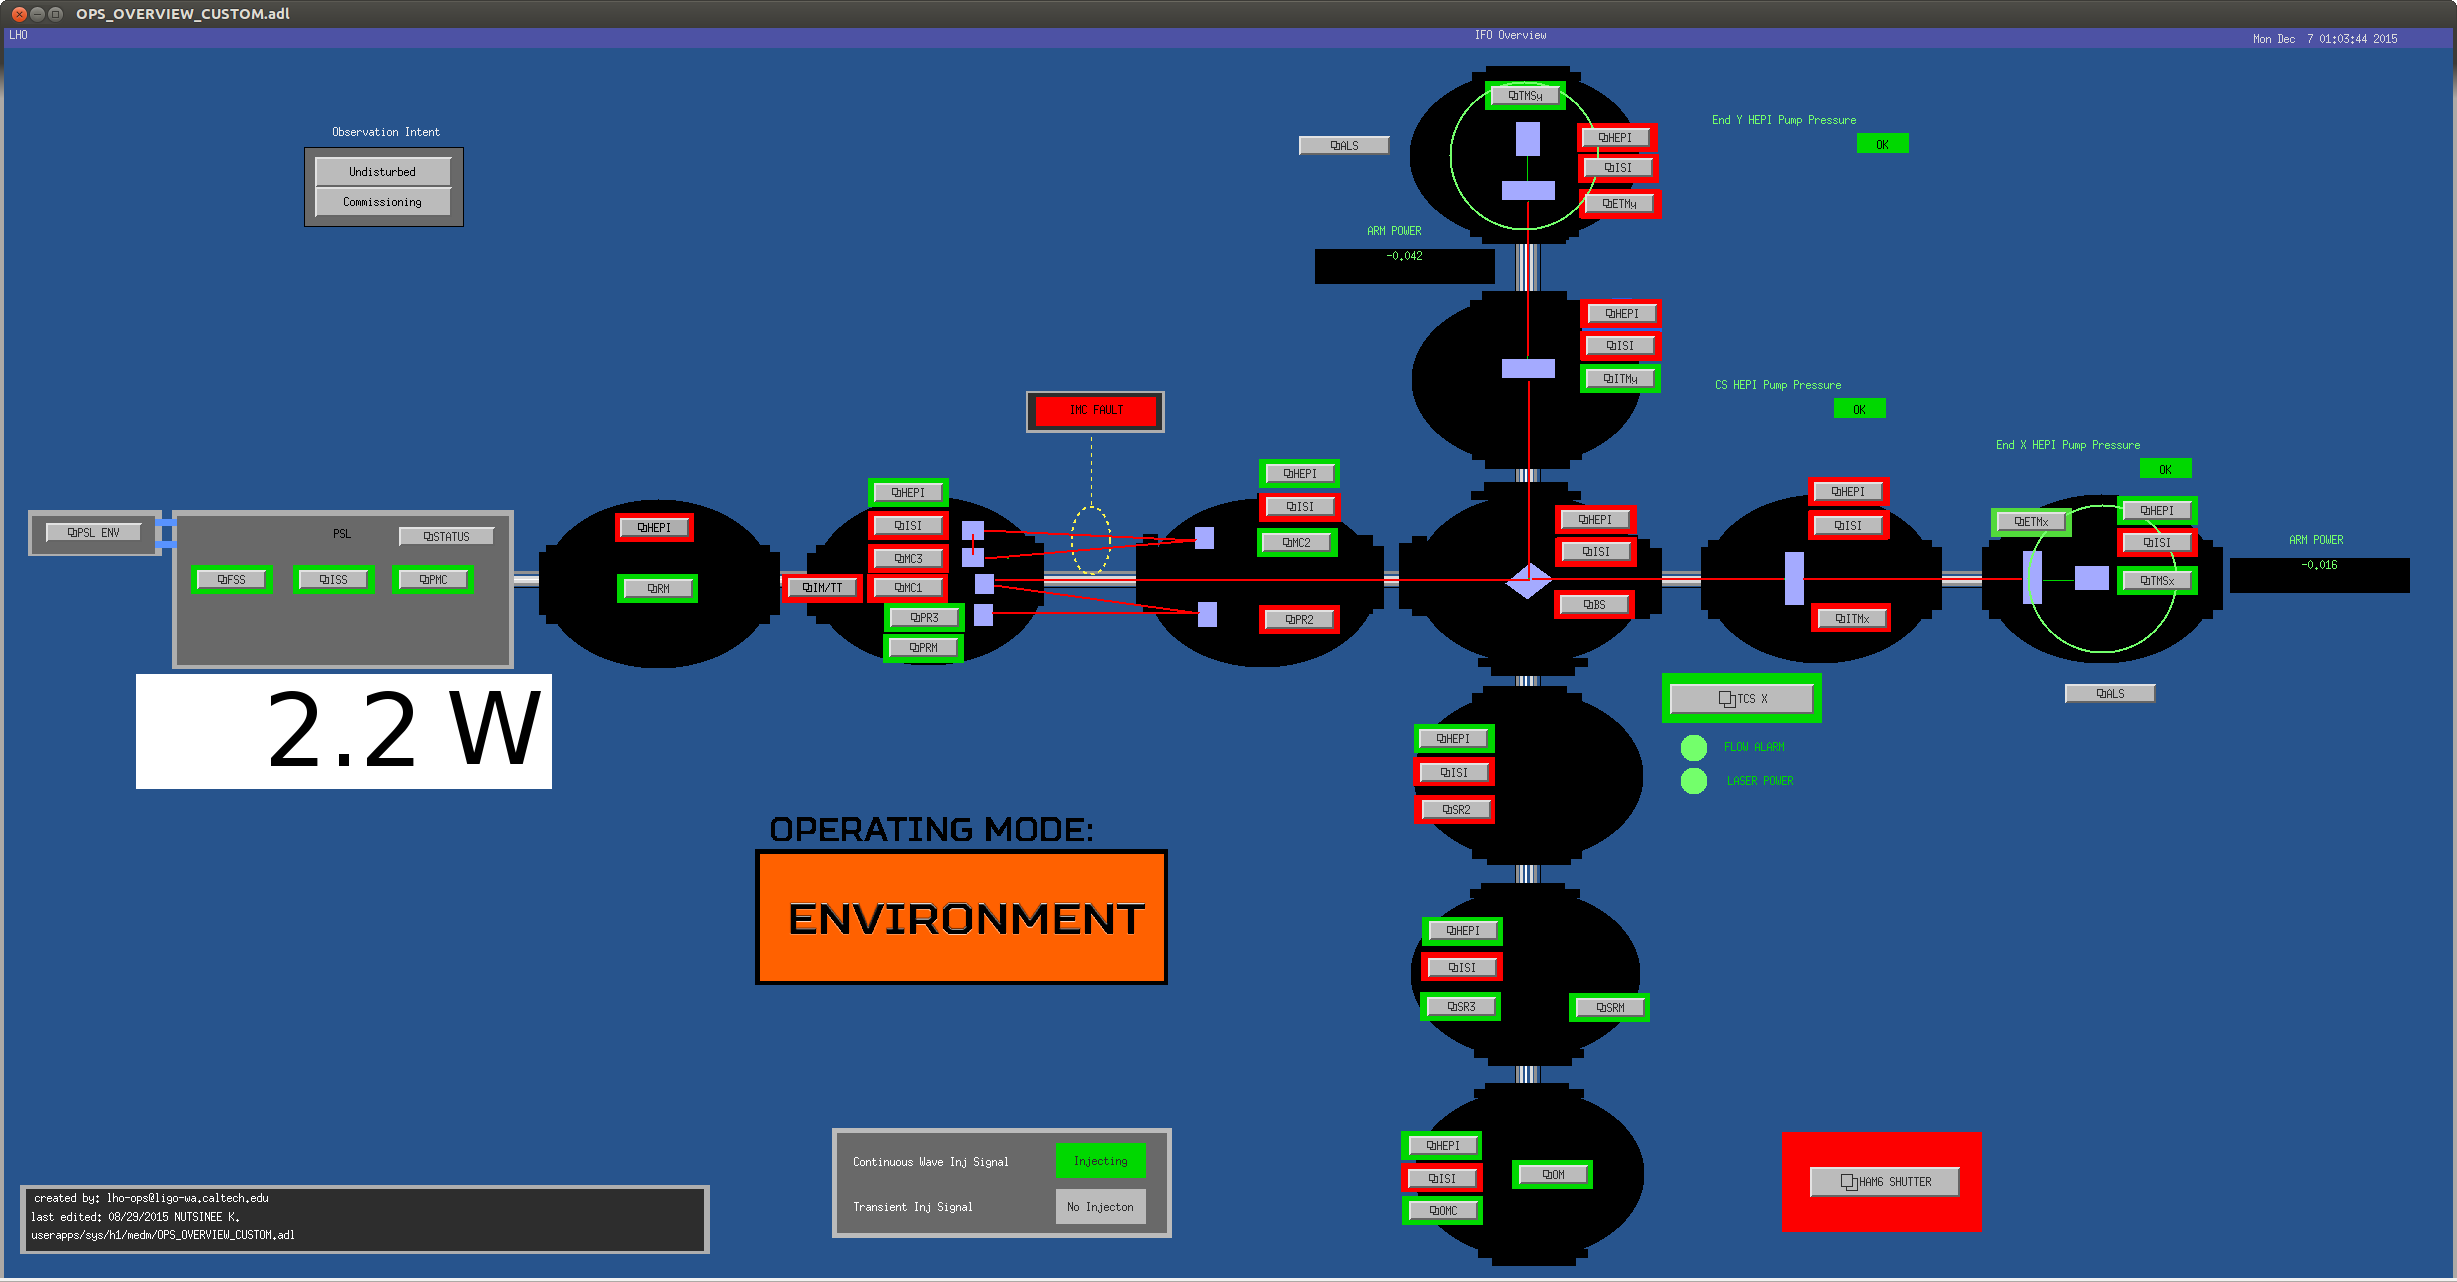
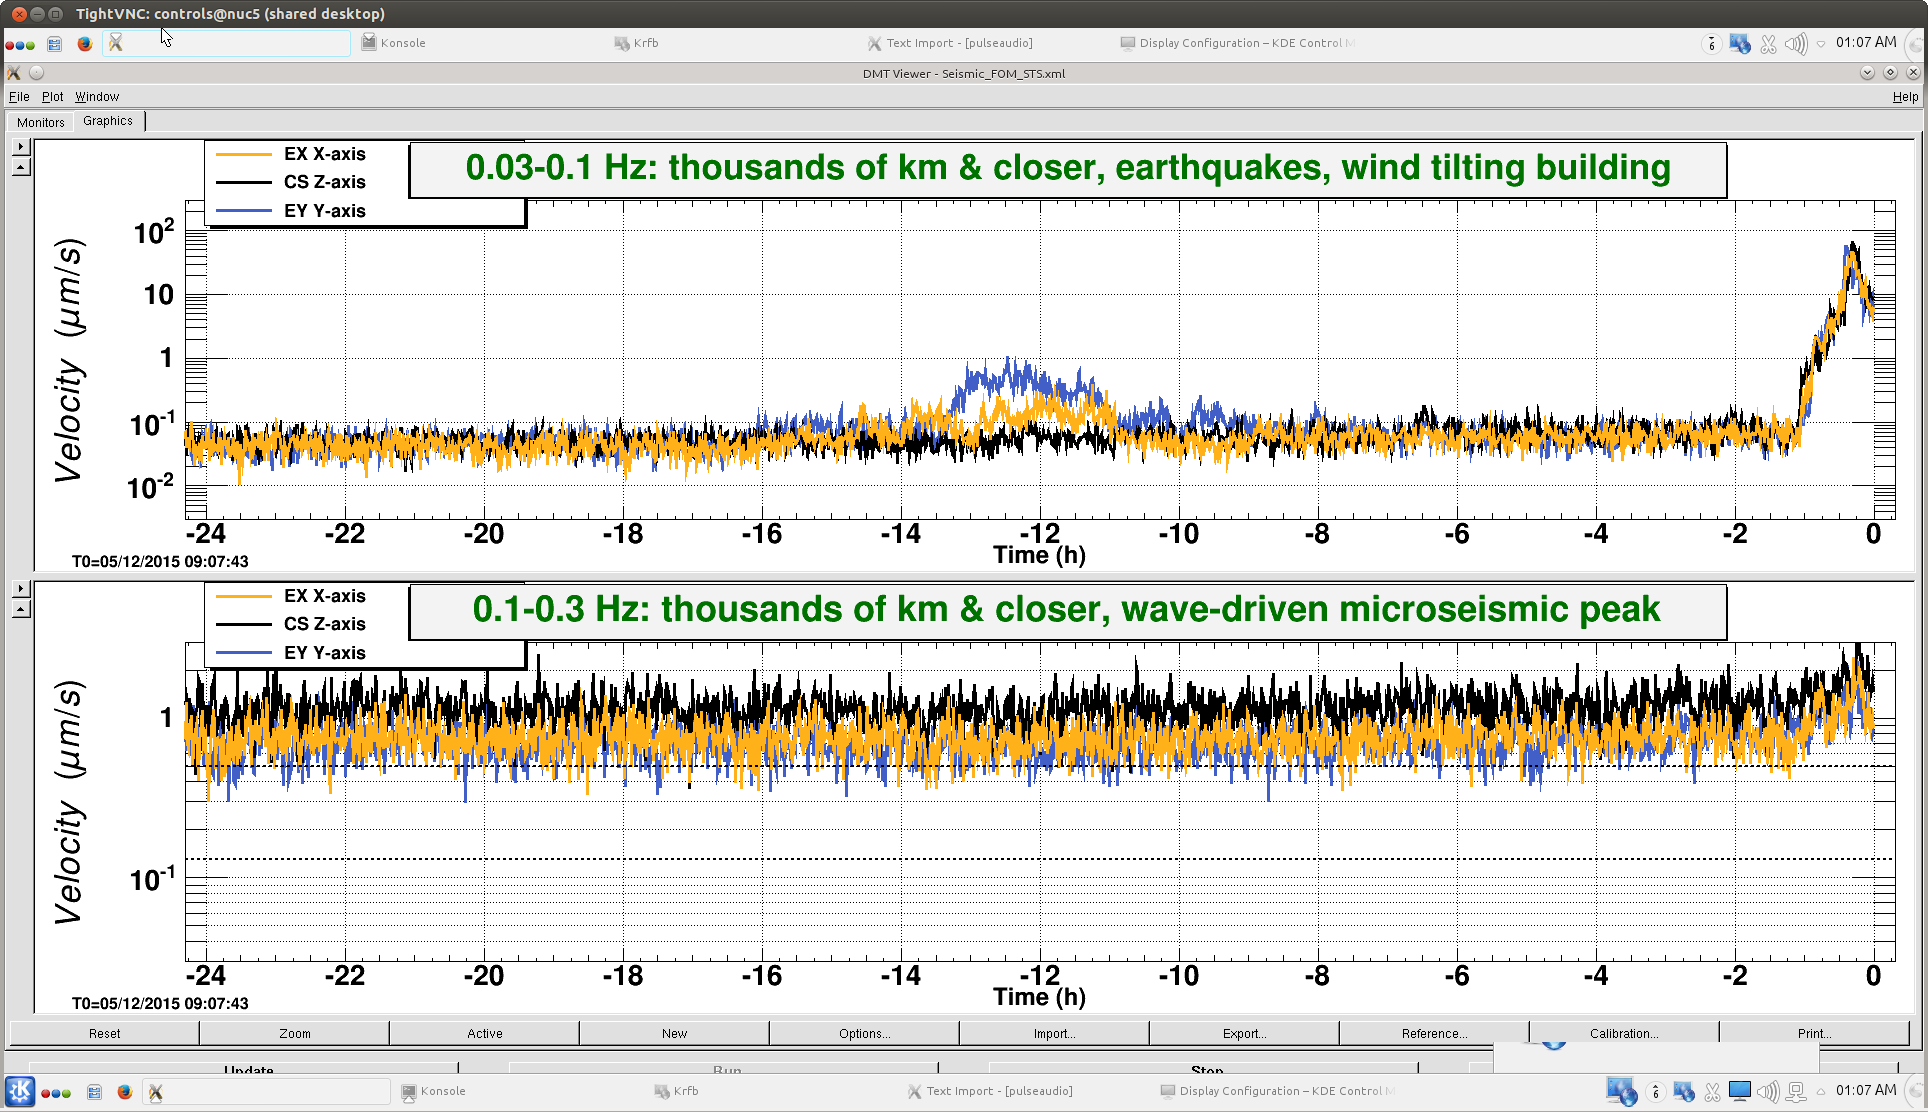
TITLE: 12/07 [OWL Shift]: 08:00-16:00 UTC (00:00-08:00 PDT), all times posted in UTC

STATE Of H1: Unlocked
OUTGOING OPERATOR: Cheryl
QUICK SUMMARY:

Cheryl has been having trouble locking MICH in initial alignment. Two earthquakes have just hit as I came on shift:

5.6
34km NW of Illapel, Chile
2015-12-07 07:51:11 UTC 48.4 km deep

7.2
109km W of Murghob, Tajikistan
2015-12-07 07:50:07 UTC 28.7 km deep

A number of watchdogs have begun to trip.

From the cameras:
The lights are off in the LVEA.
The lights are off in the PSL enclosure.
I can not tell if the lights are on or off at mid X and mid Y.
The lights are off at end X.
The lights are off at end Y.

The 0.03 - 0.1 Hz (earthquake) seismic band has so far risen to ~ 5 um/s with the earthquakes.
The 0.1 - 0.3 Hz (microseism) seismic band is above the 90 percentile and has risen above .5 um/s with the earthquakes.

The winds are between 0 and 20 mph.

The ISI blends are on the nominal 45 mHz configuration.

From pinging:
CDS WAP is off at the LVEA.
CDS WAP is on at mid X.
CDS WAP is on at mid Y.
CDS WAP is off at end X.
CDS WAP is off at end Y.
Comments related to this report
Images attached to this comment