In my previous entry 23283 I only reported results for 3rd and 4th harmonic because for the 21 hours of data analysed there the damping filters of the fundamental and second harmonics for the test masses were activated.
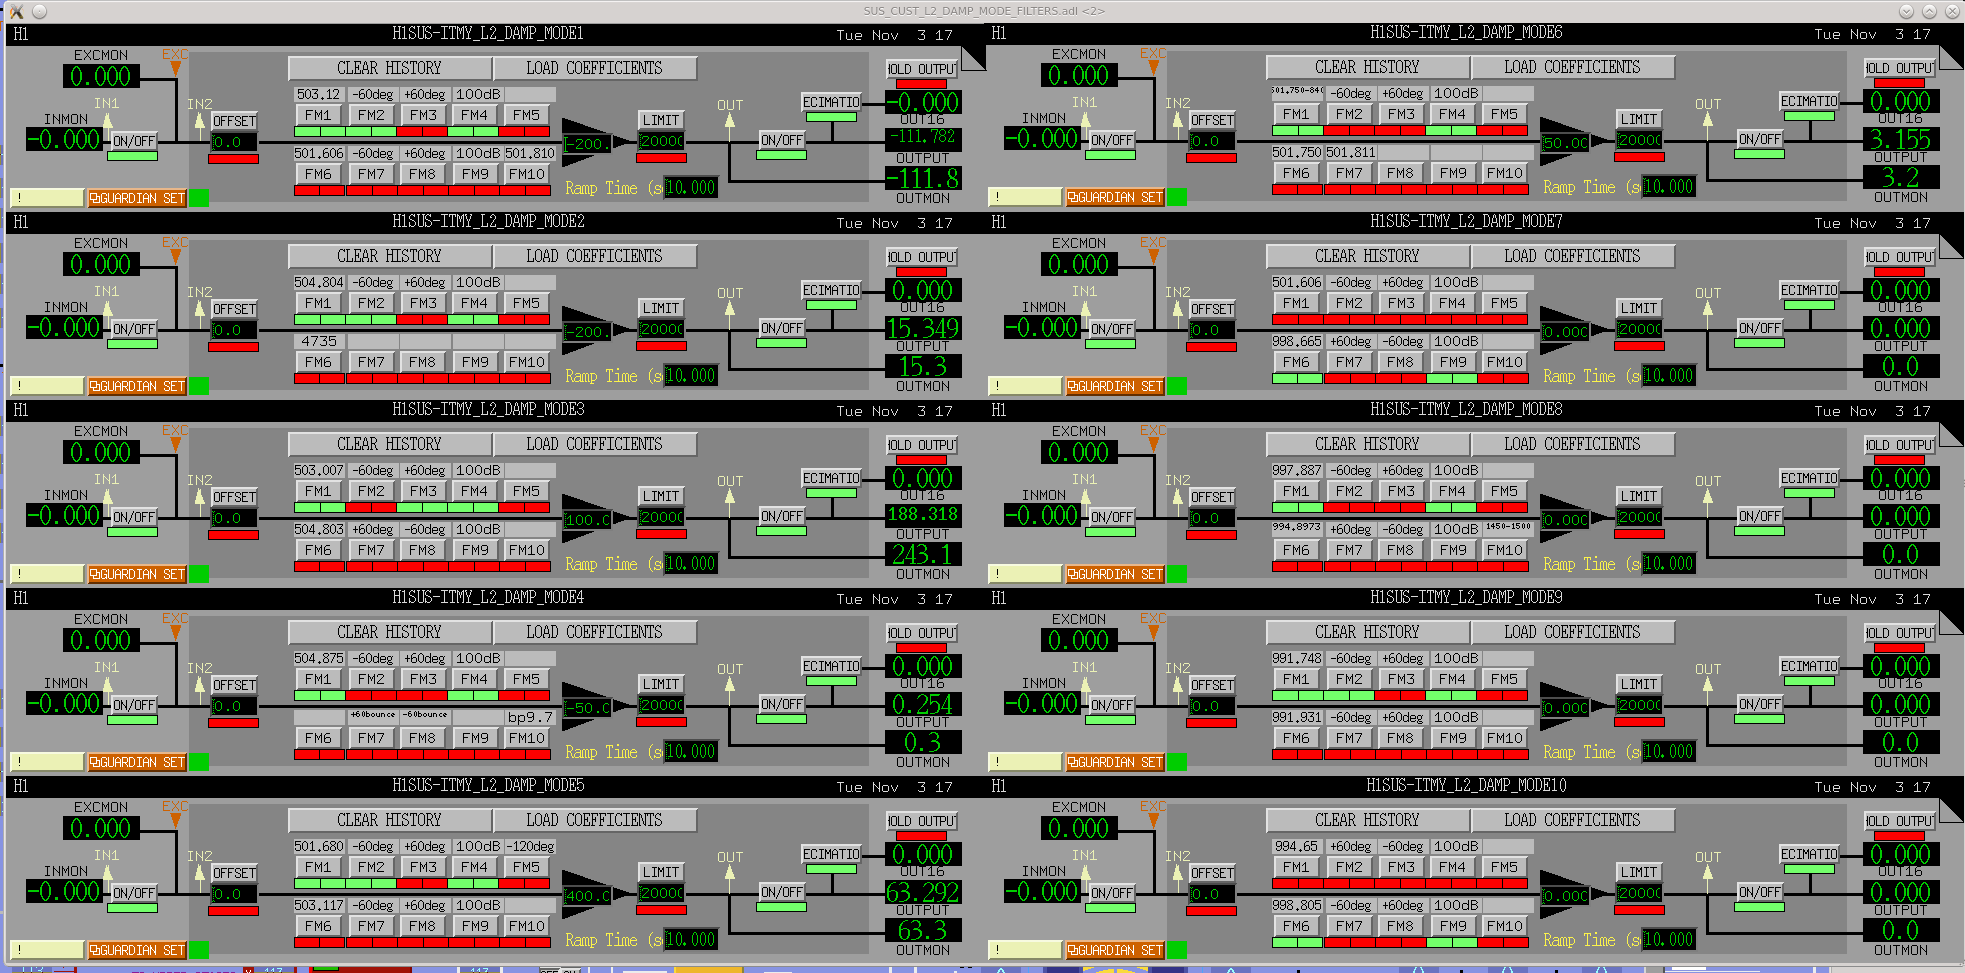
As described in 23085 on 2015-11-04 we were allowed to turn off the damping filters for the fundamental and 2nd harmonics of ITMX and ITMY and we managed to get a 10 hours continuois lock of the detector. This happened from (UTC) 2015-11-04 06:35:00 to (UTC) 2015-11-04 16:15:00. (See attached plots of the damping filter GAINs nulling during the interval of interest and a detector state graph showing lock during the time of interest).
I looked at channel H1:OMC-DCPD_SUM_OUT_DQ downsampled to 8192Hz in order to be able to handle the considerable amount of data.
The attached spectrum of the 10 hours of data on a 0.5mHz resolution and 33 averages identifies (in red) the dominant peaks at the fundamental violin mode frequencies corresponding to the violin modes previously assigned to ITMX and ITMY (as per 17610).
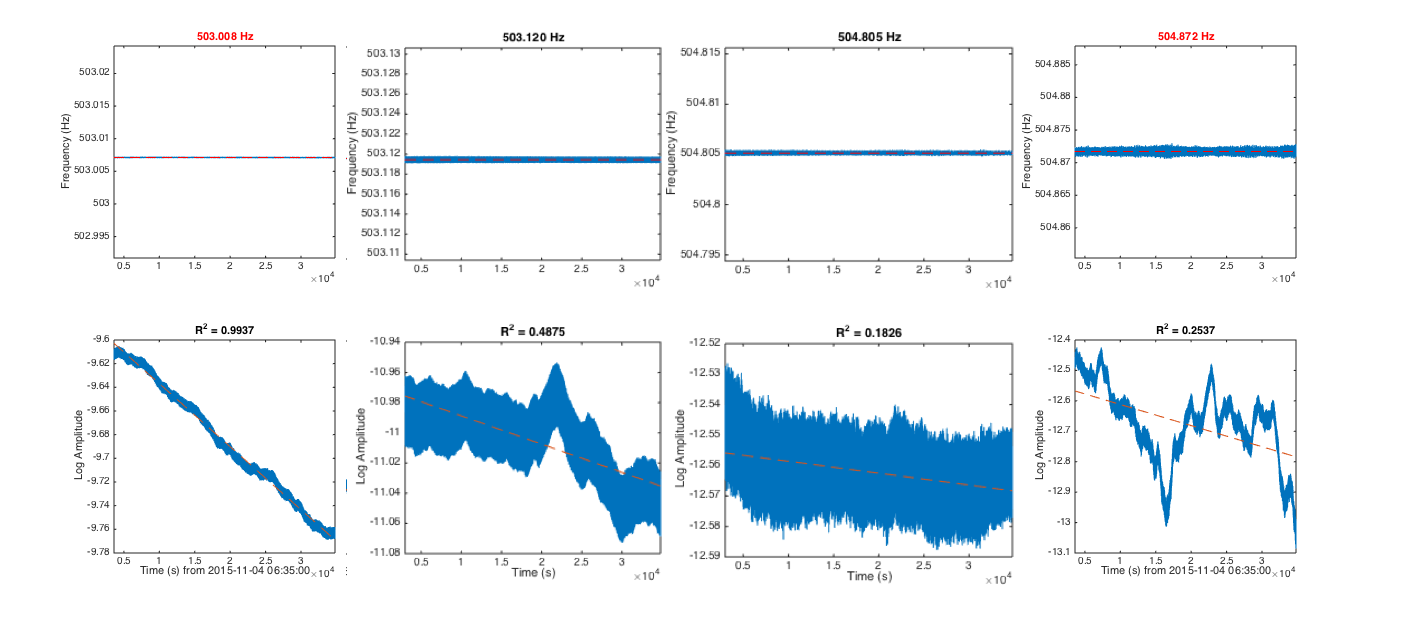
Like in 23283 I used a line tracker (iWave) to track the frequency and amplitude of each fundamental mode of the violin modes of ITMX and ITMY. Attached are the summary plots for the locked modes at the top is the frequency as a function of time and at the bottom is the Log of the amplitude as a function of time. A first order polynomial is fitted to Log(Amp) in order to obtain the Q of that mode.
Looking at the iWave plot results we observe that very few modes show a clear ringdown (these are highlighted in bold on the table below), also some modes show actually an amplitude increase:
Frequency Q Delta_Q
1.0e+09 *
0.000000500053540 0 0
0.000000500211188 0 0
0.000000501090622 1.099263893173578 0.001406678163595
0.000000501206991 0.387149689289317 0.000525686495200
0.000000501255024 0 0
0.000000501451642 0.836253670431456 0.000578382636001
0.000000501607755 0 0
0.000000501684000 0 0
0.000000501748284 0 0
0.000000501811170 0.672273711595517 0.000373649058032
0.000000502622036 0 0
0.000000502745387 0.287935668815574 0.000095512884649
0.000000503007120 0.296739931868312 0.000046580713516
0.000000503119439 0 0
0.000000504805141 0 0
0.000000504871717 0 0
NOTE: The Q of the trustworthiest ringdowns in this analysis are between 0.3 and 0.8 e9, in comparison with the 3rd and 4th harmonic measurements in 23283 which range 0.6 and 1.5 e9.