thomas.shaffer@LIGO.ORG - posted 16:18, Friday 13 November 2015 (23378)
Ops Day Shift Summary
-
TITLE: 11/13 DAY Shift: 16:00-00:00UTC (08:00-16:00 PDT), all times posted in UTC"
-
STATE Of H1: Down due to high wind, high useism, earthquake
-
SHIFT SUMMARY: Down the whole time, the winds and seismic activity keeping us down
-
INCOMING OPERATOR: Corey
-
ACTIVITY LOG:
- 16:36 Gerardo, Jodi - To H2 enclosure
- 17:05 Chris - to Xarm
- 17:18 Gerardo, Jodi - back
- 19:24 Chris - To Xarm again
- 19:35 Peter King - to PSL Diode room to find part
- 19:45 Peter - out
- 20:10 Jodi - To Optics lab
- 21:20 Jodi - Out
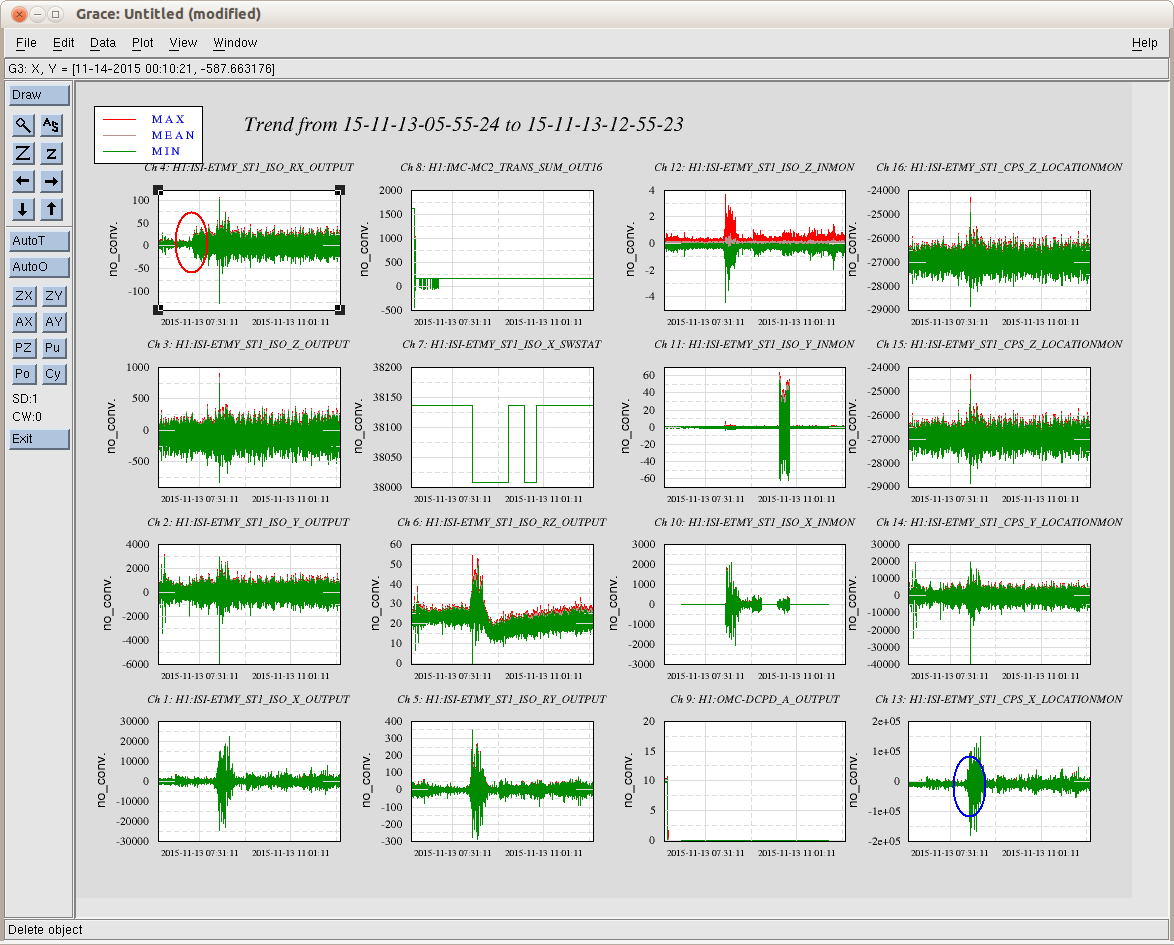
- 21:41 WDs tripped: IMs, PR3, MC3, MC1, ITMX ISI. Jim was changing sensor correction.
- 21:52 Dave - To CER
- 23:10 Nutsine - To LVEA for HWS alignment.
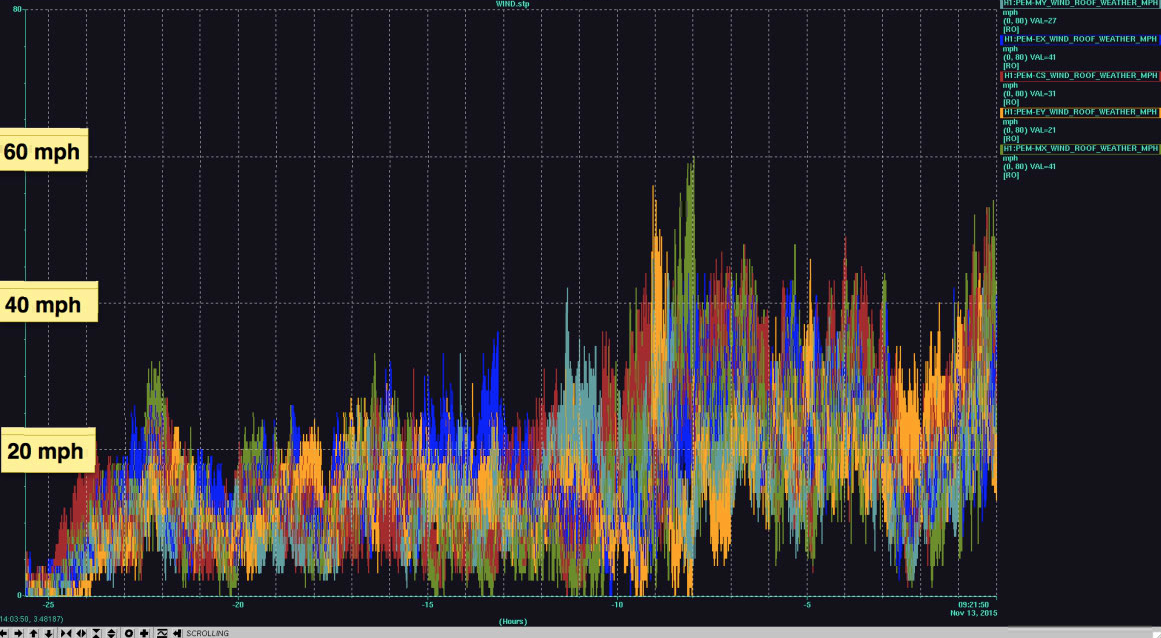


Now we are getting gusts into the 60's. I even saw one 70mph gust.