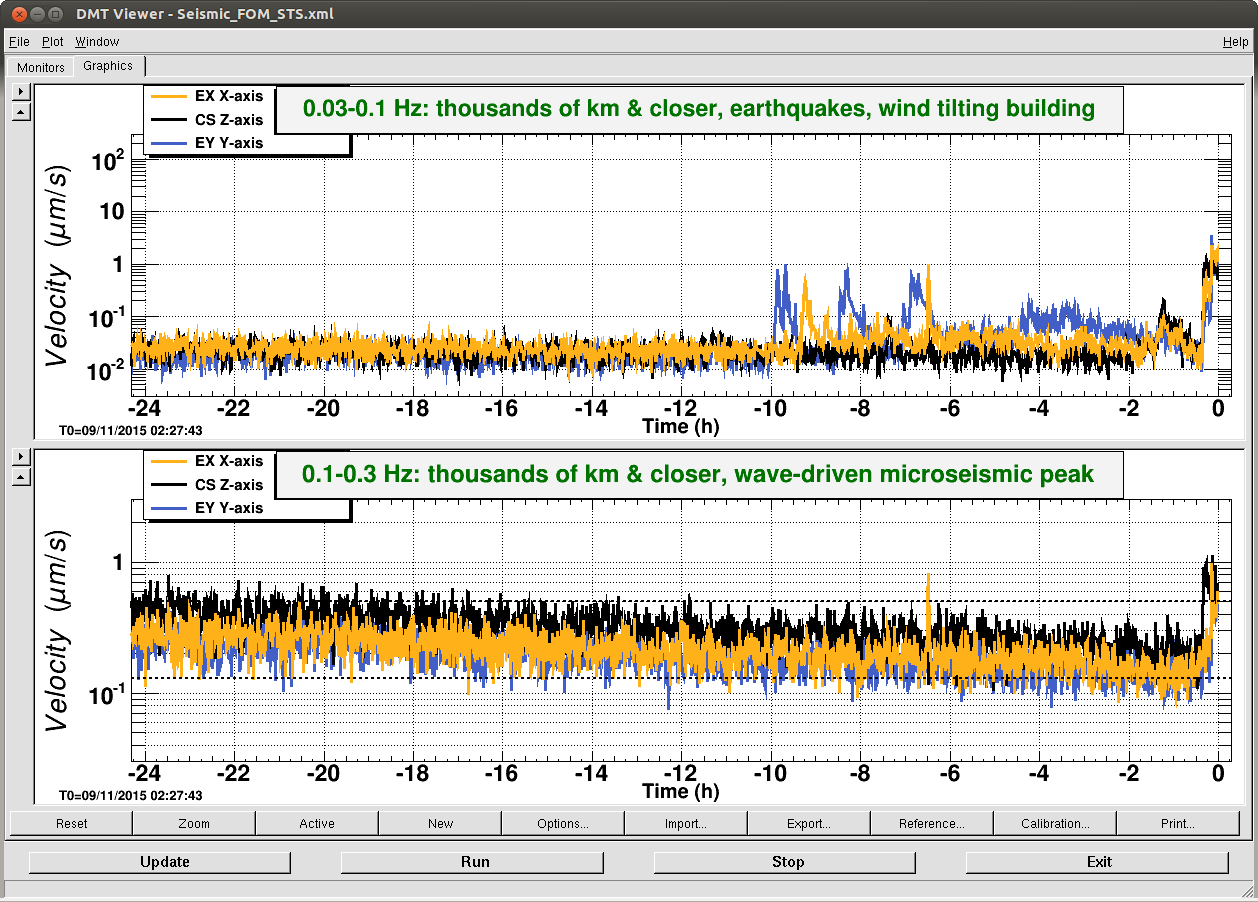
Laser Status: SysStat is good Front End power is 32.8W (should be around 30 W) FRONTEND WATCH is GREEN HPO WATCH is RED PMC: It has been locked 13 day, 21 hr 9 minutes (should be days/weeks) Reflected power is 2.5 Watts and Power in Transmission= 22.6 Watts. (Reflected Power should be <= 10% of Power in Transmission) FSS: It has been locked for 17 h and 34 min (should be days/weeks) TPD[V] = .98V (min 0.9V) ISS: The diffracted power is around 6% (should be 5-9%) Last saturation event was 2 h and 28 minutes ago (should be days/weeks) NOTES: FSS TPD V is due for a tweaking.
This is Hannah Fair.
I’ve been investigating the FF LSC locklosses from ER7. The following are my findings so far.
About half of the FF LSC locklosses had a 20-25 second oscillation in one of the PRM and SRM channels, and in the PRCL and SRCL channels (and occasionally MICH). The start of this oscillation ranged between around -2000 seconds to only -100 seconds before lockless. All of these ended with one of the channels saturating. This saturation appears to be the cause of loss. This pattern is independent of laser power.
1117665437.75 and 1117743020.38: The 20-25 second oscillation appears to be begin approximately 100 seconds before lockloss. In both cases, this ends with the saturation of PRM_UR
1117898344.25: The 20-25 sec oscillation begins around -85 seconds. SRM_M3_UL saturates
1117946874.25: The oscillation begins at least -500s. There also appears to be beat pattern. Each envelope is about 100s long. PRM_M3_UR saturates.
1118022123.88: The oscillation begins at least -500s. A beat pattern with an envelope about 200s long. ETMY_UL saturates.
1118088249.75: The oscillation appears to last for several hundred seconds, most evident in PRM and PRCL. Beat pattern has envelope of around 350 seconds. ETMY_UL saturates.
The following are locklosses where I also looked at OPLEV channels (Due to timing, I was unable to look at the data from the OPLEV channels for the locklosses before this):
1118207893.12: This was a short lock, so the ~25s oscillation seems to be present throughout. Looking through the OPLEVs, there was a very defined peak around -600s in BS_M3_PIT, ITMX/ITMY/ETMX/ETMY_L3_PIT. PR3_M3_PIT also has a continuous downward progression from lock to lockloss. ETMY_UL saturation causes lockloss.
1118213355.125: This is very similar to the previous lockloss. Short lock, about 1000s long. Same oscillation throughout. PR3_M3_PIT has continual decline, and very defined spike in same channels as before around -862 seconds. ETMY_UL saturation causes lockloss.
Some of these are less detailed/precise because of timing and my inability to access data more than two weeks old.
Examples of this pattern are attached as images.
The h1boot, cdsfs0, and cdsldap0 servers were rebooted this morning between 08:00 and 08:30 PDT. The h1boot was powered off, power cords removed for 30 seconds, then power reattached and powered up. No fsck was performed. The cdsfs0 computer was patched late yesterday afternoon, and was rebooted this morning. An fsck on the root file system was performed with no errors. The cdsldap0 computer was also rebooted, no fsck was performed.
Evan, Kiwamu, Jenne, Stefan - DRMI alignment is back to the old-good one: strategy: Used old slider values for everything but large optics. Tweaked SR3 (for instance) to get the beam spot centred on ASPD. Aligned PRX using PRM and PR2. - DRMI ASC worked except PRC2 loop (didn't further investigate because we didn't care without the arms) - Then we focused on MICH freeze: - We fine-tweaked the transfer function using a zpk([0.03],[0.054],1,"n")gain(0.555556) filter. - This made the gain roughly 1 below 0.1Hz. Plot 1 shows that - if measured coherently - we win up to a factor of 10 reduction at 0.01Hz. (Blue: no MICH freeze, red: MICH freeze) - In terms of RMS reduction (position) of the power spectrum, we gain a factor of 2, at the cost of significant noise injection at 8Hz. (Plot 2) Interestingly, this RMS is now small enough that we spend most of the time in about 1/3 for the whole simple Michelson fringe. Unfortunately there is still slow drift, so parking at a "good" position isn't quite possible. But we are definitely in a regime where simple "fringe velocity" isn't a good parameter by itself. Fringe position must matter too. In our brief attempt to see locking performance changes we didn't notice anything significant though. However, the next time we have high winds, we should definitely re-evaluate MICH freeze.
As was pointed out during the commissioning meeting, the labels in the attached pdf are reversed.
The ISS ref signal was changed from -2.01 V to -2.09 V which in turn changed the refracted power from 15% to about 5 %.
Leonid.Prokhorov, Jeffrey.Kissel Results of OPLEV charge measurements (June, 24 - July, 06): Charge at the ETMX and ETMY is less then +/-10V. ETMY seems slightly negatively charged (about -3..-5V). We haven't see charge growing or significant changing of charge at ETMs over this time. Plots in attachment: a) ETMX, ETMY - all measured charge data points (include today's measurements) b) ETMX, ETMY mean value of charge for each the day and it's standard deviation + and weighted mean and weighted variance of measured charge for each day.
Sheila, Evan
The in-vac REFL9 phase shifter is now controllable from the control room.
The REFLAIR9 phase shifter already had a dsub cable running to the Beckhoff concentrator (cable 68, running into concentrator 3), but the REFL9 shifter did not. So we moved this cable over so that it controls the REFL9 shifter. We also moved the cable over by one slot on the concentrator. We flipped control of the REFL9 shifter from internal to external, and then moved the digital delay slider to match the delay given by the toggle switches (23.4 ns). So the LSC-REFL_A_RF9_PHASE channels now control the delay.
Then we locked PRX, drove a line in the PRM, and then verified that the delay shifting works from the control room.
The variable pitch actuators on all of the supply fans in each of the out buildings were exercised this afternoon. S.F. 01 at Mid X and S.F. 02 at Mid Y were found to be faulty. We are only operating 1 fan at each mid station so these can be repaired with no impact to the cooling of the buildings. I will look into ordering parts tomorrow.
~0930 hrs. local -> Valved-in HAM6 ion pump -> Experimented with MidiVac vs. LPC controllers -> Leaving on LPC for now -> Will valve-out HAM6 turbo tomorrow
The vacuum gauges for the NEG pumps were added to the EtherCAT system. They are now available in EPICS (but not dataviewer until tomorrows DAQ reboot).
All times in UTC.
15:00 Morning Checklist:
15:45 Leo doing Charge measurements
15:57 Kyle out to HAM6 to disconnect uneccesary equipment.
16:26 Sudarshan out to LVEA to set up ISS second loop measurement. (called back due to Jim taking measurements on IMCs
16:33 Fil to EX to take meauerements for P-Cal cables.
16:50 ITMY RMS watchdog tripped. Reset.
16:53 Kyle back from HAM6
17:00 - 18:00 Luca's training class
18:15 Sudarsh and Kiwamu out to LVEA to set up ISS Second loop measurements
19:24 Leo finished doing charge measurements.
20:00-21:00 Luca's training class
20:36 Bubba and John to both end station mechanical rooms
21:21 Jordan and Katie to EX. PEM Install and Calibration.
22:30 Sudarsh and Kiwamu into LVEA.
It appears that this tripped at ~ 10:15PDT on July 3?
For the record, this is the L2/PUM analog coil driver RMS watchdog.
In this analysis we used 1 minute FFTs of H1:LSC-DARM_IN1_DQ for derr.
Channels H1:CAL-PCALX_TX_PD_OUT_DQ, H1:CAL-PCALY_TX_PD_OUT_DQ and calibration factors from DCC T1500283 were used to calculate Xpcal.
The time delay of 125 us between Pcal and DARM signals (see LHO aLOG 19186) should cause phase delay of high frequency lines of about 24.3 degrees, but not over 140 degrees as we saw in our analysis. The question, why phases of high frequency lines are rotated by 140 degrees compared to phases of low frequency lines, needs to be studied.
Changes in actuation function, A, can confuse results produces by this method. This issue can be avoided by applying a time dependent A in calculation of Cifo.
An estimation of how much changes in CC pole frequency can increase uncertainty in calculation of external length strain need to be studied.
We plan to repeat this analysis with LLO data.
Picking up where Arnaud left off nearly 2 weeks ago, alog 19208 post vent, I am looking at the health of the TMSX suspension. Basically, we reinvented what he stated - the TMSX LF and RT BOSEMs are less sensitive than they were "before". The TFs show a DC offset from the Model and the TFs taken a year ago. We're not sure why this is - Kiwamu suggests that a change in the stiffness of the suspension made during the June cable strain relieving likely would have caused the resonance peaks to shift as well as the DC offset... We don't think this DC shift is too serious - the loop gain in V and P need to be retuned.
I can drive the TMSX with PIT alignment bias and see the Left and Right (suspect) BOSEMs respond, so they are not "out of range" and are actuating.
I reran the TMSX TFS for PIT and VERT - Both look healthy to me, so whatever bad measurement was posted in the middle of the 19208 alog is still gone.
I agree with Betsy -- a change in stiffness would only affect the magnitude of the transfer function at low-frequencies. An overall scale factor discrepancy like what is shown here is typically a problem with an electronics gain being different (say, if a satellite pre-amp's circuits have much less gain than before), or an incorrect digital gain (say, if the EUL2OSEM / OSEM2EUL matrices were systematically incorrect). It might be that the diodes have a new, worse, open light current, and what is being used for digital compensation / normalization is now in correct. It would be difficult to believe / quite the coincidence that would a problem from *both* LF and RT at the same time. Recall that this is FRS Ticket #3246. ------ For reference, I also quote Keita who had replied on this over a small-email-list: "" Seems like TMSX RT and LF are bigger than before by maybe 5000 counts or so, which I didn't catch when we came out of chamber. We added small masses (strain relief parts) to TMS, so this makes sense qualitatively. These numbers were already big-ish before vent in a retrospect, and RT is now about 4000 counts away from the open value which is supposed to be -2*H1:SUS-TMSX_M1_OSEMINF_RT_OFFSET~26000 cts. No idea if 4000 counts is too small a margine there, nor if the BOSEM height is the cause of the poor measurement results. Anyway, my questions are, 1. Were the suspension bias sliders on or off during the measurement? If not, measure with nominal offset even though we don't know the right alignment for now. 2. Is the S/N of the PIT sensing considerably smaller than before? If it is, TMS should be noisier than before due to noisier PIT damping, which in principle compromise ASC performance for ITMs (DSOFT, CSOFT). Regardless of the answers, my gut feeling is that it's possible to run H1 without fixing the BOSEM height for O1 (unless TMSX is shaking too much due to this and the IFO wouldn't lock). ""
The PIT and VERT TFs that I ran this morning were with the bias sliders enabled.
ISS Inner Loop has UGF of 22 KHz with a phase margin of about 50 degress. This was measured with variable gain set at 6 dB for the best phase margin. This is the normal operation settings for Inner Loop.
Outer Loop has a UGF of 1 KHz ( designed for 4 KHz) with a phase margin of about 30 degrees. The variable gain was set at 40 dB (max available) and an additional gain stage(?) was switched on as well.
Also tried moving the the Inner loop gain to see if it shows any improvement on the outer loop but no luck.
TF Plots are attached.
These transfer function measurements were taken at ~10 W of PSL power.
The data used for the plot above is attached.
Calibration Team
The gravitational wave strain h(t) is given by h(t) = Delta L/L where Delta L is is computed using
Delta L = ± (Lx - Ly)
The sign of Delta L can be determined using Pcal actuation on the test mass. Pcal only introduces a push force so pcal readout signal (truly pcal excitation) is minimum when the testmass is away from the corner station (closer to pcal laser). From the first plot the phase between DARM/PCAL is ~ -180 degrees (DARM lags PCAL) which suggests that DARM signal from ETMX will be maximum when pcal is minimum (ETMX further away from corner station). Similarly, from second plot, since DARM and PCAL have a phase difference of ~-360 degrees (essentially 0 degrees), the DARM signal from ETMY is minimum when the pcal is minimum. This shows that the sign convention for the Delta L is '+'
Also the slope of the curve gives the time delay between Pcal and DARM signal chain. The time delay is about 125±20 us. This time delay can be accounted for, within the uncertainity, from the difference in signal readout chain outlined in Figure 3 attached.
Refer to LLO alog #18406 for the detailed explanation behind this conclusion.
I believe this sign check and the sign check at LLO are correct. For the record, below is how I reached that conclusion: The photon calibrator laser can only push, but there is a nonzero baseline intensity and you modulate the intensity around that. The question is, if you apply a positive voltage to the PCAL system input, do you get more force or less force on the test mass? Figure 21 of the PCAL final design document seems to show that the undiffracted beam through the AOM is what is sent to the test mass, so increasing the amplitude of the 80 MHz drive to the AOM REDUCES the force on the test mass. However, the AOM driver electronics could introduce a sign flip when it conditions the input voltage. To check that, I pulled up PCAL excitation and receiver photodiode data (e.g. H1:CAL-PCALX_EXC_SUM_DQ and H1:CAL-PCALX_RX_PD_OUT_DQ) and plotted a short time interval at GPS 1117933216. I saw that the PCAL photodiode signal variations are basically in phase with the PCAL input excitation, with just a ~30-40 degree phase lag at ~500 Hz, presumably from filter delay. So, applying a positive voltage to the PCAL system input causes more force on the test mass, and anyway the PCAL receiver photodiode measures intensity directly. I confirmed this for all four PCALs (H1 and L1, X and Y) and also confirmed that the transmitter and receiver photodiodes vary together. The PCAL pushes on the front of the ETM, i.e. on the face that the primary interferometer beam reflects off of. This being a pendulum, the ETM is closest to the laser (i.e., the arm is shortest) when the force is at its MAXIMUM. LLO alog 18406 has a comment consistent with that: "Theory of pendulums suggests that Pcal signal will be minimum when ETM swings further away from corner station". LHO alog 19186, above, has a statement, "pcal readout signal (truly pcal excitation) is minimum when the testmass is away from the corner station (closer to pcal laser)", which is more ambiguous because the ETM being away from the corner station would put it FARTHER from the PCAL laser. But both draw the correct conclusion from the data: with the intended sign convention, DARM should be at its positive maximum when the X arm is longest (ETMX is farthest from the corner station; PCALX intensity is at its minimum) or when the Y arm is shortest (ETMY is closest to the corner station; PCALY intensity is at its maximum), and that is what was reported at both sites.
Peter,
I disagree with one assumption in your argument, but it does not disprove (or support) the rest of your conclusions.
"The question is, if you apply a positive voltage to the PCAL system input, do you get more force or less force on the test mass? Figure 21 of the PCAL final design document seems to show that the undiffracted beam through the AOM is what is sent to the test mass, so increasing the amplitude of the 80 MHz drive to the AOM REDUCES the force on the test mass. However, the AOM driver electronics could introduce a sign flip when it conditions the input voltage."
As far as I know there's no sign flip in AOM electronics. Undiffracted beam gets dumped in BD2, while diffracted beam is sent to the ETM.
Unfortunately I couldn't find an explicit noting of it in our recent DCC documents.
Oh, the diffracted beam gets sent to the test mass? Then I agree, there isn't a sign flip in the electronics. (In figure 21 in the document, it looks like the undiffracted beam went to the test mass.) BTW, I've posted a multi-frequency look at the hardware injection actuation sign (and amplitudes and time delays) at https://wiki.ligo.org/Main/HWInjER7CheckSGs.