Way back on September 5th, I collected OMC mode scan data before and after the power-up step from 2.2W to 22.5W. The idea was to measure the time-evolution of the sideband and higher-order-mode content at the AS port as the IFO thermalizes and the alignment adjusts to the hi-power state. During the mode scans, I followed Koji’s beacon demodulation technique, and used a DARM excitation to tag the carrier light resonant in the arms. This lets us disentangle the junk carrier light (resonant in the corner) from the good carrier light (resonant in the arms).
There’s quite a bit of information in these mode scans, but the major results are:
- After the power-up step, the amount of 9MHz light at the AS port more than doubles, with a time constant of about 6 minutes. I’m not sure how this informs the studies by Elli & Stefan and Paul regarding the AS36 WFS sensing. Does this time constant agree with thermal effects in the SRC? Or is it from slow alignment loops responding to something like wire heating?
- The contrast defect (ratio of carrier junk light to total available carrier light) is very small, less than 70ppm.
- The mode-matching of the carrier light resonant in the arms into the OMC is excellent, better than 99%.
- Unfortunately, these data don’t completely solve the mysteries of the HAM6 power budget. The 45MHz sidebands saturate the DCPDs at 22W with the preamps in the Hi-Z state, and this makes it impossible to measure the 45MHz sideband power at the AS port using mode scans. But, we can accurately measure the DCPD photocurrent from the carrier and 9MHz sidebands. Carrier = 33.6 +/- 0.4 mA, 9MHz SB = 34.9 +/- 0.3 mA.
Measurement Procedure
Here’s an outline of how the mode scan data were collected:
With the IFO locked on RF-DARM at 2.2W, unlock the OMC, turn off the OMC-LSC_SERVO output, turn off the OMC LSC dither. Turn off all stages of the the DCPD whitening (important).
Check that OMC ASC is on and using the QPDs. Zero the OMC PZT2 offset. Make sure the DARM boost (FM1) is on (important).
Set the DARM offset to 1.2e-5 counts in the LSC-DARM filter bank (this should be about 16pm).
Use AWG to set up an excitation on OMC-PZT2, I used a 70V ramp, 70 second period. Use AWG to set up an excitation on DARM for the beacon scan, I used 1e-8 counts at 201.7 Hz.
I collected ten minutes of data at low power, then engaged the power-up step in the Guardian. After power-up I collected about an hour of data. The GPS times of the data are:
Lo-power start: 1 125 478 482

	Lo-power stop:  1 125 478 992


	Hi-power start: 1 125 479 058

	Hi-power stop:  1 125 482 221
Mode Fitting
For each span of data, the analysis code looks at PZT2_MON_DC and finds times when the PZT drive was slowly increasing. During these periods it grabs the DCPD_SUM data and fits the modes, using the measured transverse mode spacing of the OMC and the known sideband frequencies. I use the measured FSR and f_HOM from Koji’s lab measurements of the H1 OMC:
FSR = 261.72 MHz

	f_HOM = 0.21946*FSR
The peaks are fit using the usual Lorentzian function of the PZT voltage. It would be better to do this as a function of optical frequency, but the PZT nonlinearity is small enough that I’ve ignored it. Anyways there's a chicken-and-egg problem, you have to fit the PZT voltage before you can convert voltage to optical frequency.
Problem: 45MHz sideband saturation
At 2.2W, the 45MHz sideband peaks generate about 16mA of photocurrent in DCPD_SUM. In the Hi-Z state, the DCPDs saturate at 20mA (the precise value varies slightly depending on the preamp electronics, these values have been recorded in, for example, the DCPD filter banks). At 22W we expect 160mA in each 45MHz peak, so these saturate the DCPDs.
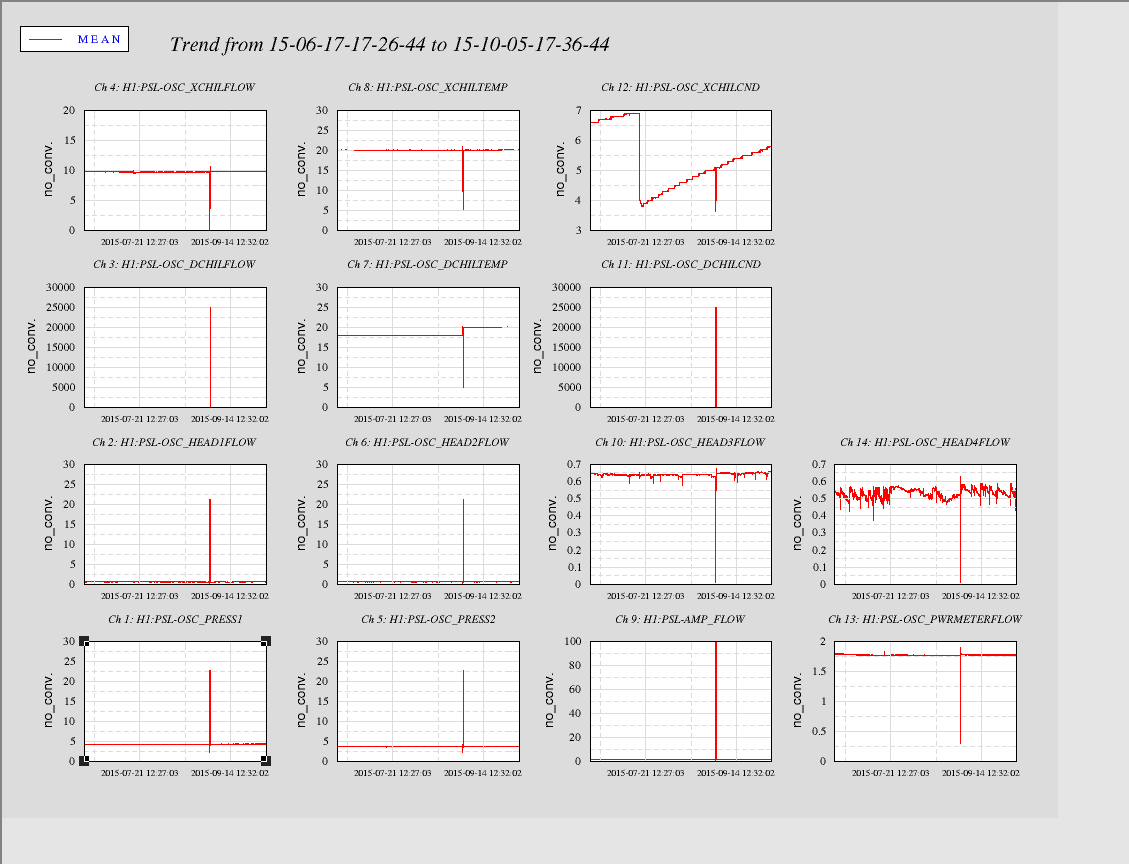
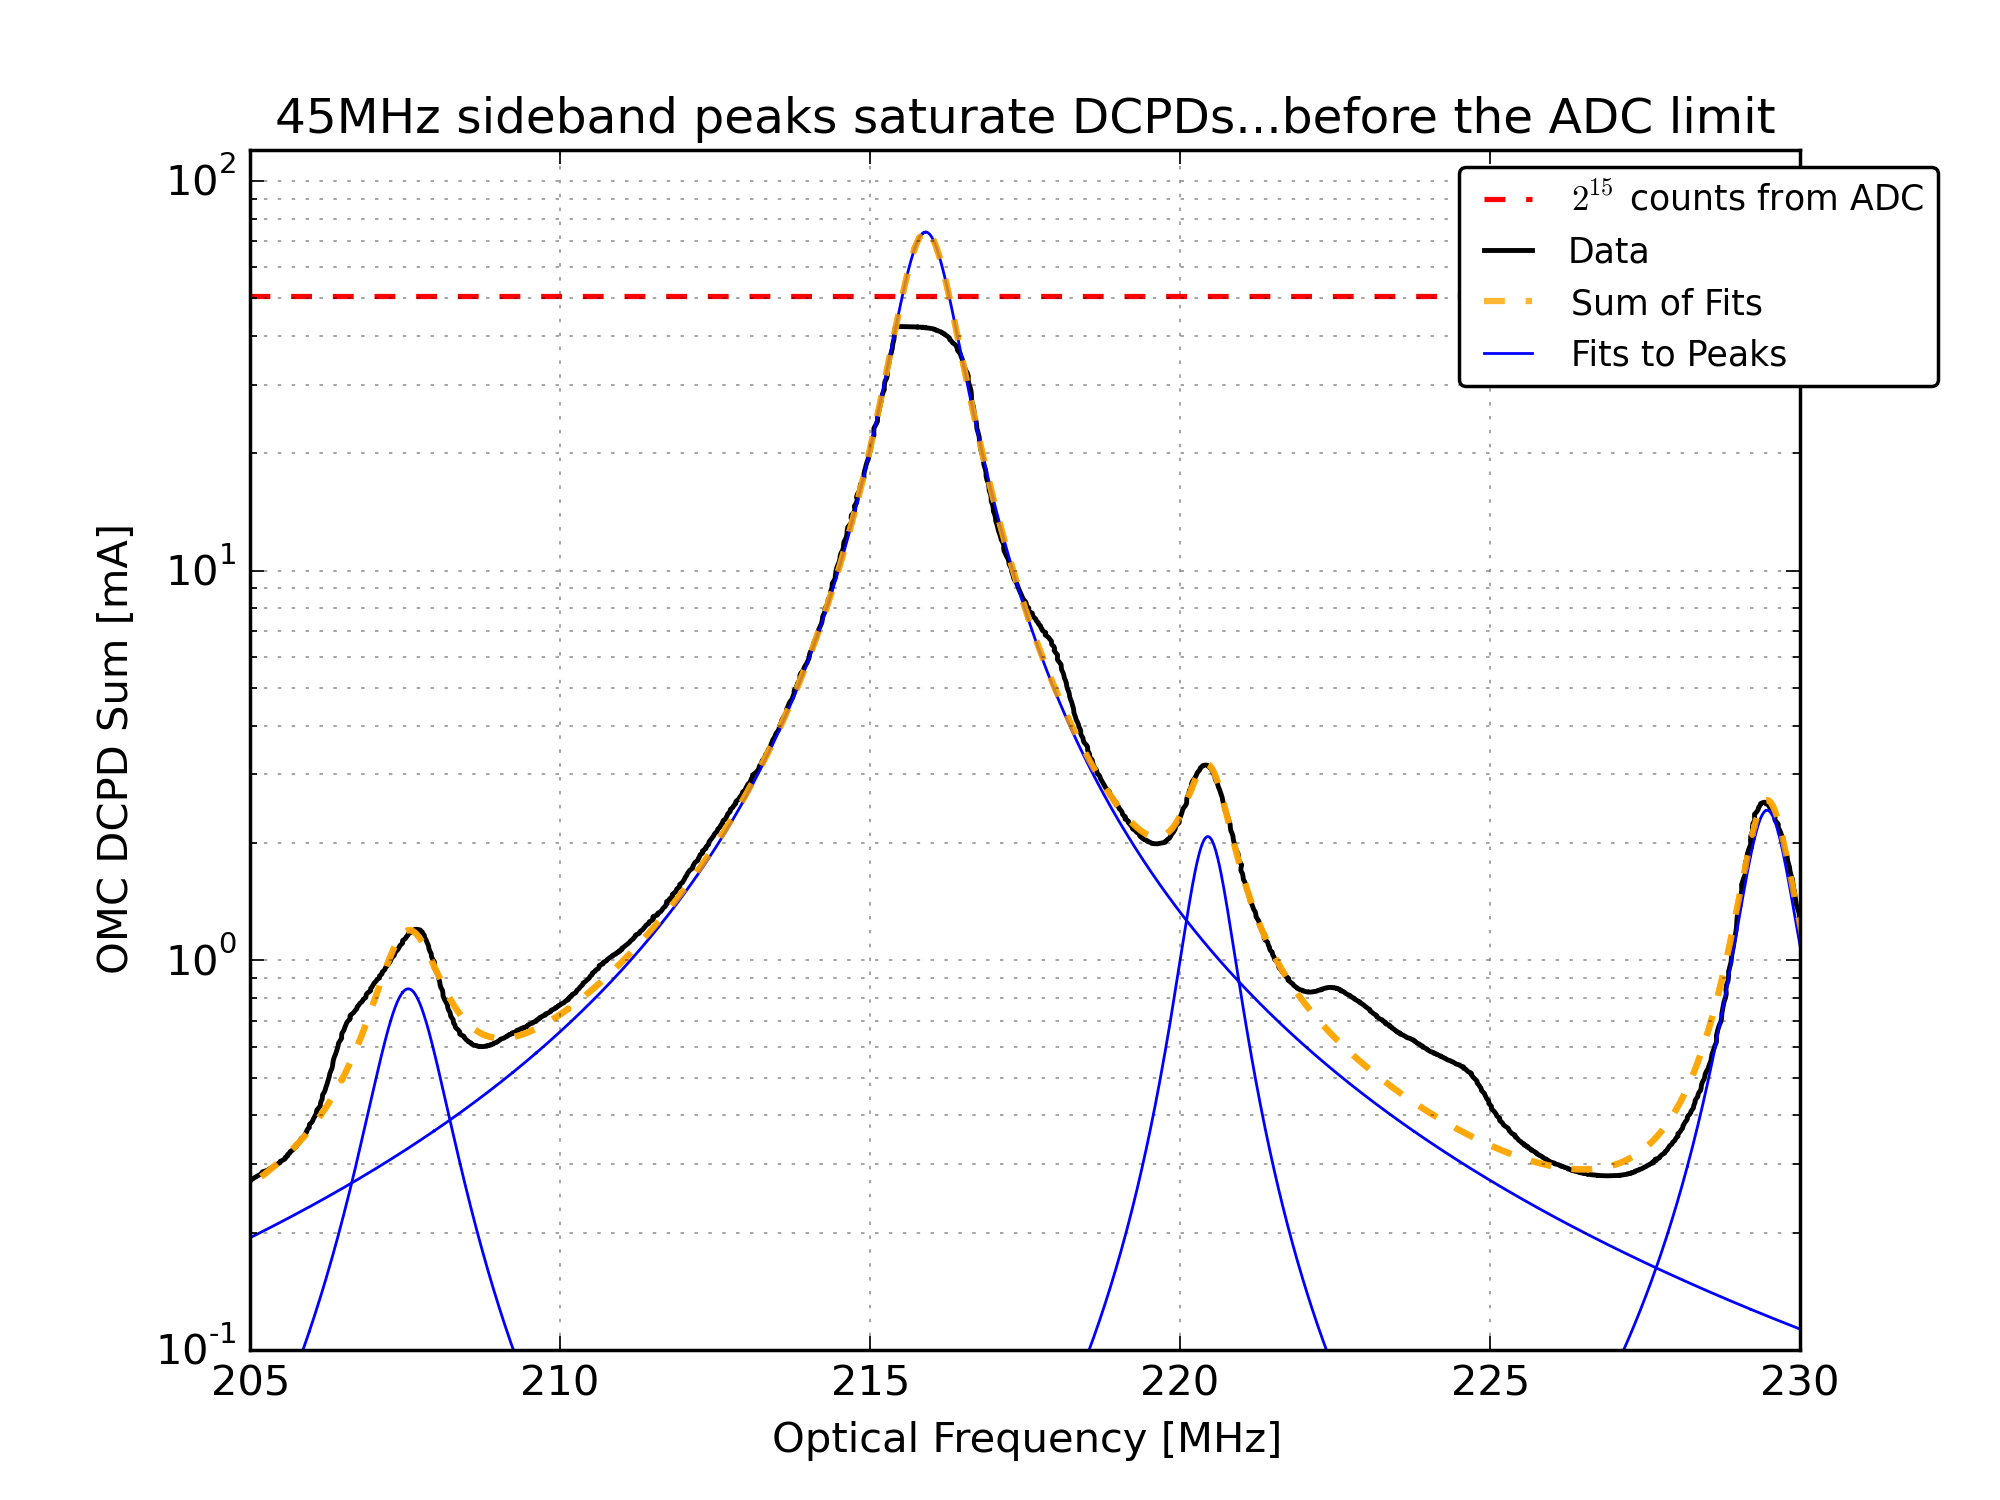
Weirdly, the 45MHz peaks saturate at a slightly lower value than expected. During the mode scans each of the DCPDs would always flat-top around 27500 counts out of the ADC for each of the 45MHz peaks. See Figure 3. To get around this in the mode fitting, I fit the data before and after the flat-top from the saturation. Unfortunately this doesn’t return the correct peak height: the total power doesn’t agree with what we expect, and it doesn’t agree with the power measured by AS_C. So we still don’t have a complete picture of the HAM6 noise budget.
We could try mode scans with the DCPD preamps in the Lo-Z state, but this only gains us a factor of four in headroom, and the 45MHz peaks would still be on the edge of saturation.
Results: Contrast Defect, Mode Matching, and the Time Evolution of Sideband Power
Using the beacon dither demodulation, we can tag the fraction of the carrier modes which are resonant in the arm. For each PZT sweep, the DCPD data was demodulated at the DARM excitation frequency. A multiplicative factor was applied to match the carrier 00 mode signal in the demodulated signal to the raw DCPD data. From there, we calculate the fraction of each carrier higher-order-mode that is resonant in the arms. The procedure is the same as described by Koji. After some testing I settled on a 10Hz lowpass after the demodulation.
The junk light in the carrier higher order modes is used to calculate the contrast defect: 66.2 +/- 4.5 ppm. The uncertainty is a combination of the statistical uncertainty from mode heights and the variation from sweep to sweep, and systematic uncertainties described in section 5.6 of P1500136.
The fraction of good light in the CR2 (bullseye) mode is used to calculate the mode-matching of the resonant light from the arms into the OMC. Mode-matching: 0.997 +/- 0.001. The alignment into the OMC was not so good during these measurements (a large fraction of the CR1 mode was from the arms), but this was expected since we were using the QPD servo.
The breakdown of DCPD photocurrent from the carrier is:
34.00+/-0.06 mA total carrier light

	22.42+/-0.06 mA of light from the arms (note: this is not quite the standard DARM offset)

	11.59+/-0.06 mA of junk that's not from the arms
Probably in typical low-noise operations, we have 20mA of carrier light from the arms (fixed by the DC readout loop), and 11.6mA of junk carrier from the corner.
The figures attached are the following:
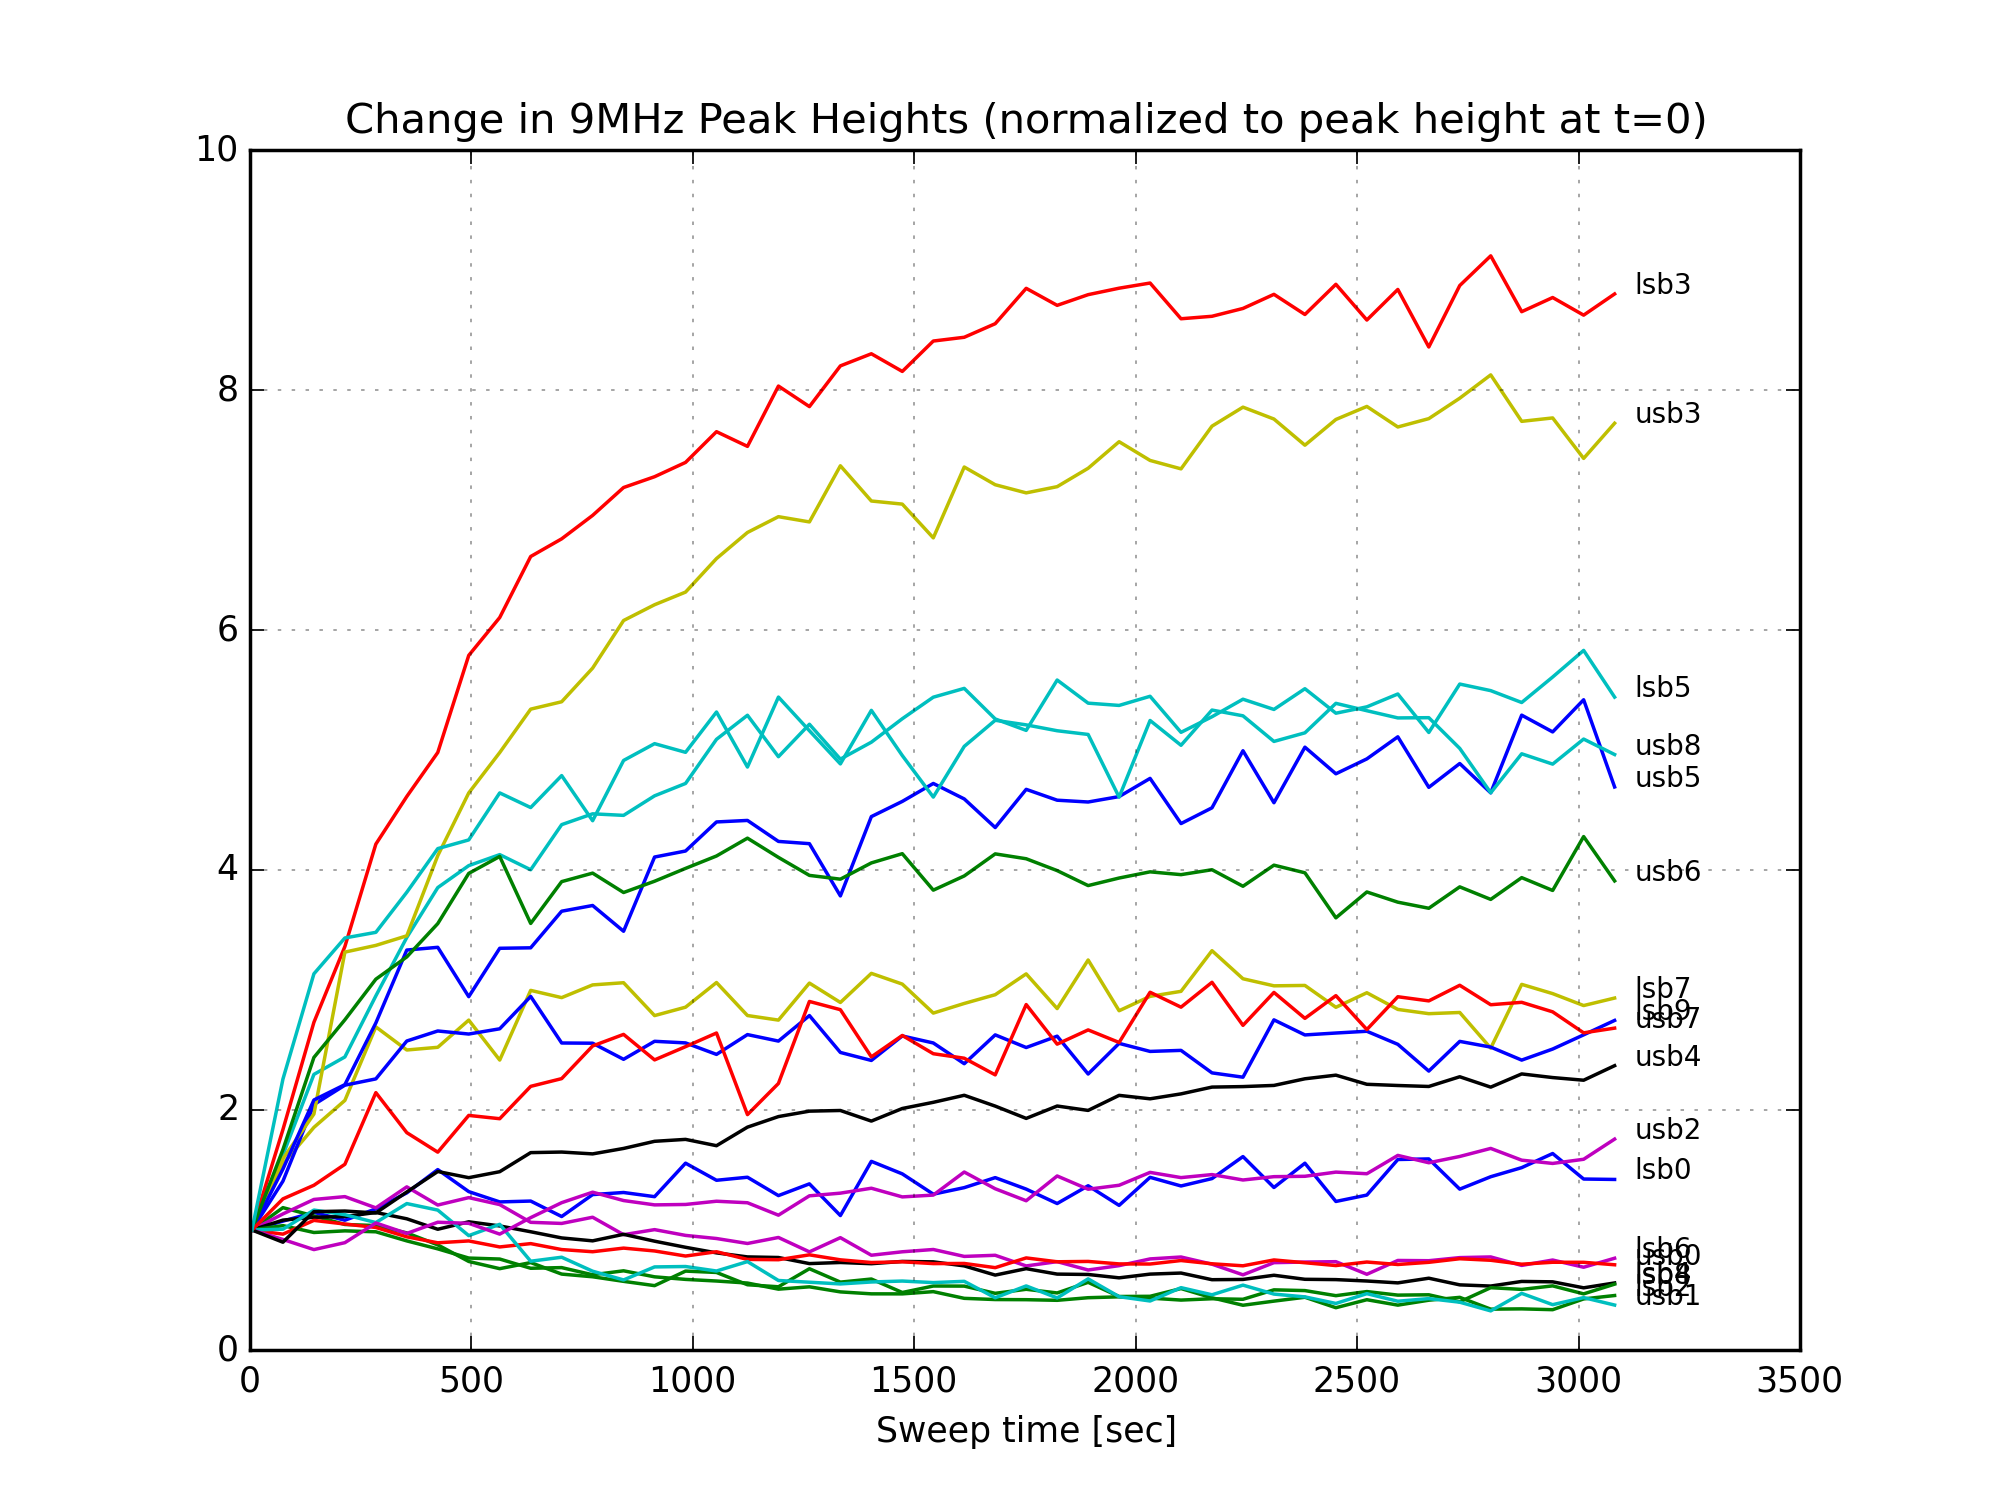
Figure 1 is a GIF movie showing the evolution of the peak heights following the power up. Note the dramatic increase in lsb3, a higher-order mode of the 9MHz lower sideband.
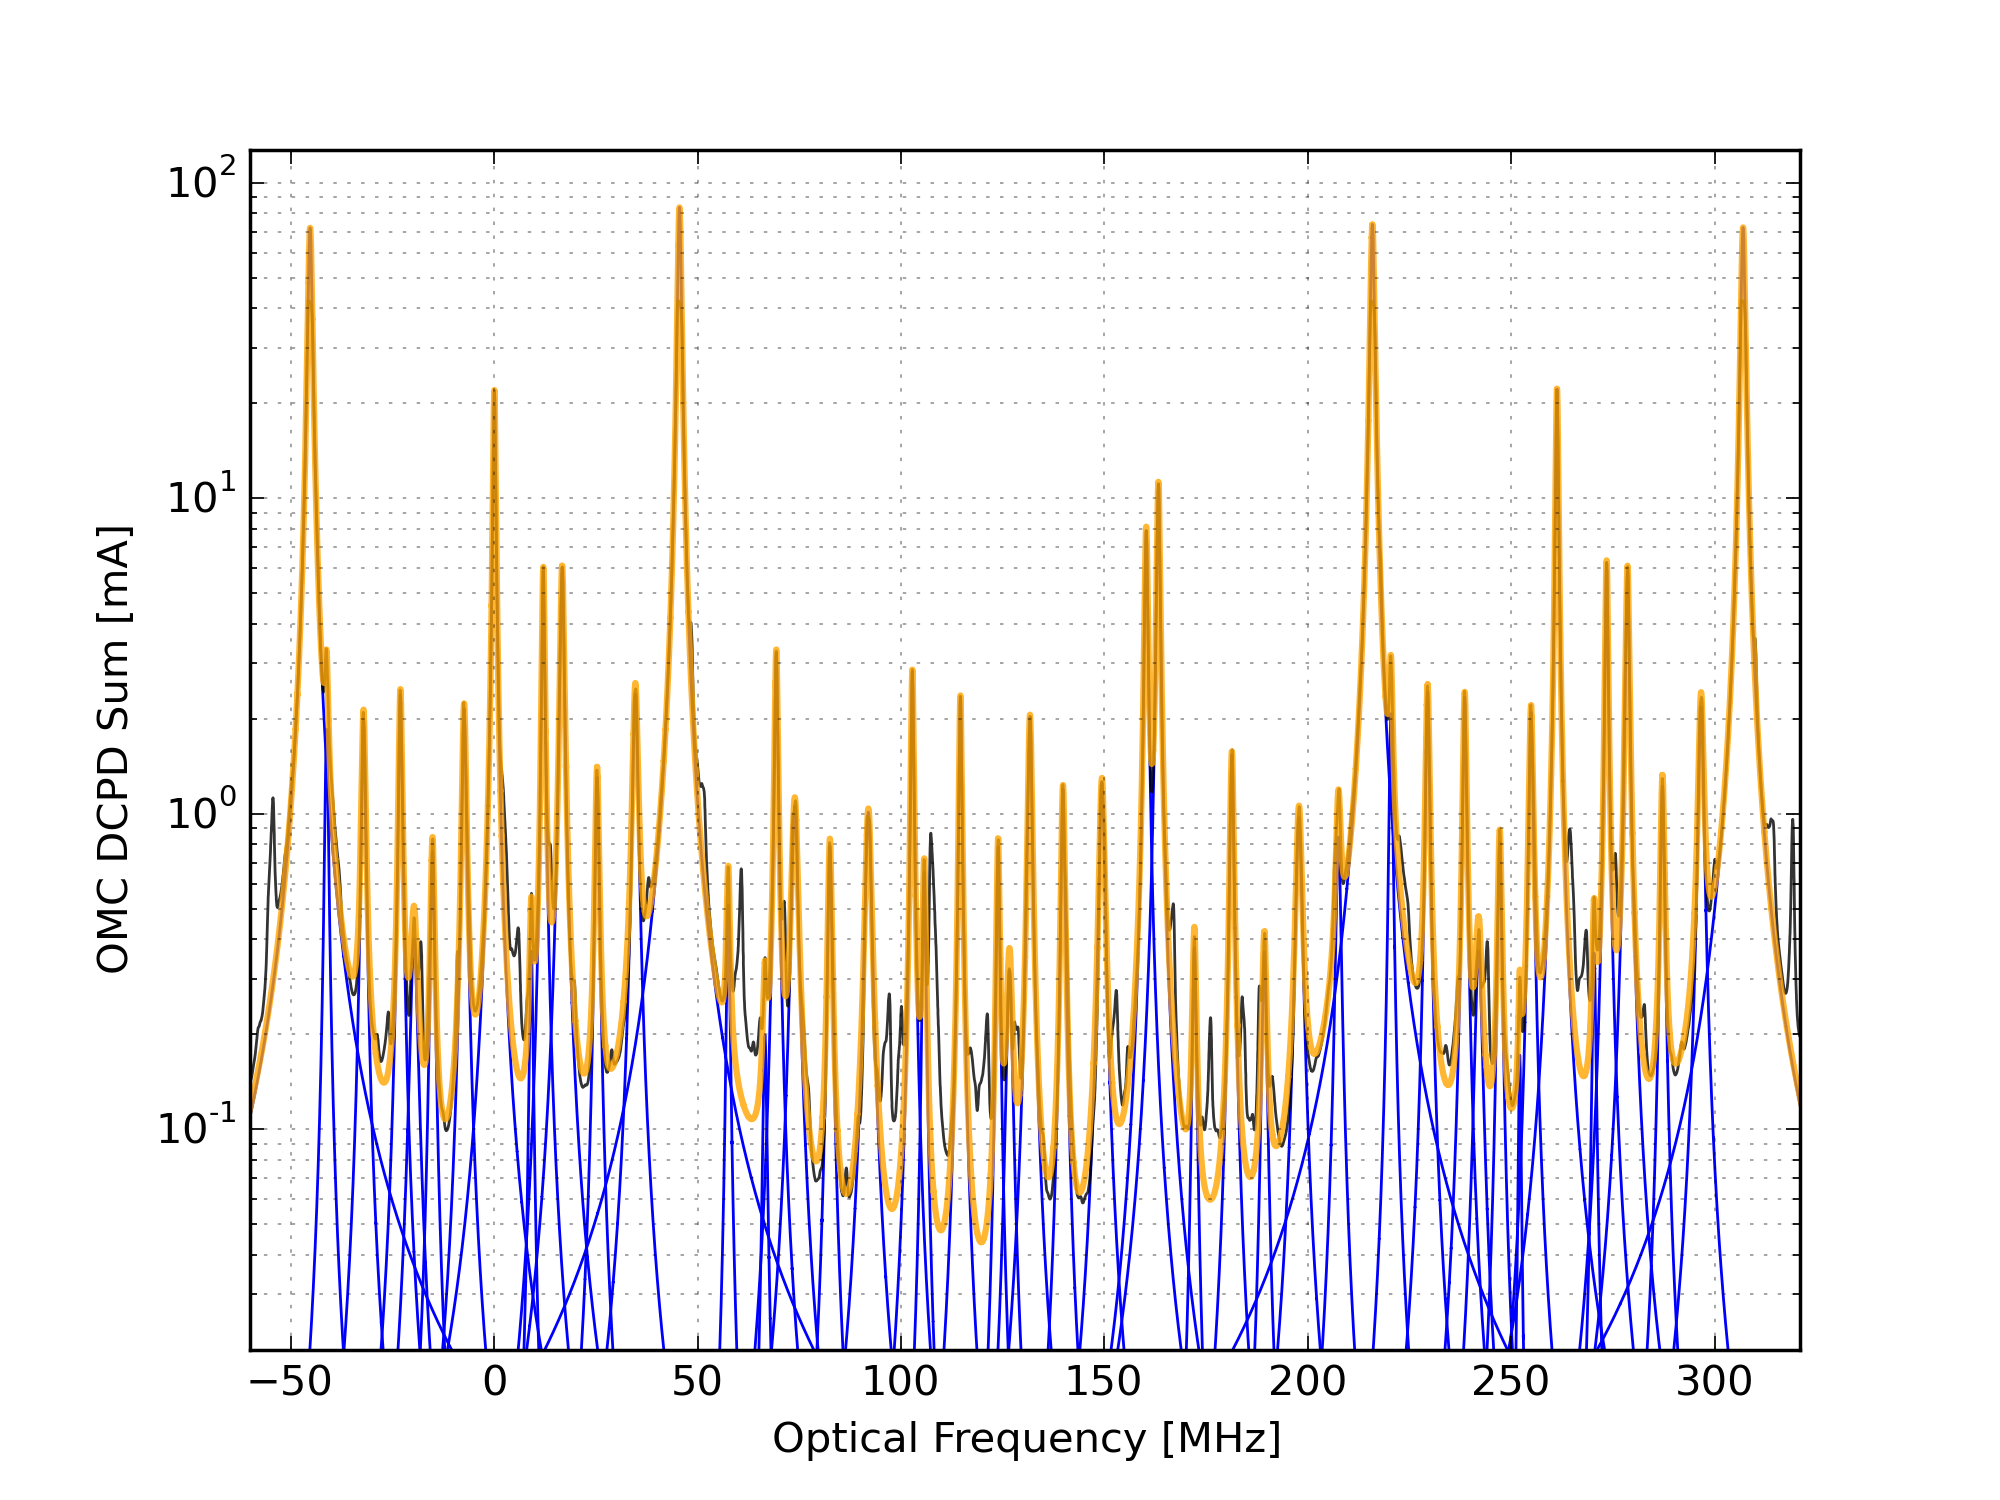
Figure 2 is a GIF demonstrating the peak fitting procedure.
Figure 3 illustrates the saturation of the DCPDs by the 45MHz sideband peaks. The fit to the peaks (which is necessary for the subtraction of the peak shoulders from the surrounding data) is performed using the data on either side of the flat-top from the saturation. To the eye this looks pretty good, but the peak heights from the fit are way less than what we expect, so there's something bogus going on here.
Figure 4 shows the result of the mode fitting (the same data as Fig. 2).
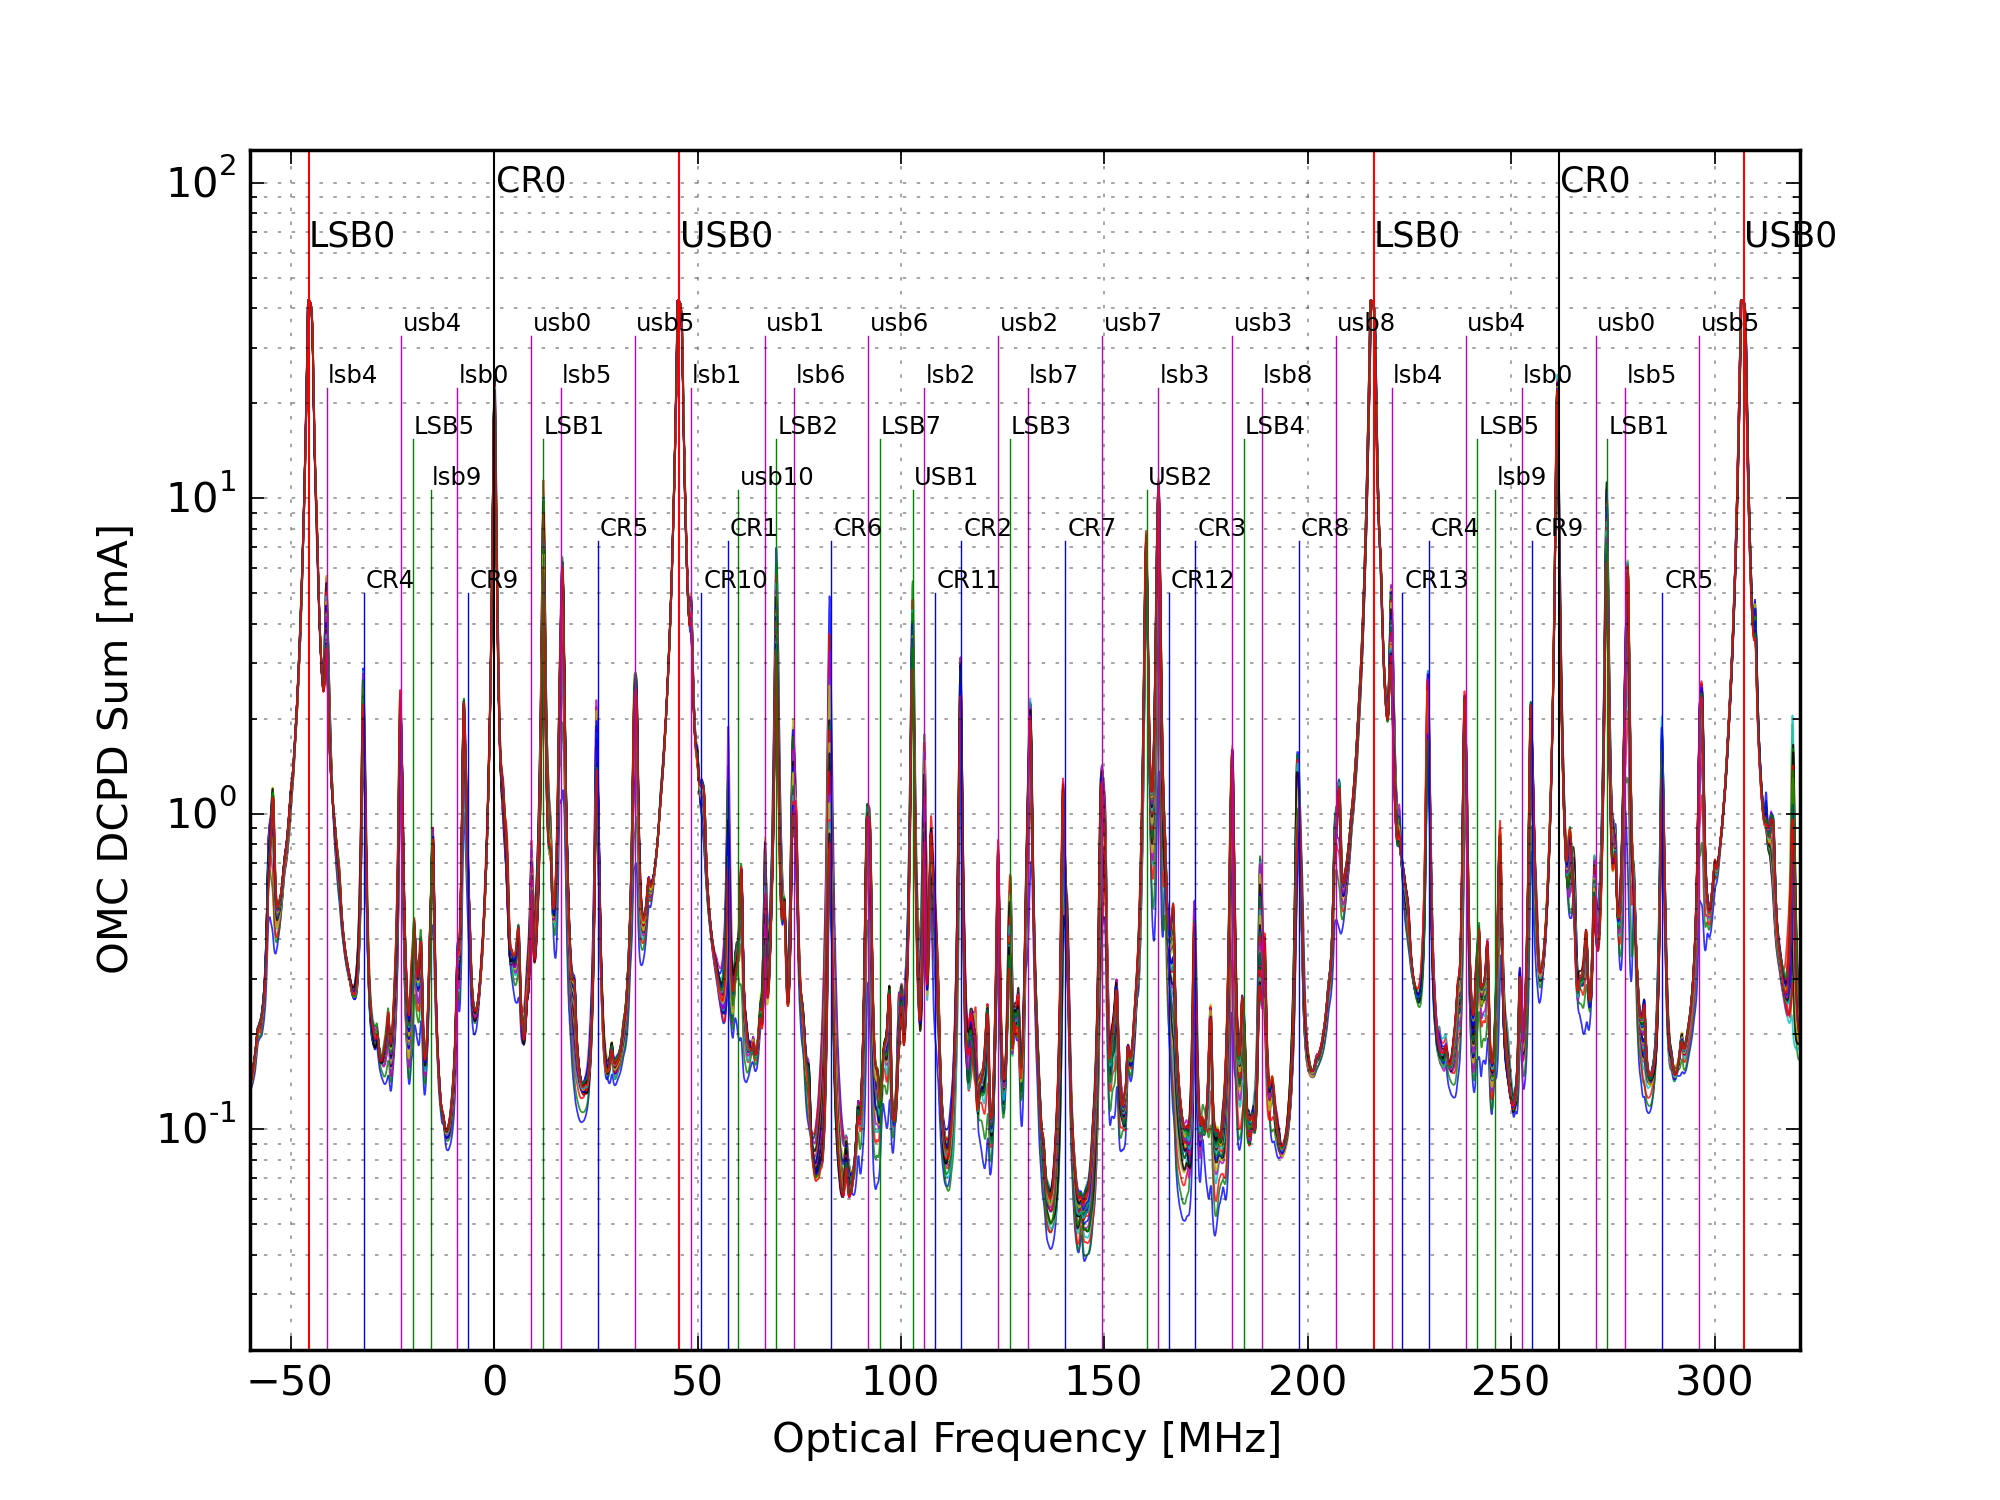
Figure 5 overlays all of the hi-power mode scans and labels the peaks. Not all of the peaks that are labeled are fit in the analysis.
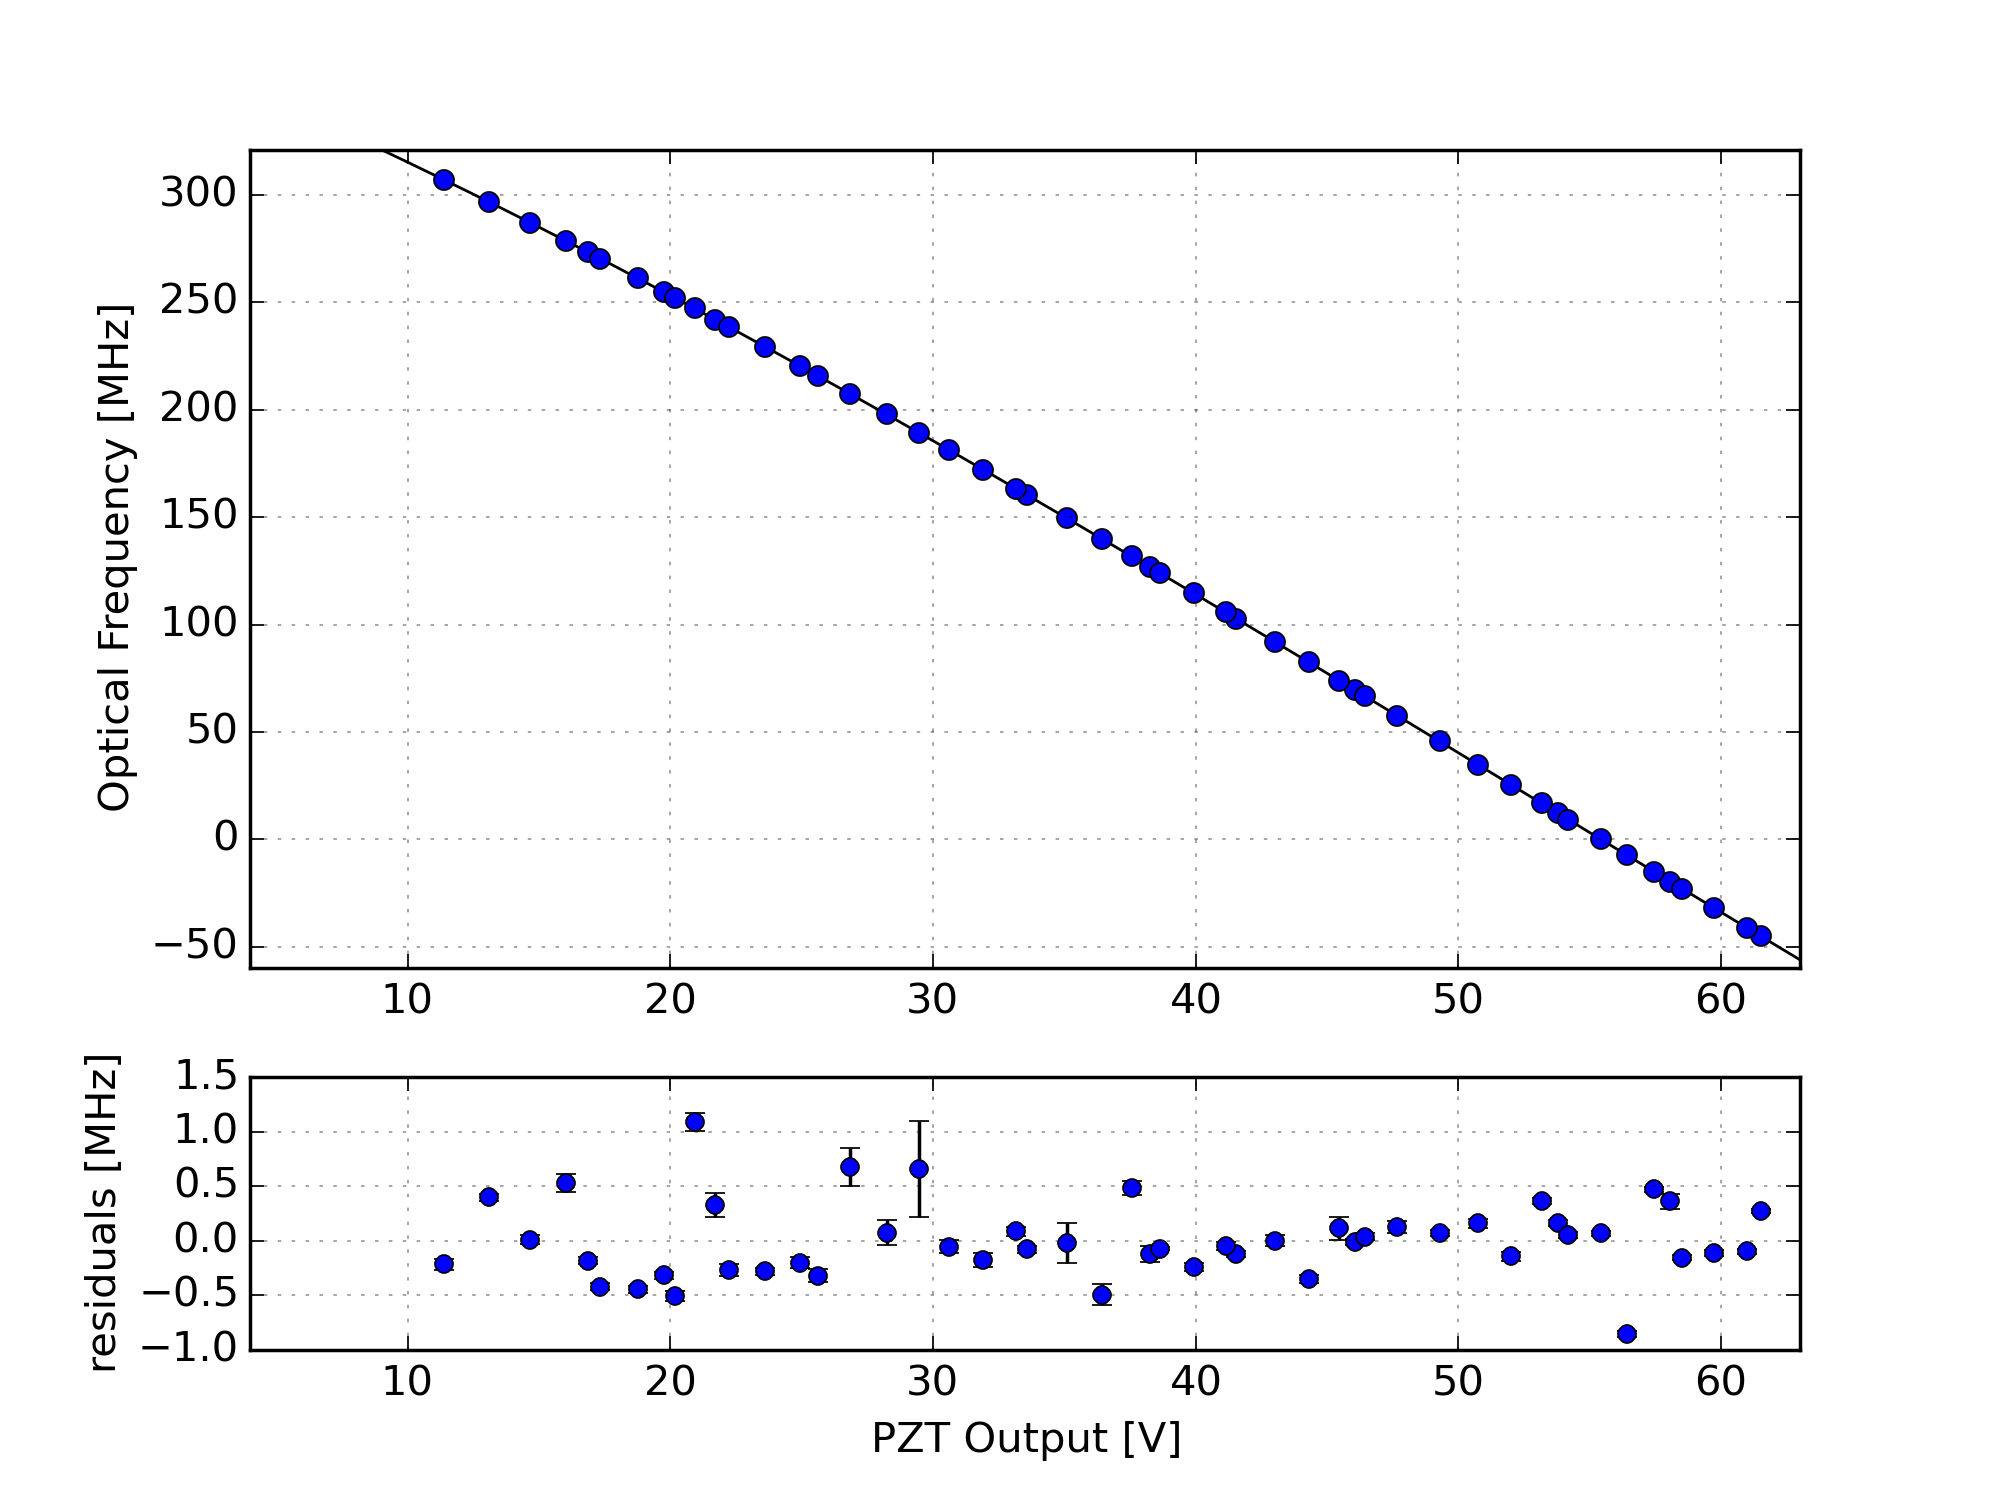
Figure 6 shows the fit of the peak locations (in PZT voltage) to the expected optical frequency, using a 4th-order polynomial fit of voltage to frequency. This is a sanity check that we correctly labeled the peaks. The error bars are the standard deviation of each peak location, across the few dozen mode scans. This is a crude measure of the statistical variation in the peak fitting.
Figure 7 shows the results of the beacon dither demodulation for one sweep. Black is the raw DCPD data, blue is the demodulated data at the frequency of the DARM excitation, and green is the background demodulation. This is a replica of Koji’s plot from April. The blue trace has been multiplied by a constant so it matches the black trace (raw data) at the CR0 peaks.
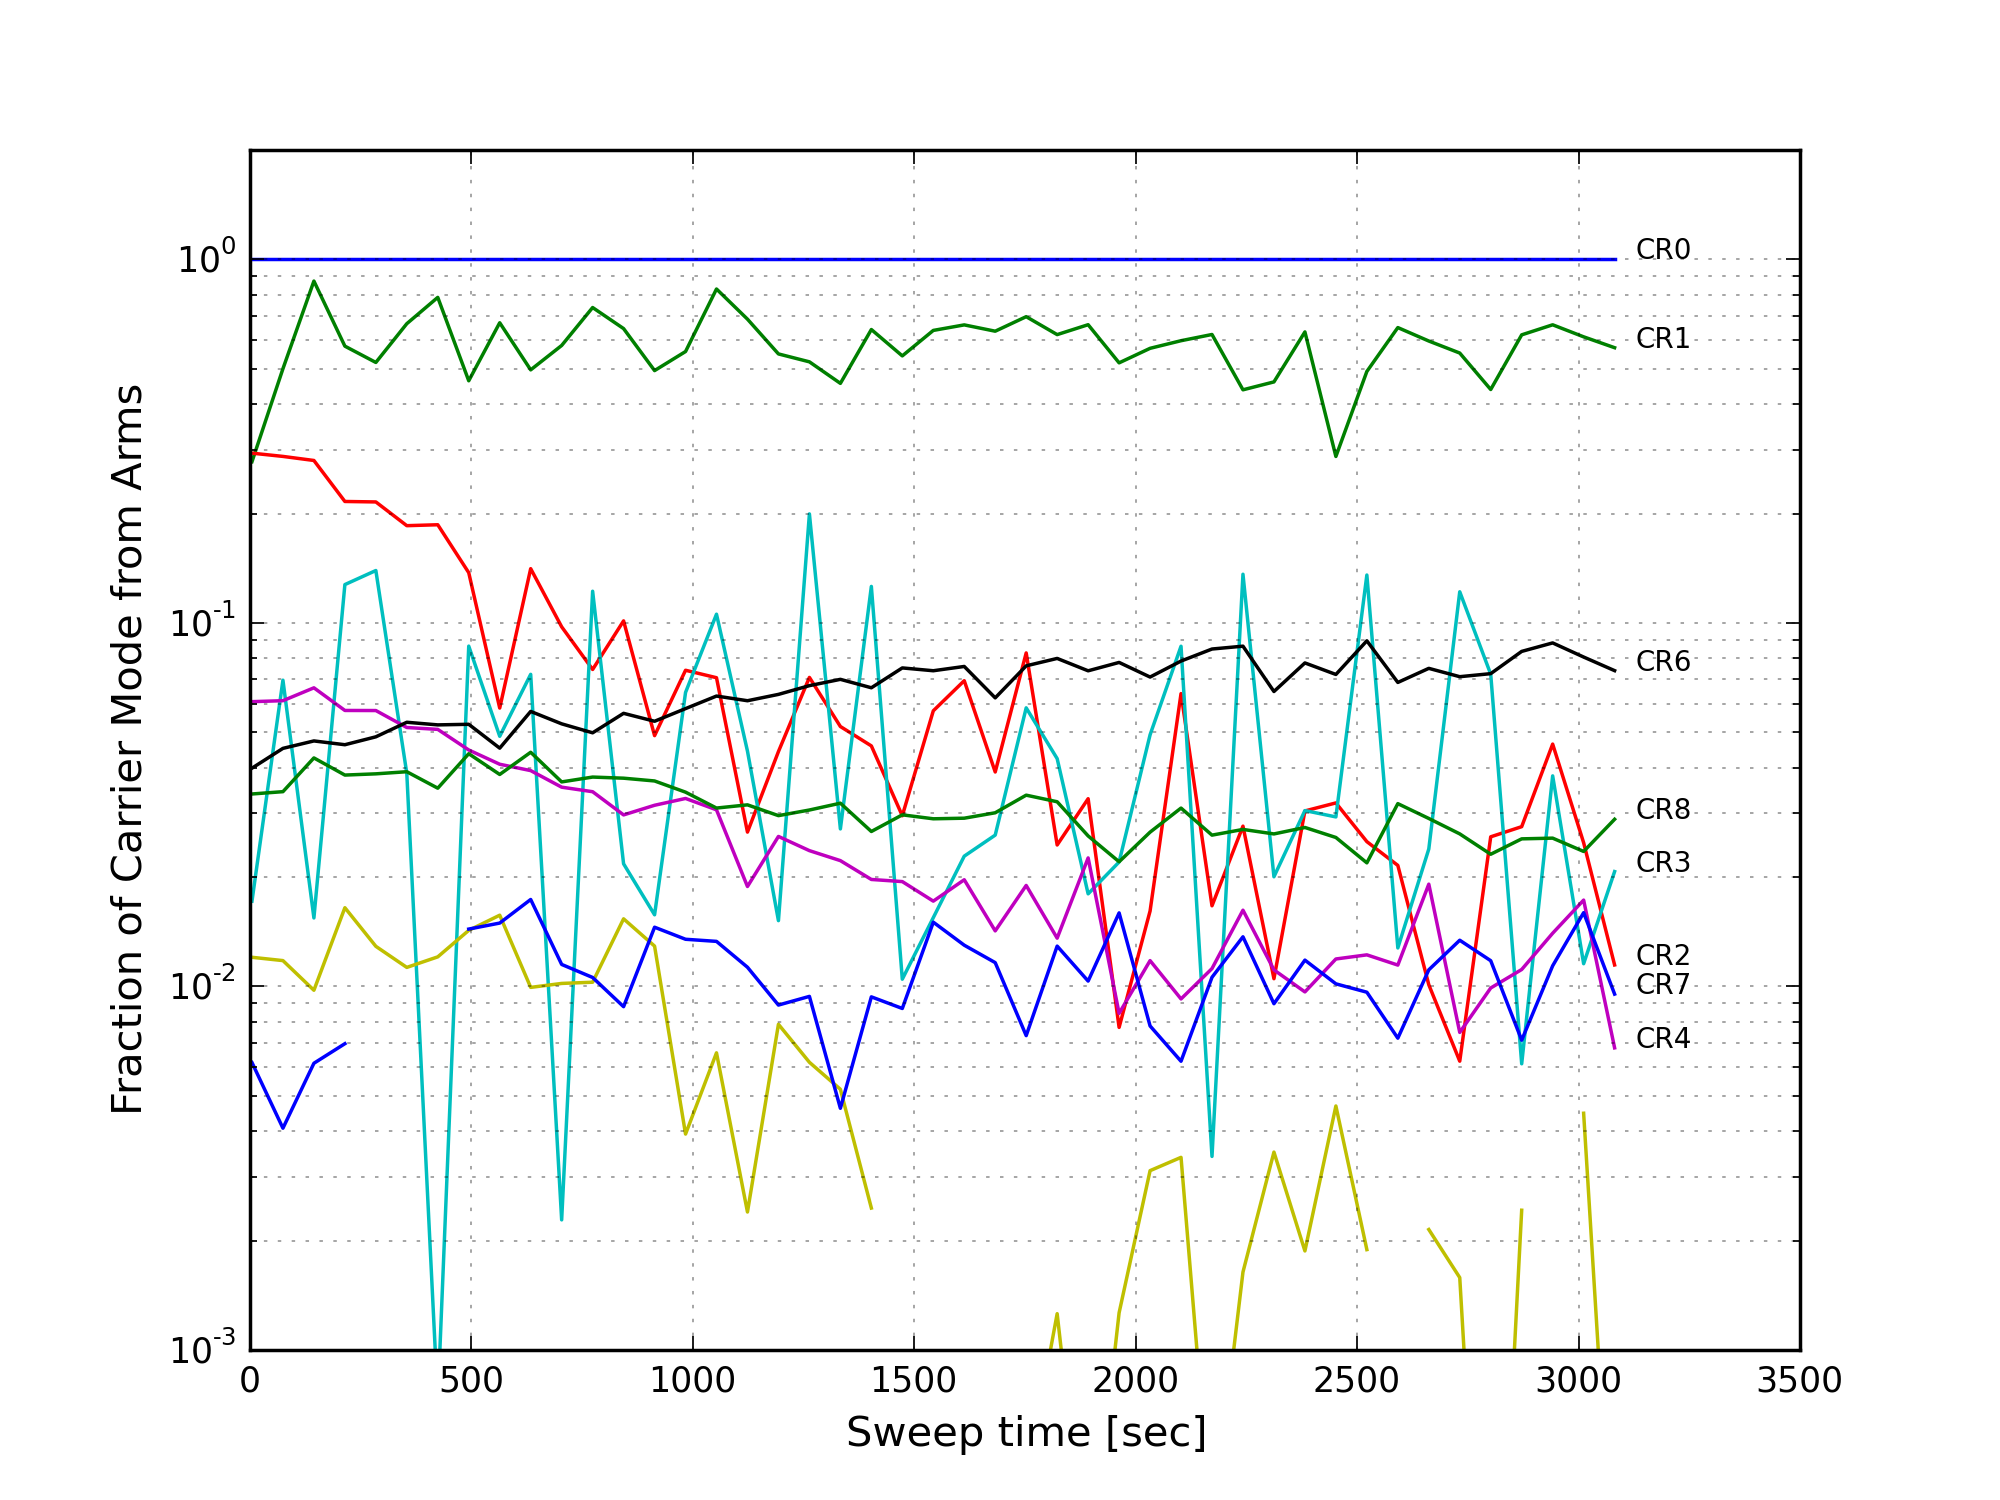
Figure 8 shows the fraction of each carrier mode that is tagged by the DARM excitation. The fraction of the 00-mode from the arms is unity, by definition. Except for the 01,10 mode (due to misalignment from the QPD servo), most of the carrier HOMs are due to junk light, i.e. the fraction of each mode from light resonant in the arms is small.
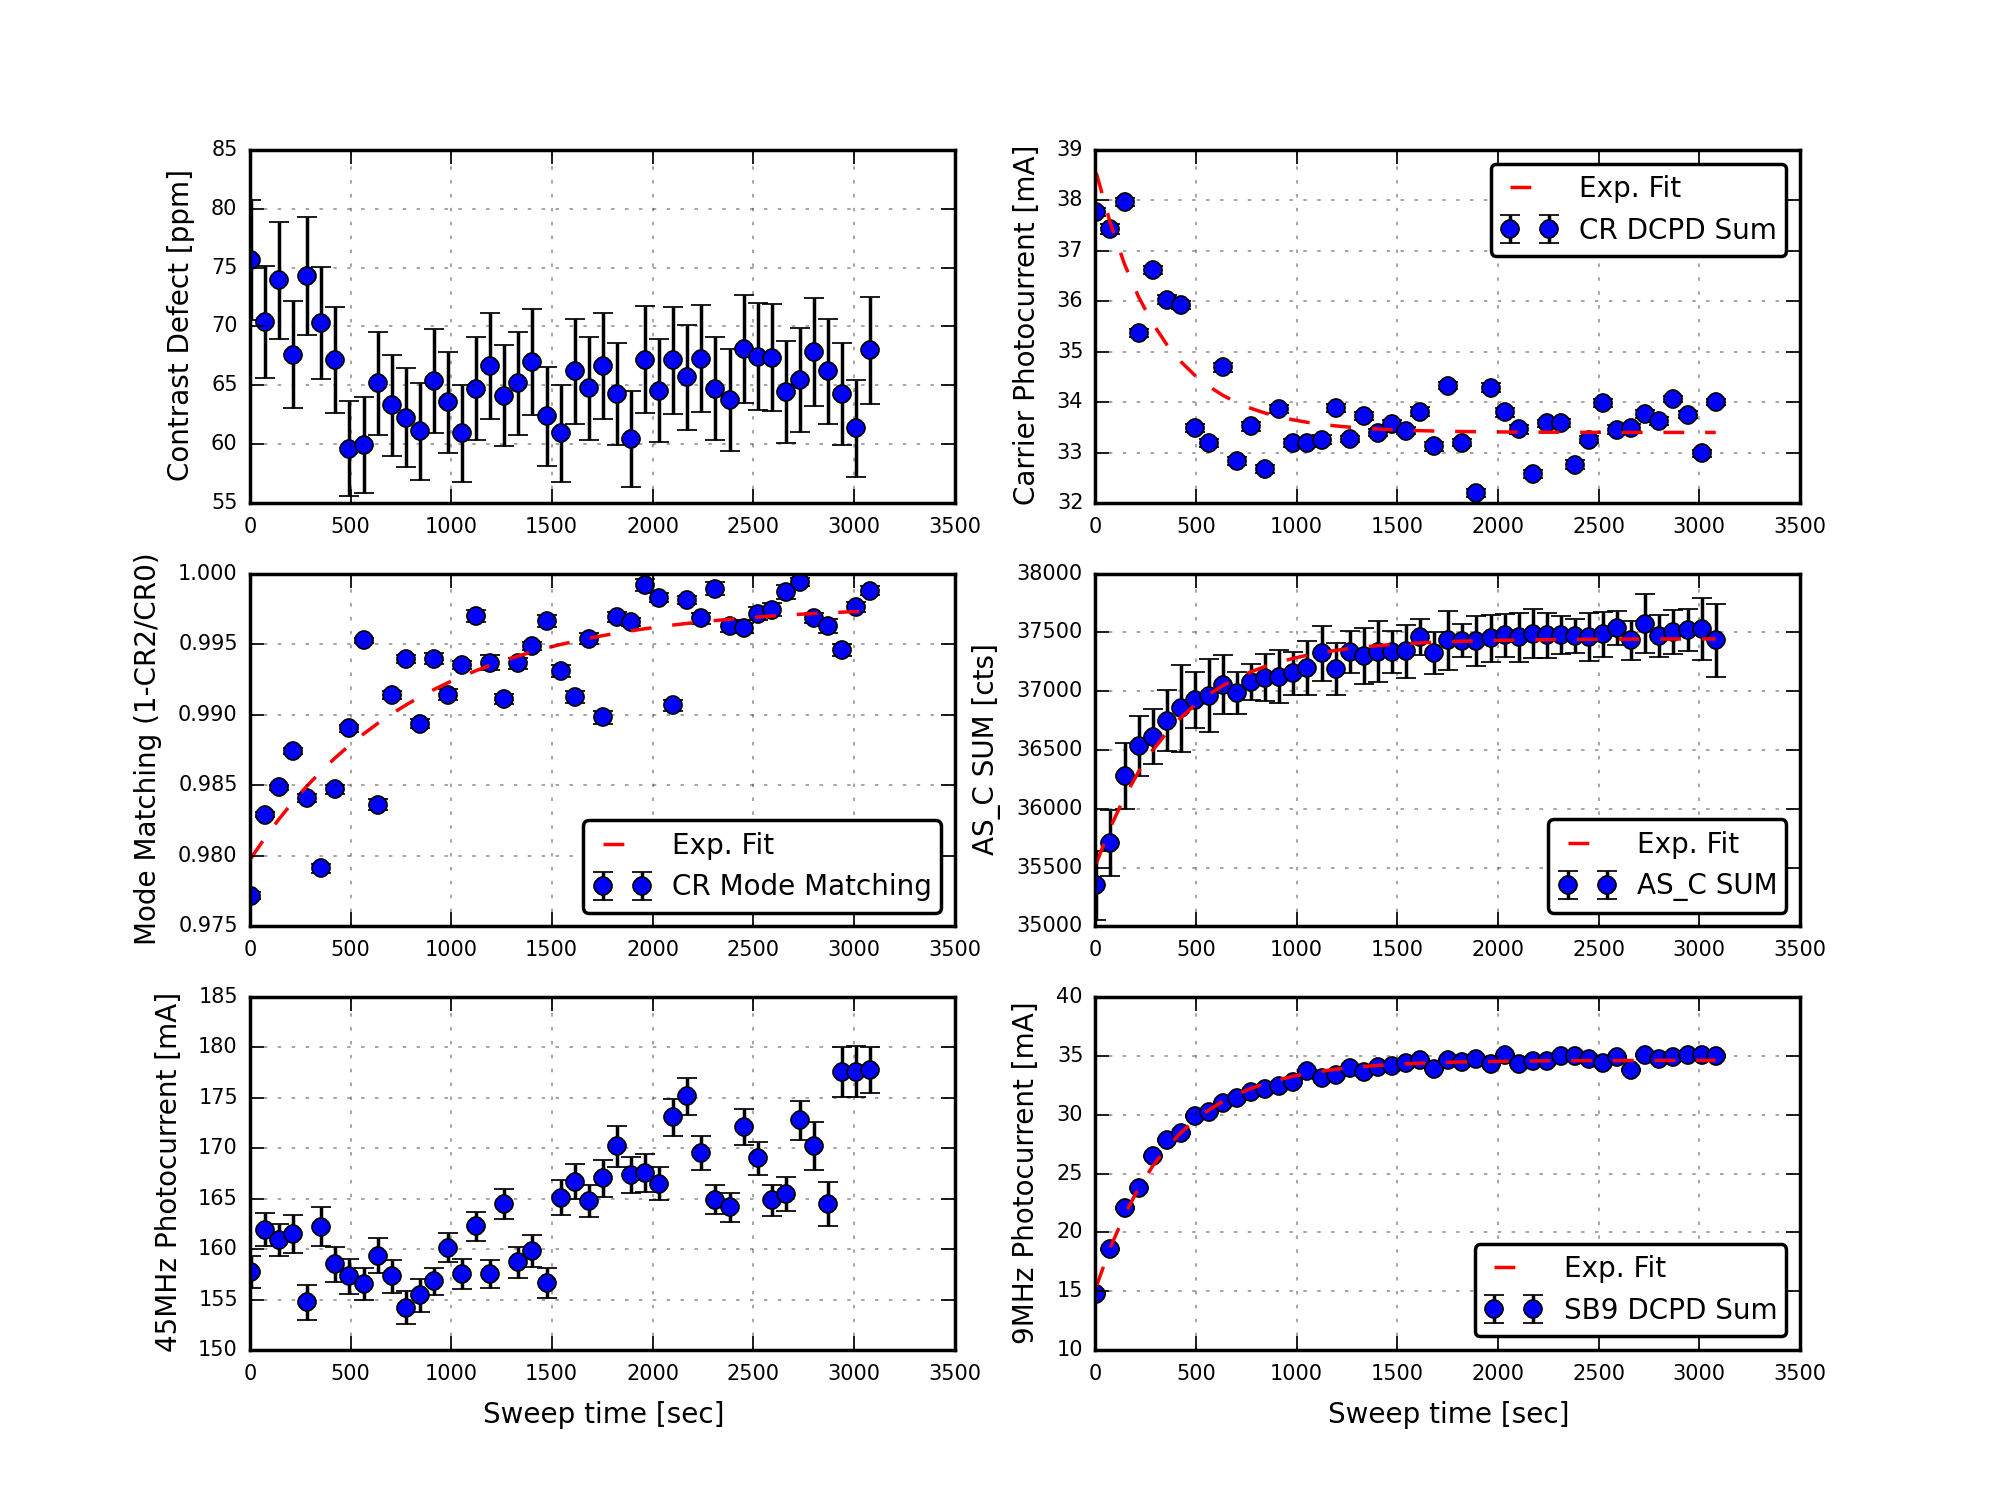
Figure 9 plots various interesting results as a function of time since power-up. This plot is probably the most interesting collection of results. The contrast defect is fairly stable (upper left). Notice how the carrier mode-matching into the OMC improves over time (middle left), and how the 9MHz power increases (lower right). The total photocurrent in the 45MHz sidebands (lower left) is bogus due to the saturated peaks. The time evolution of various measured quantities were fit with exponential curves, the time constants returned by the fits are:
Total photocurrent in 9MHz modes: 370 seconds
AS_C SUM: 400 seconds
Carrier mode-matching (using beacon scan): 830 seconds (note, data are noisy)
Total photocurrent in carrier modes: 320 seconds (note, data are noisy)
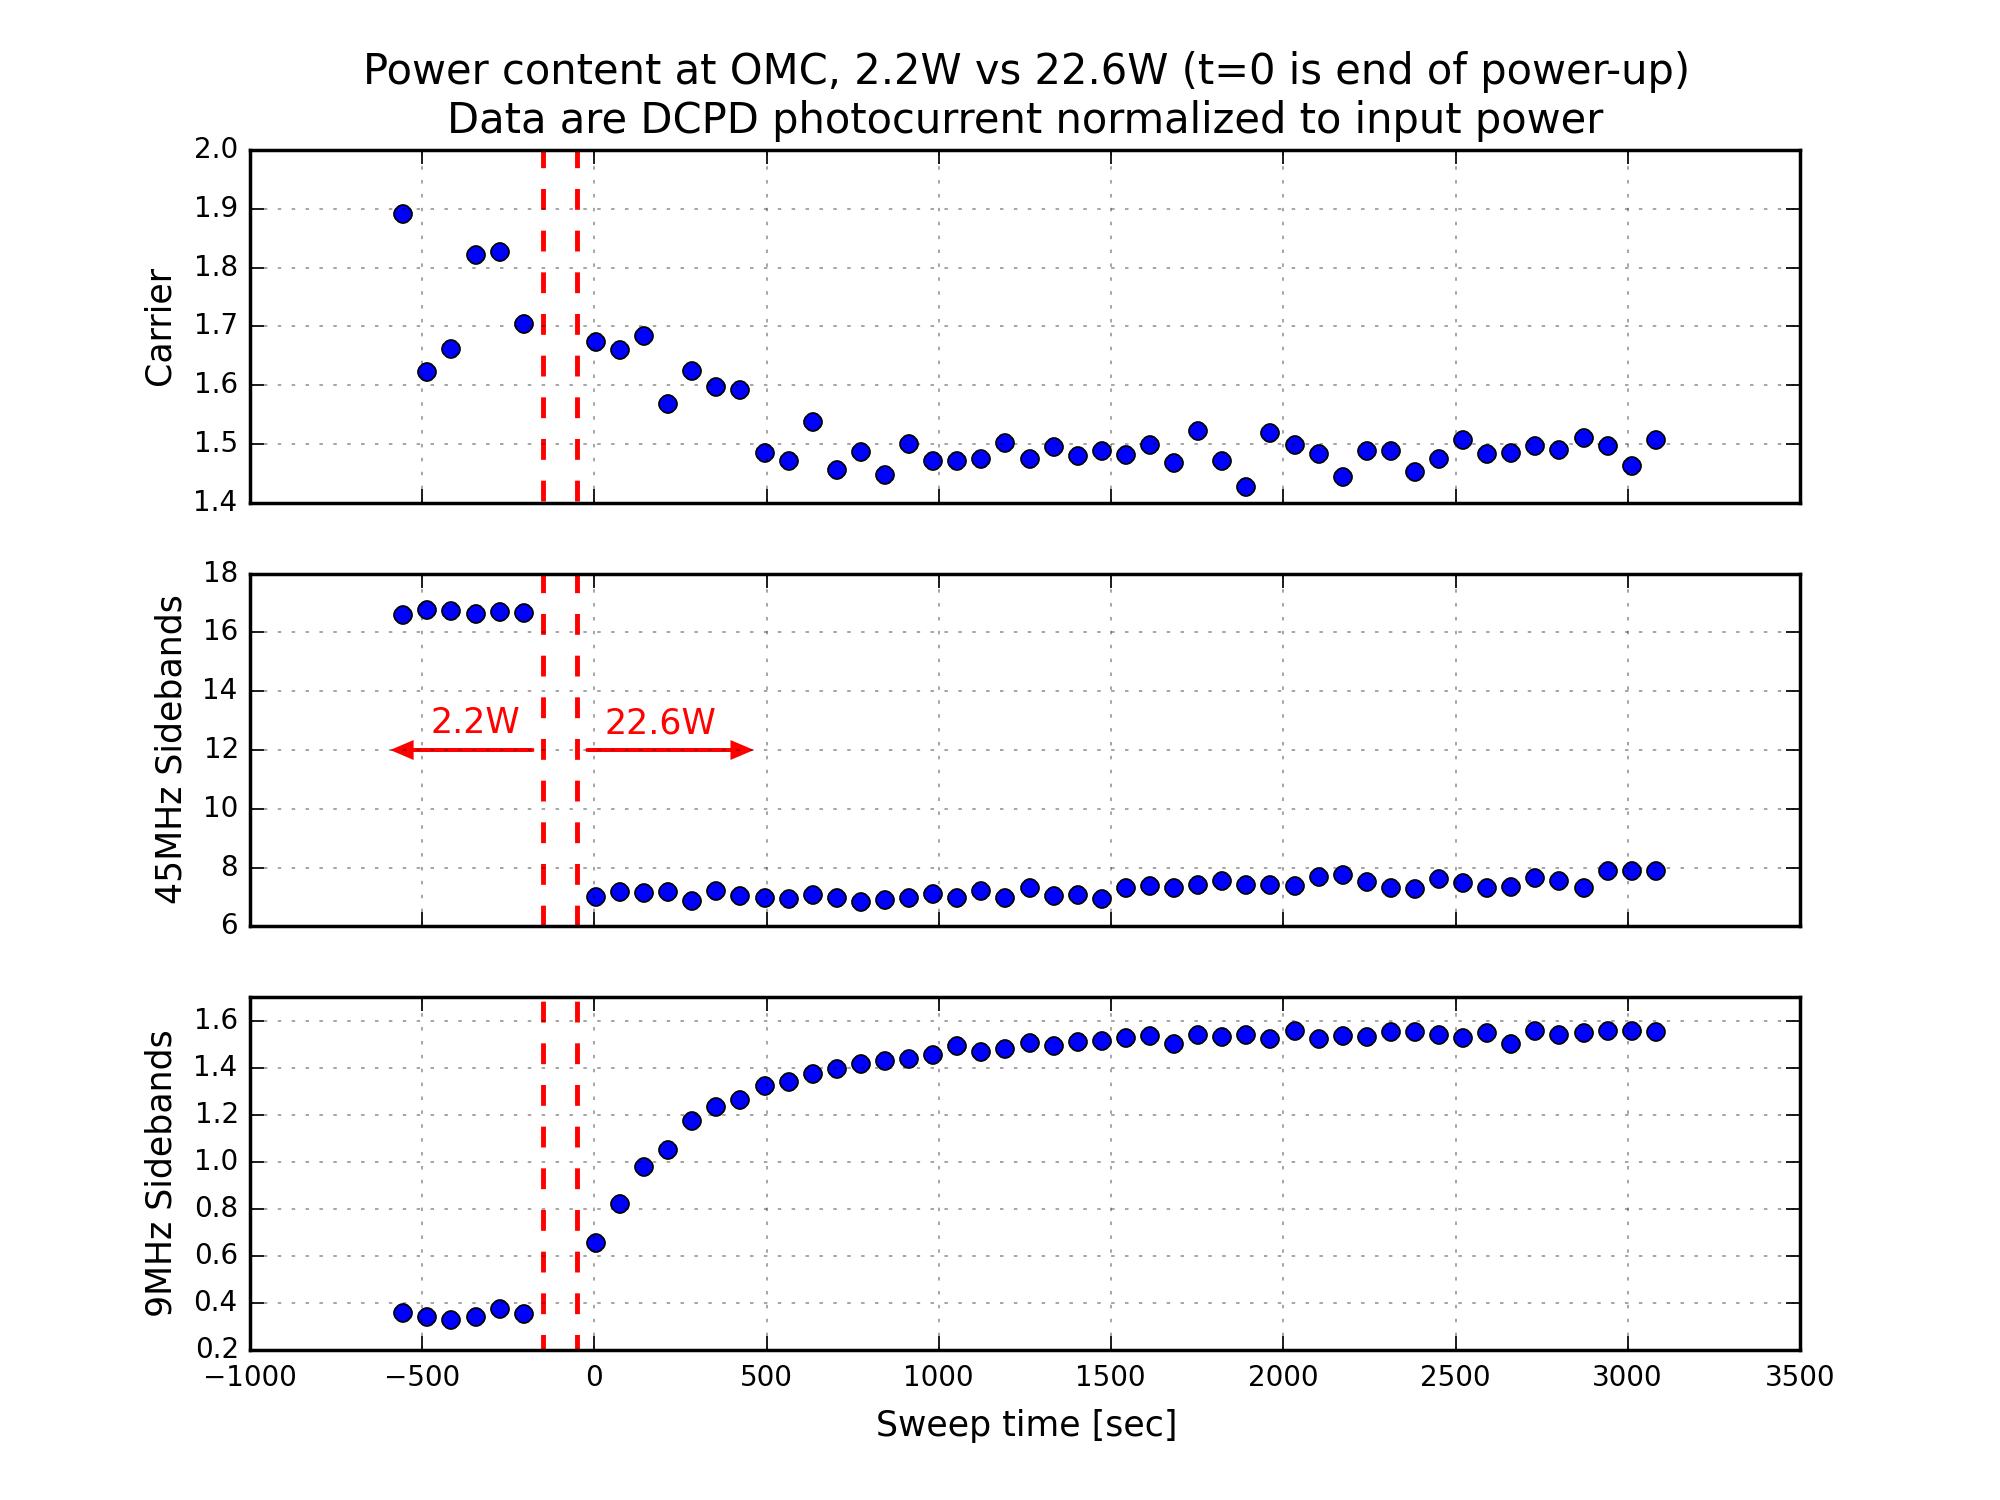
Figure 10 demonstrates the change in power in the carrier, 45MHz, and 9MHz modes around the power-up. Except for the 45MHz data (which is wrong because of the saturated peaks), this is a nice before-and-after picture of the power at the AS port. In this plot, I have normalized the total DCPD photocurrent in [carrier, 9MHz, 45MHz] modes by the input power (measured by IMC-PWR_IN).
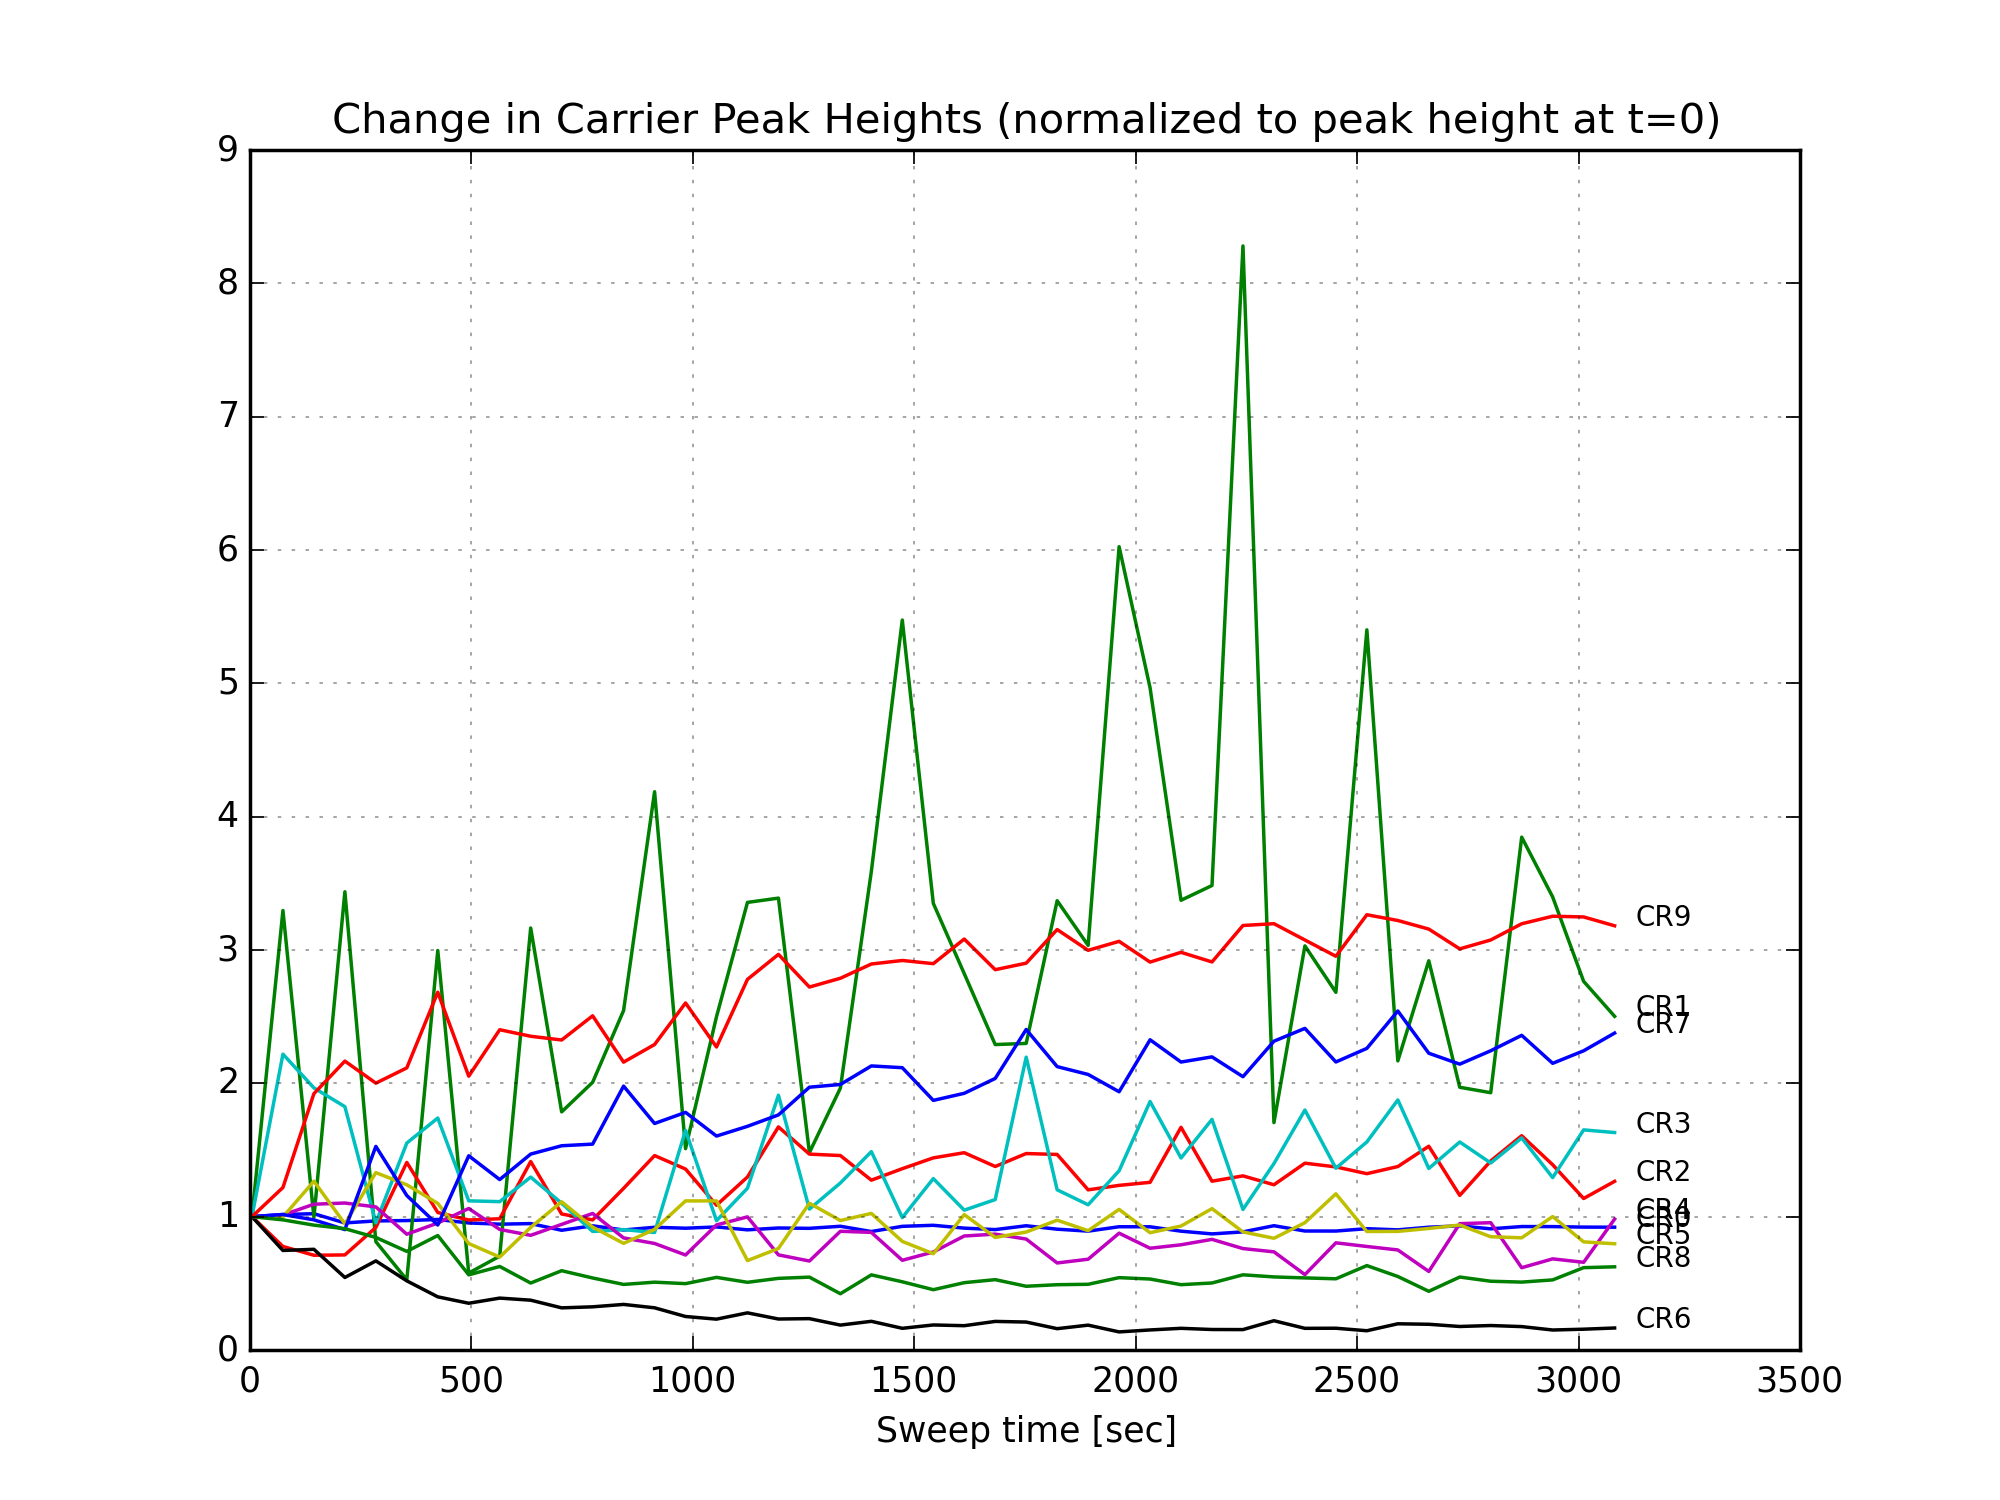
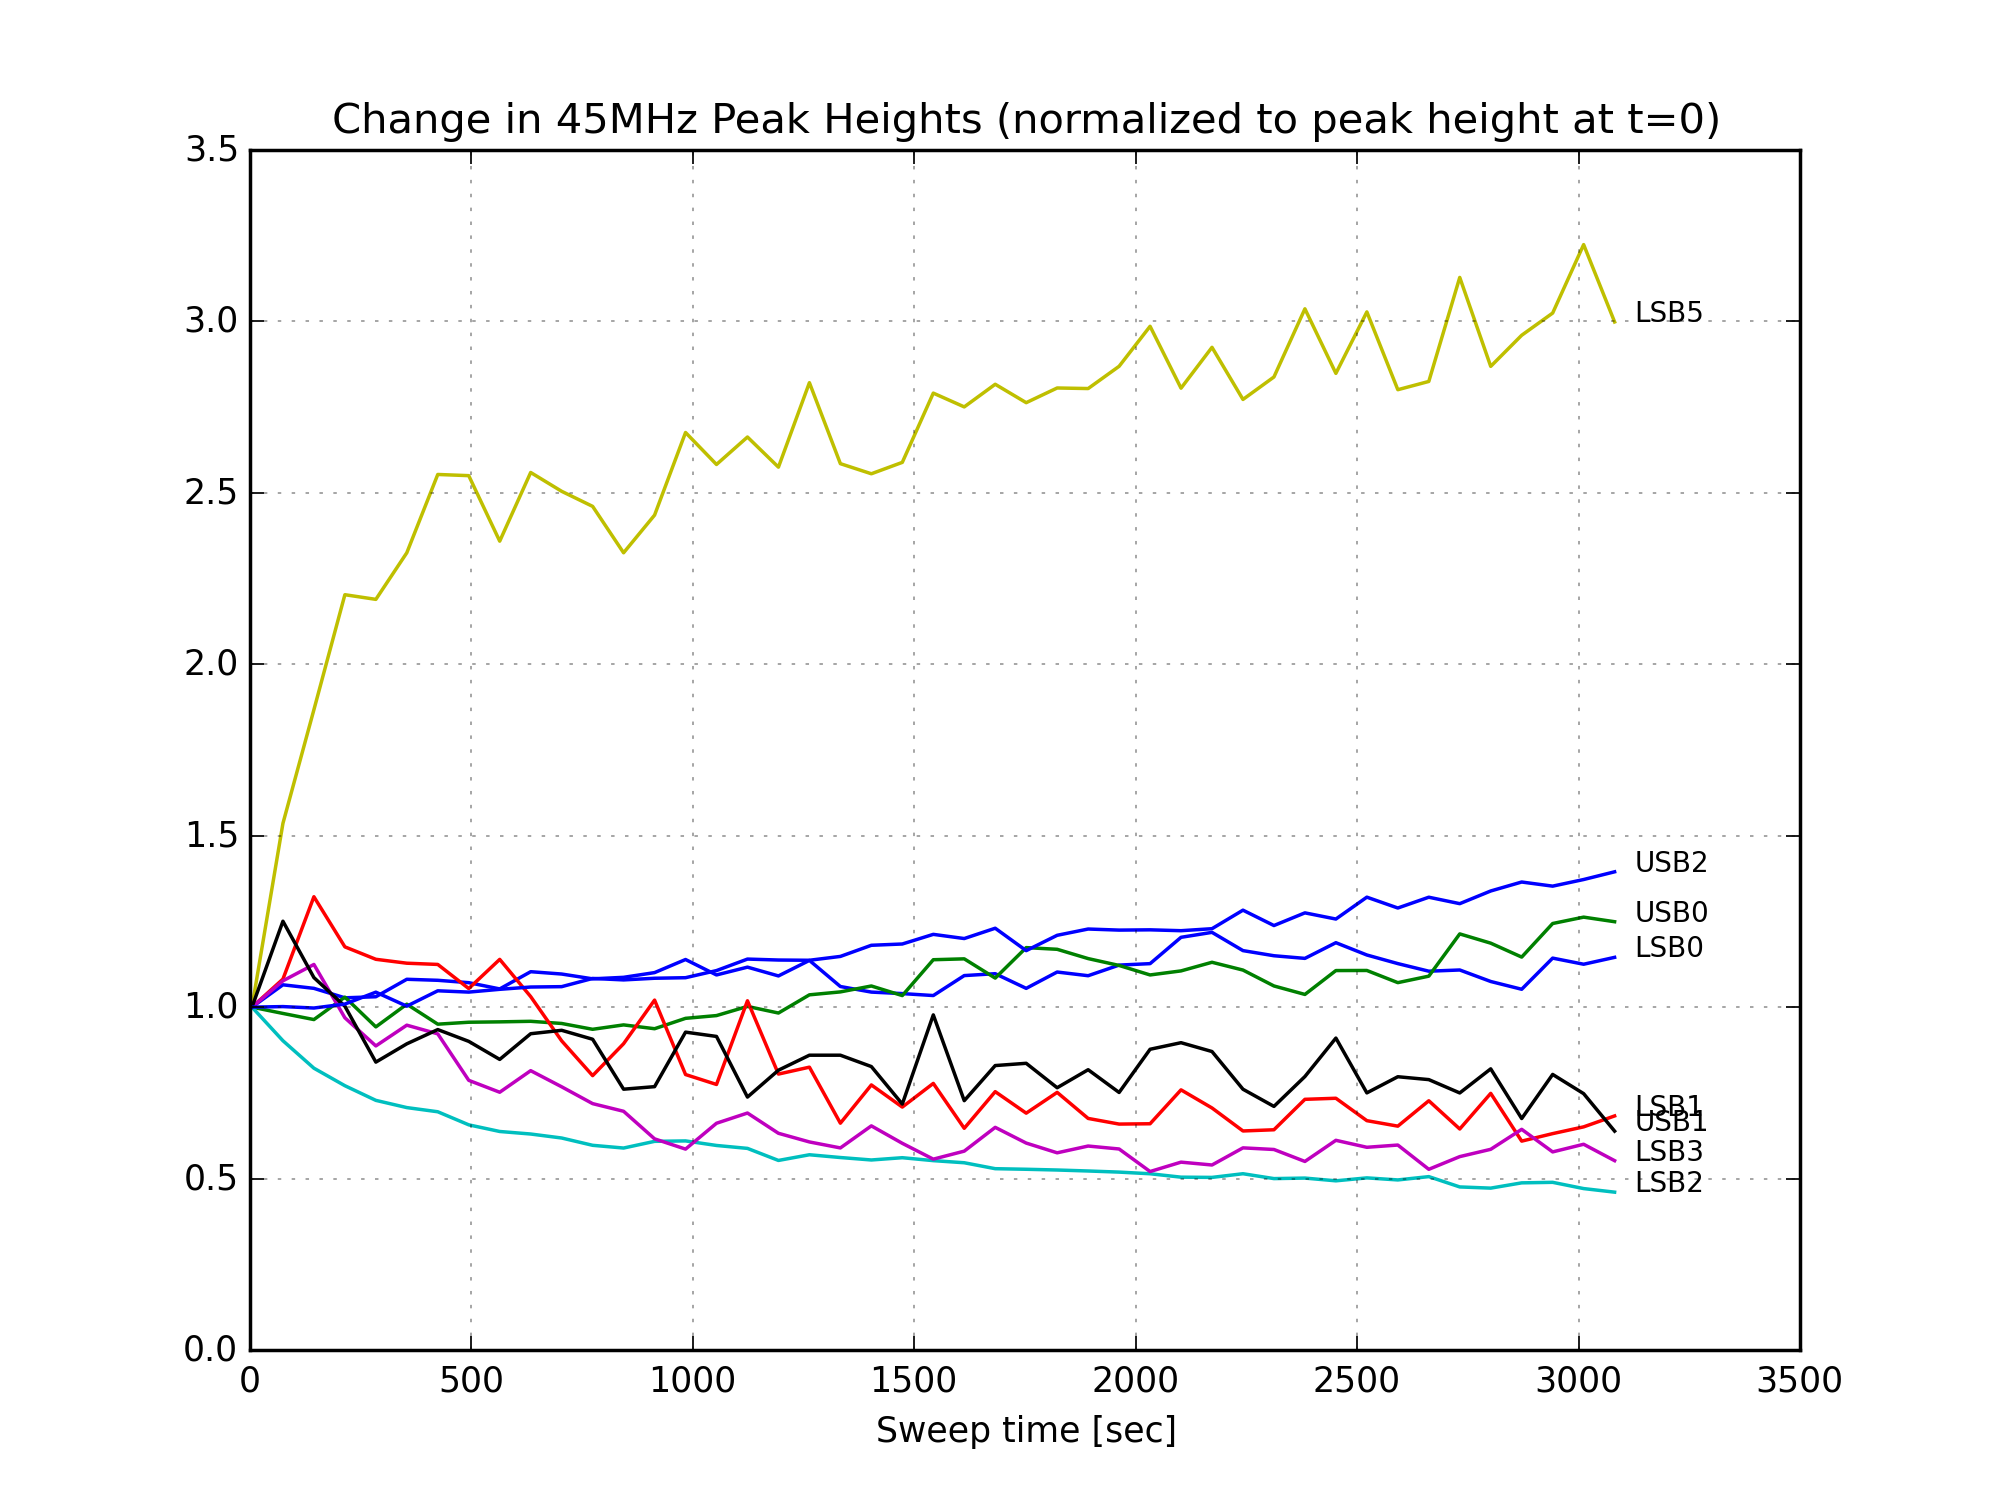
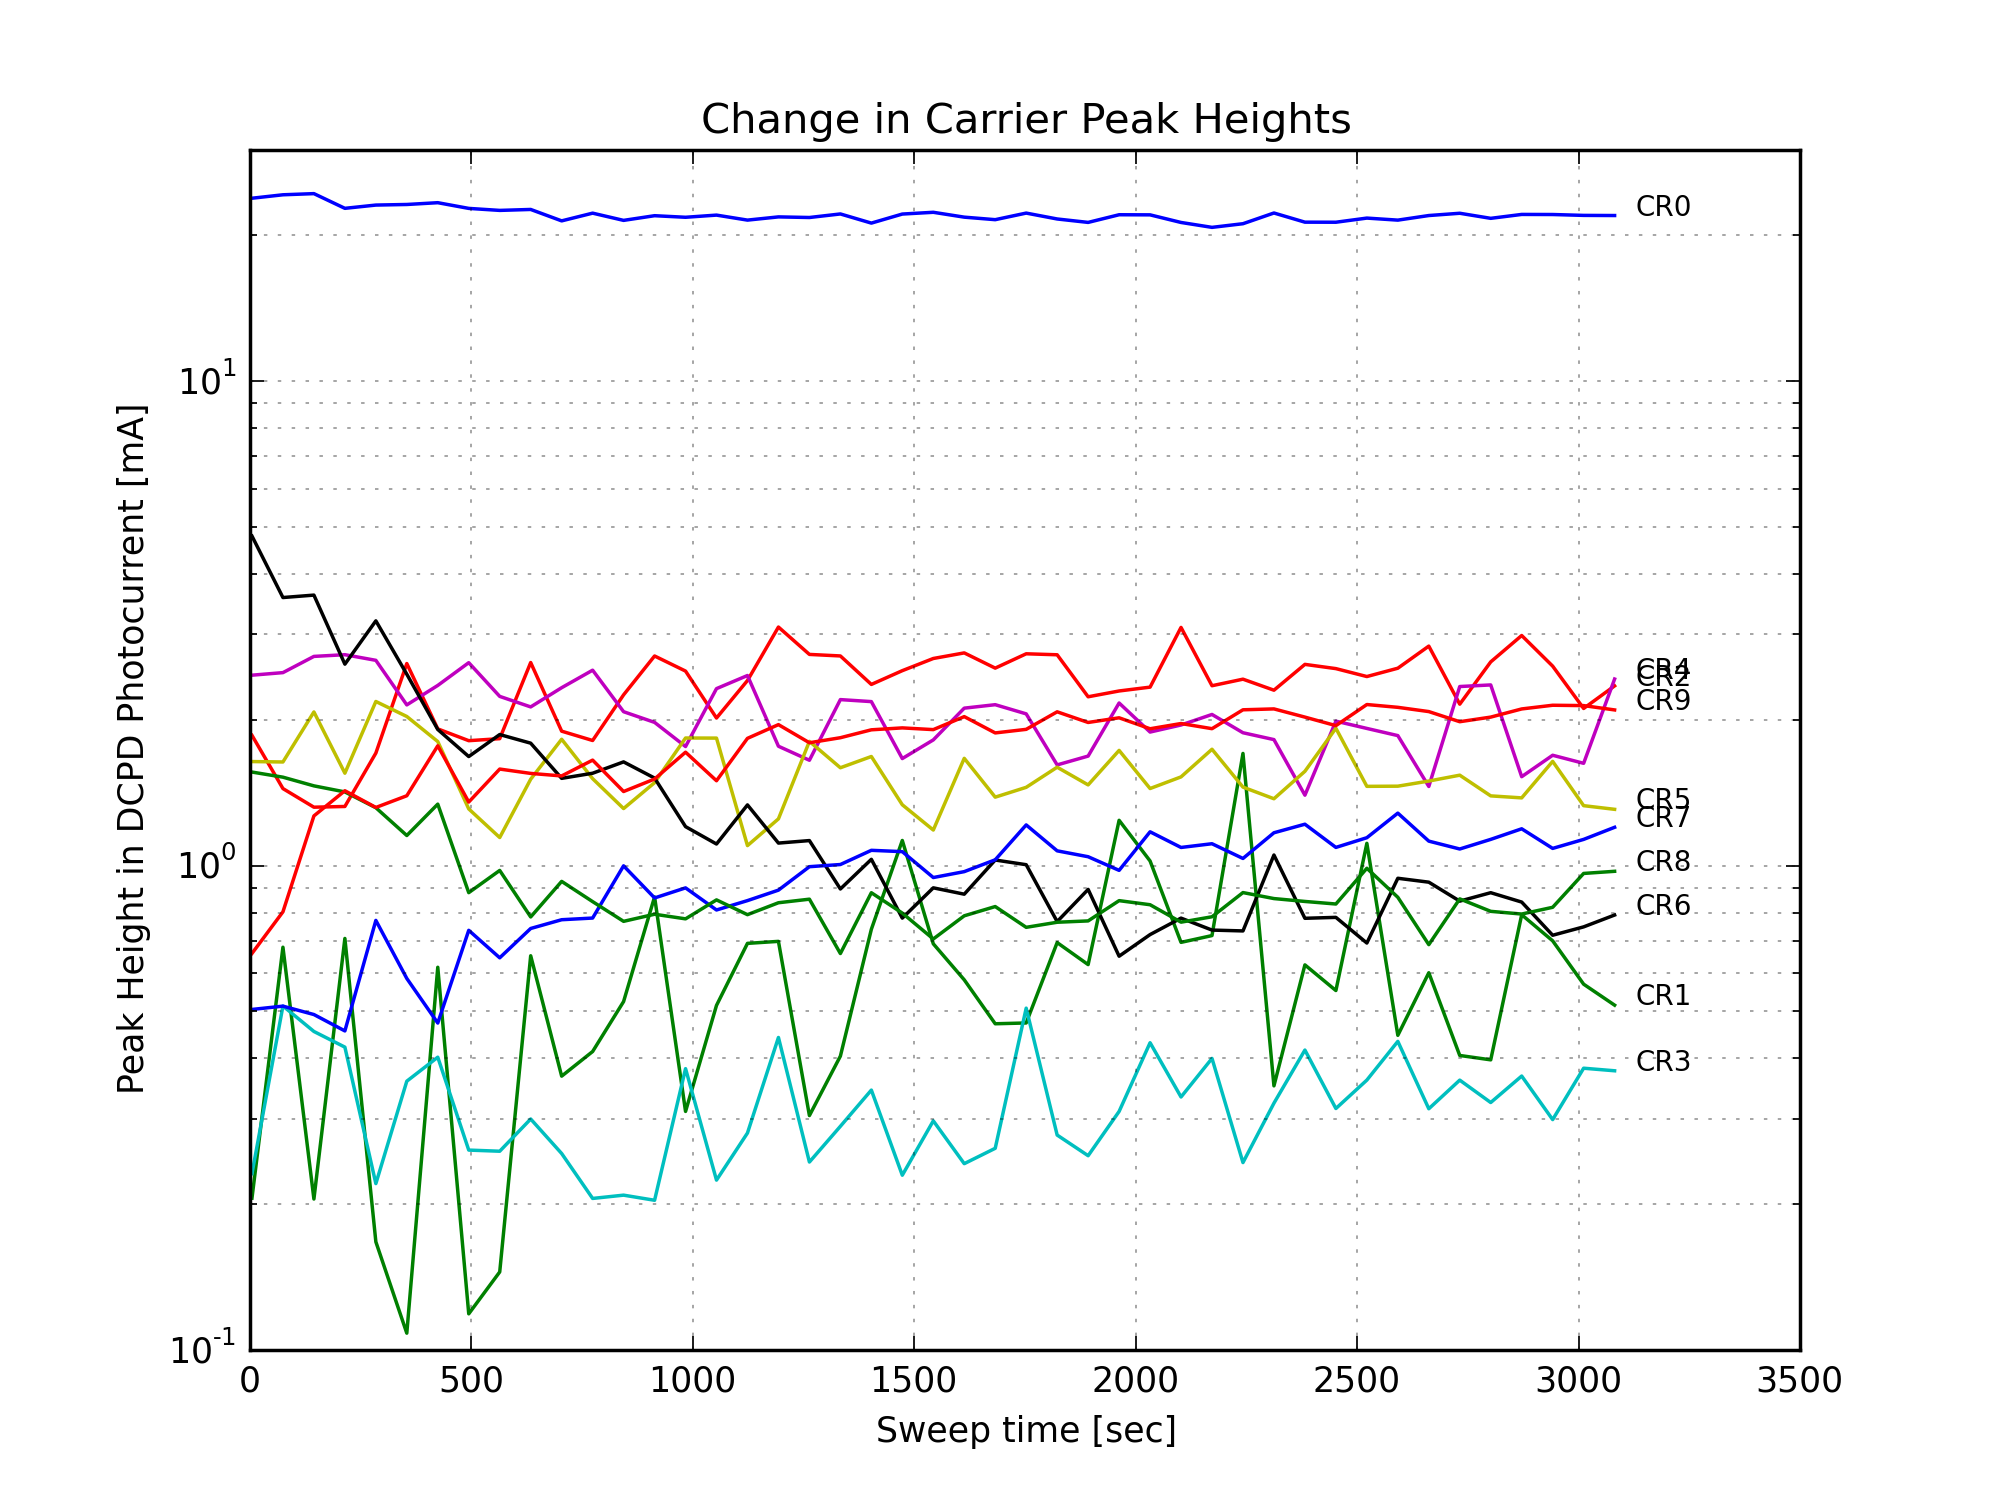
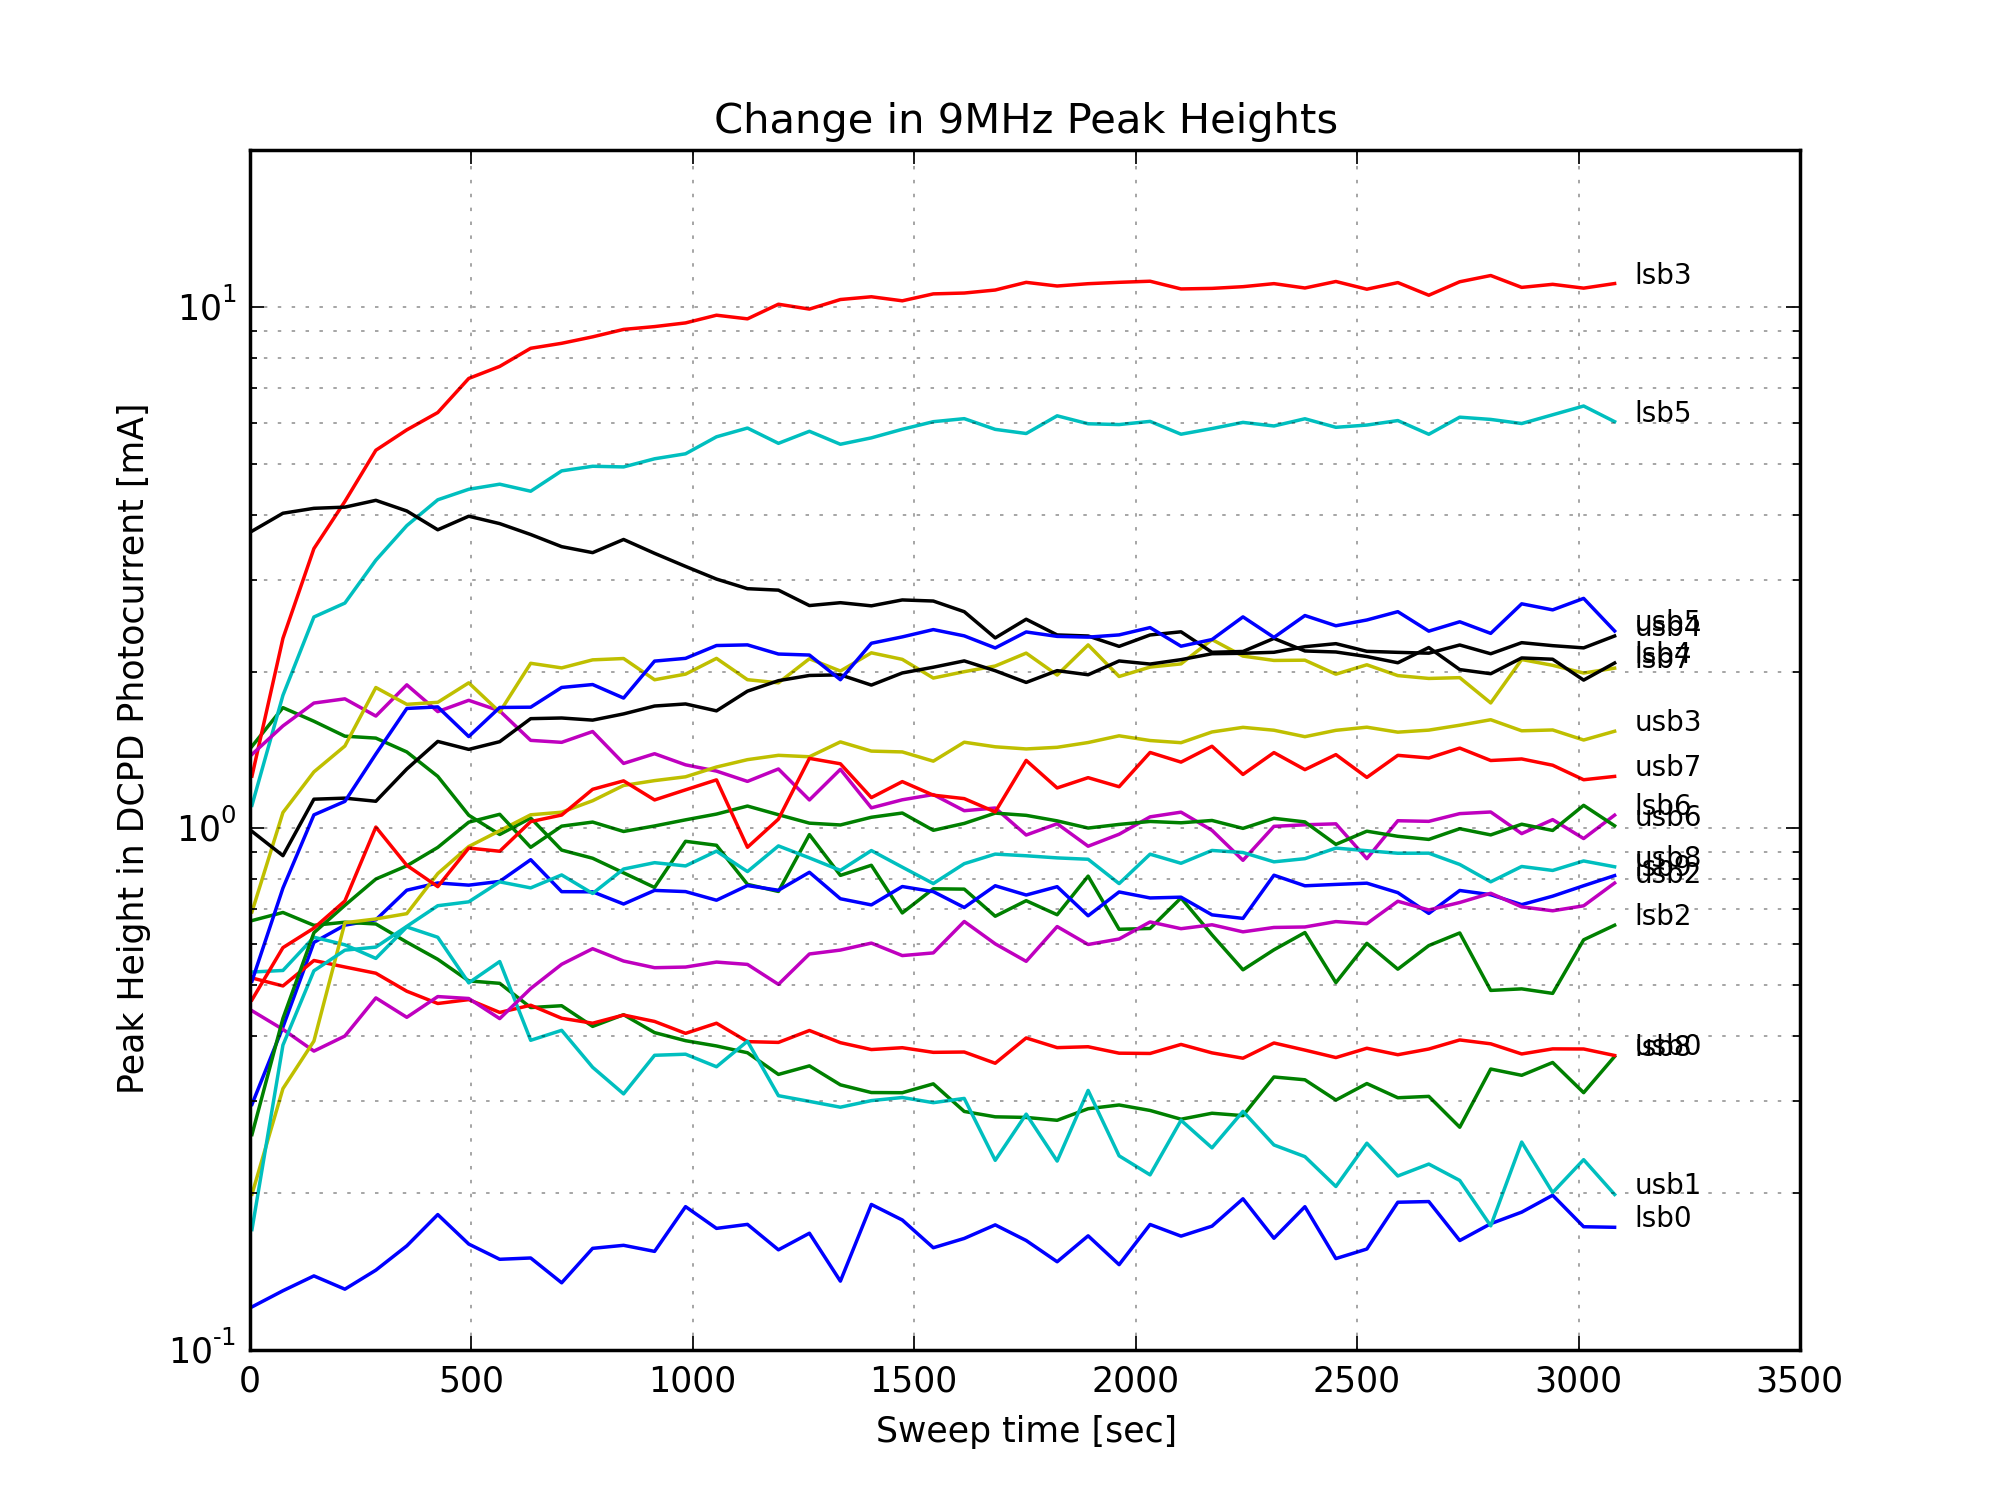
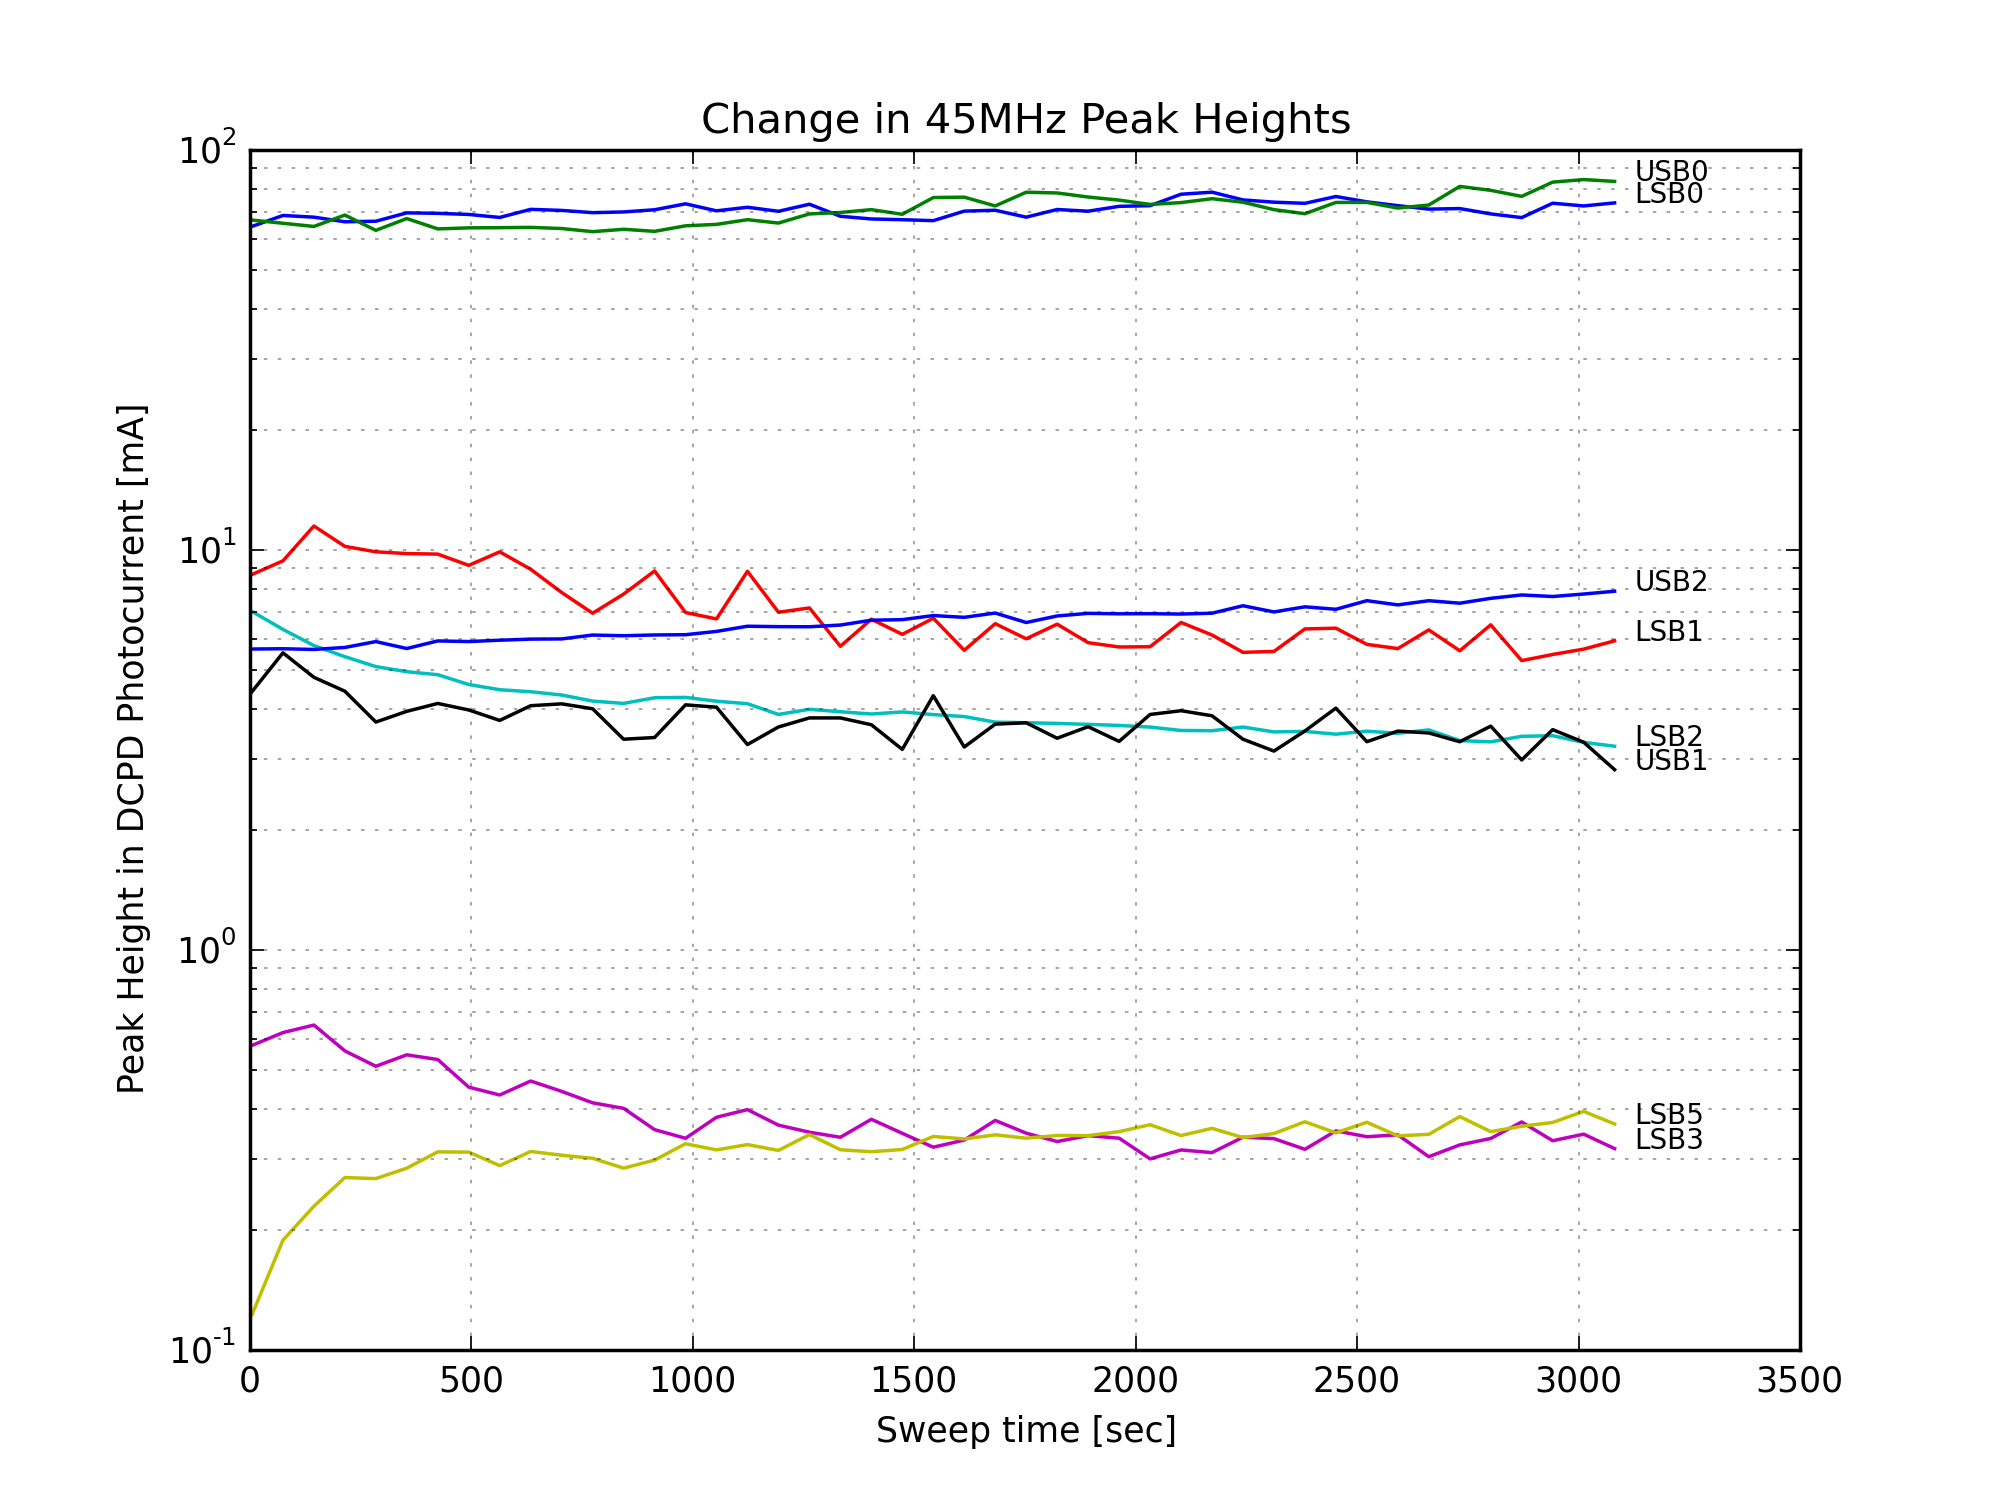
Finally, Figures 11, 12, and 13 show the change in the individual mode heights over time. There is a large increase in the amount of 9MHz HOMs after the power up. (Since the 9MHz light is not well-matched to the OMC, it couples to higher order modes of the cavity.) The 45MHz LSB5 mode increases, but this is a small peak in a fairly noisy part of the mode scan, and might be sensitive to a nearby 9MHz mode. The 6th-order carrier mode loses a lot of power, this is responsible for most of the reduction in carrier power in Fig. 10.
Analysis Code
I have pushed a version of the mode-fitting code to git.ligo.org. This code can’t run on the control room workstations because of the crummy version of scipy that doesn’t have the peak-finding routines, but there is a script included that will download the data with cdsutils, and you can hack away at it on a laptop from there.
Since the beacon dithering required a high sample rate, across one hour of data, most of this analysis was performed on the LHO cluster. The code and results are saved in this directory.