hugh.radkins@LIGO.ORG - posted 11:38, Monday 02 November 2015 (23043)
WHAM1 HEPI Grouted Piers Transfer Functions--Look Better
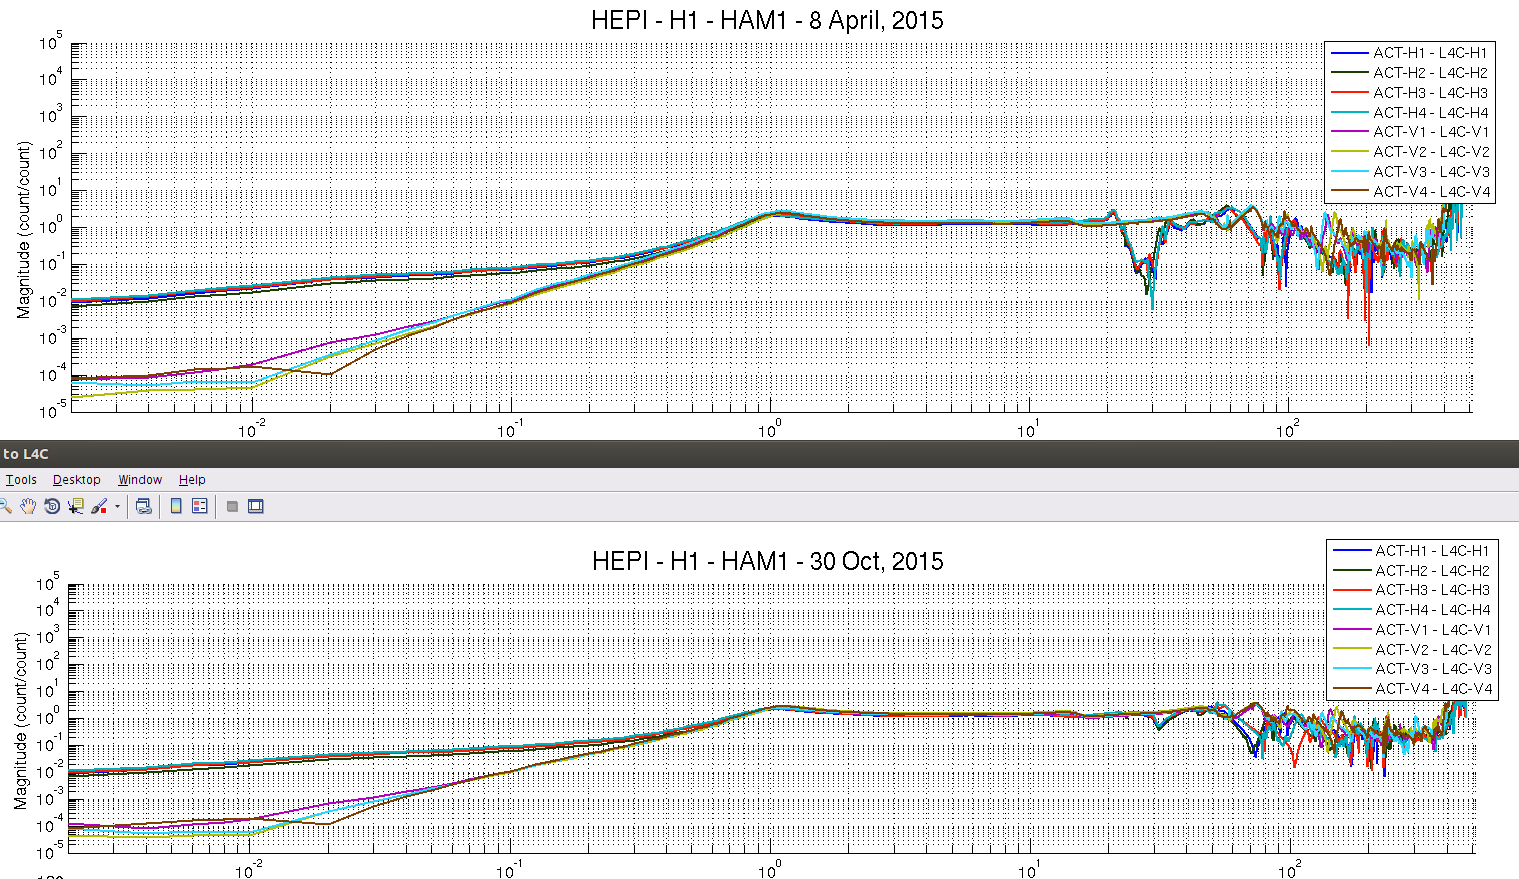
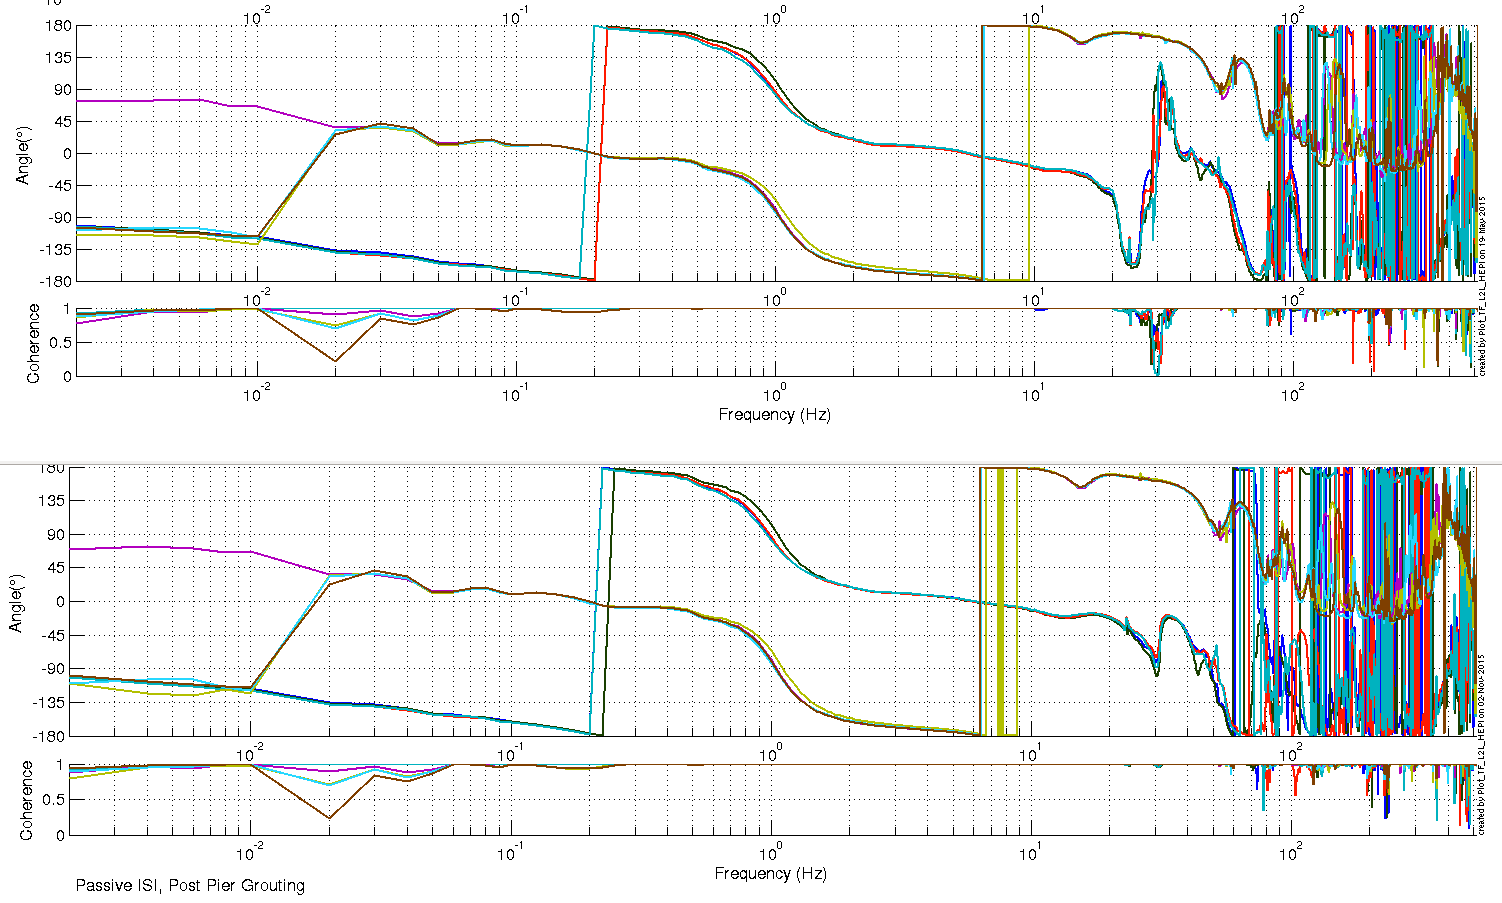
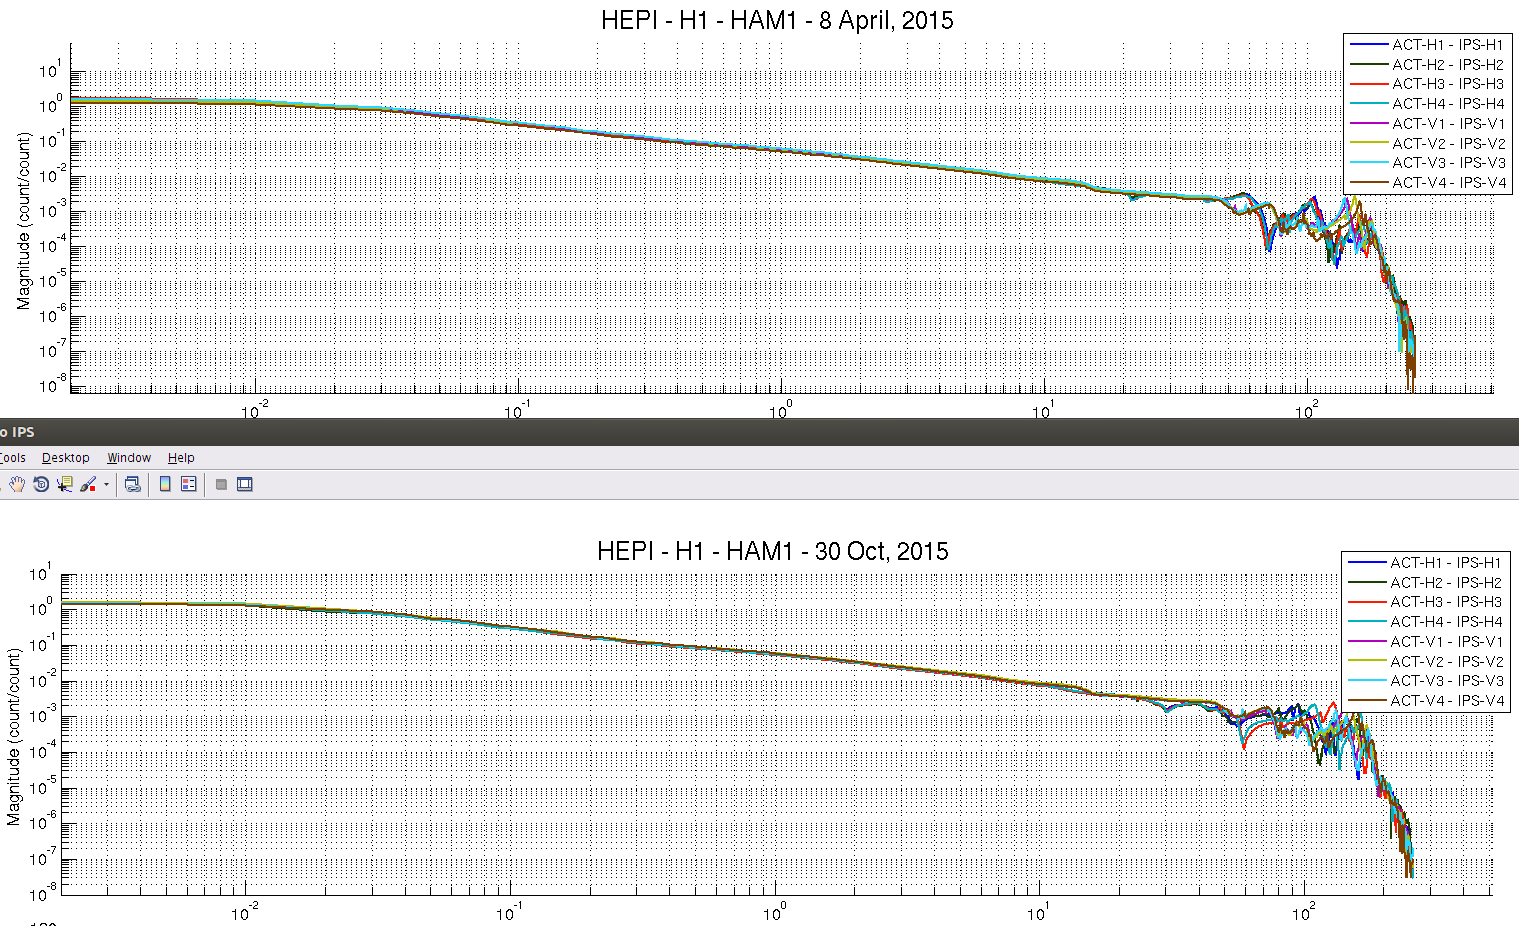
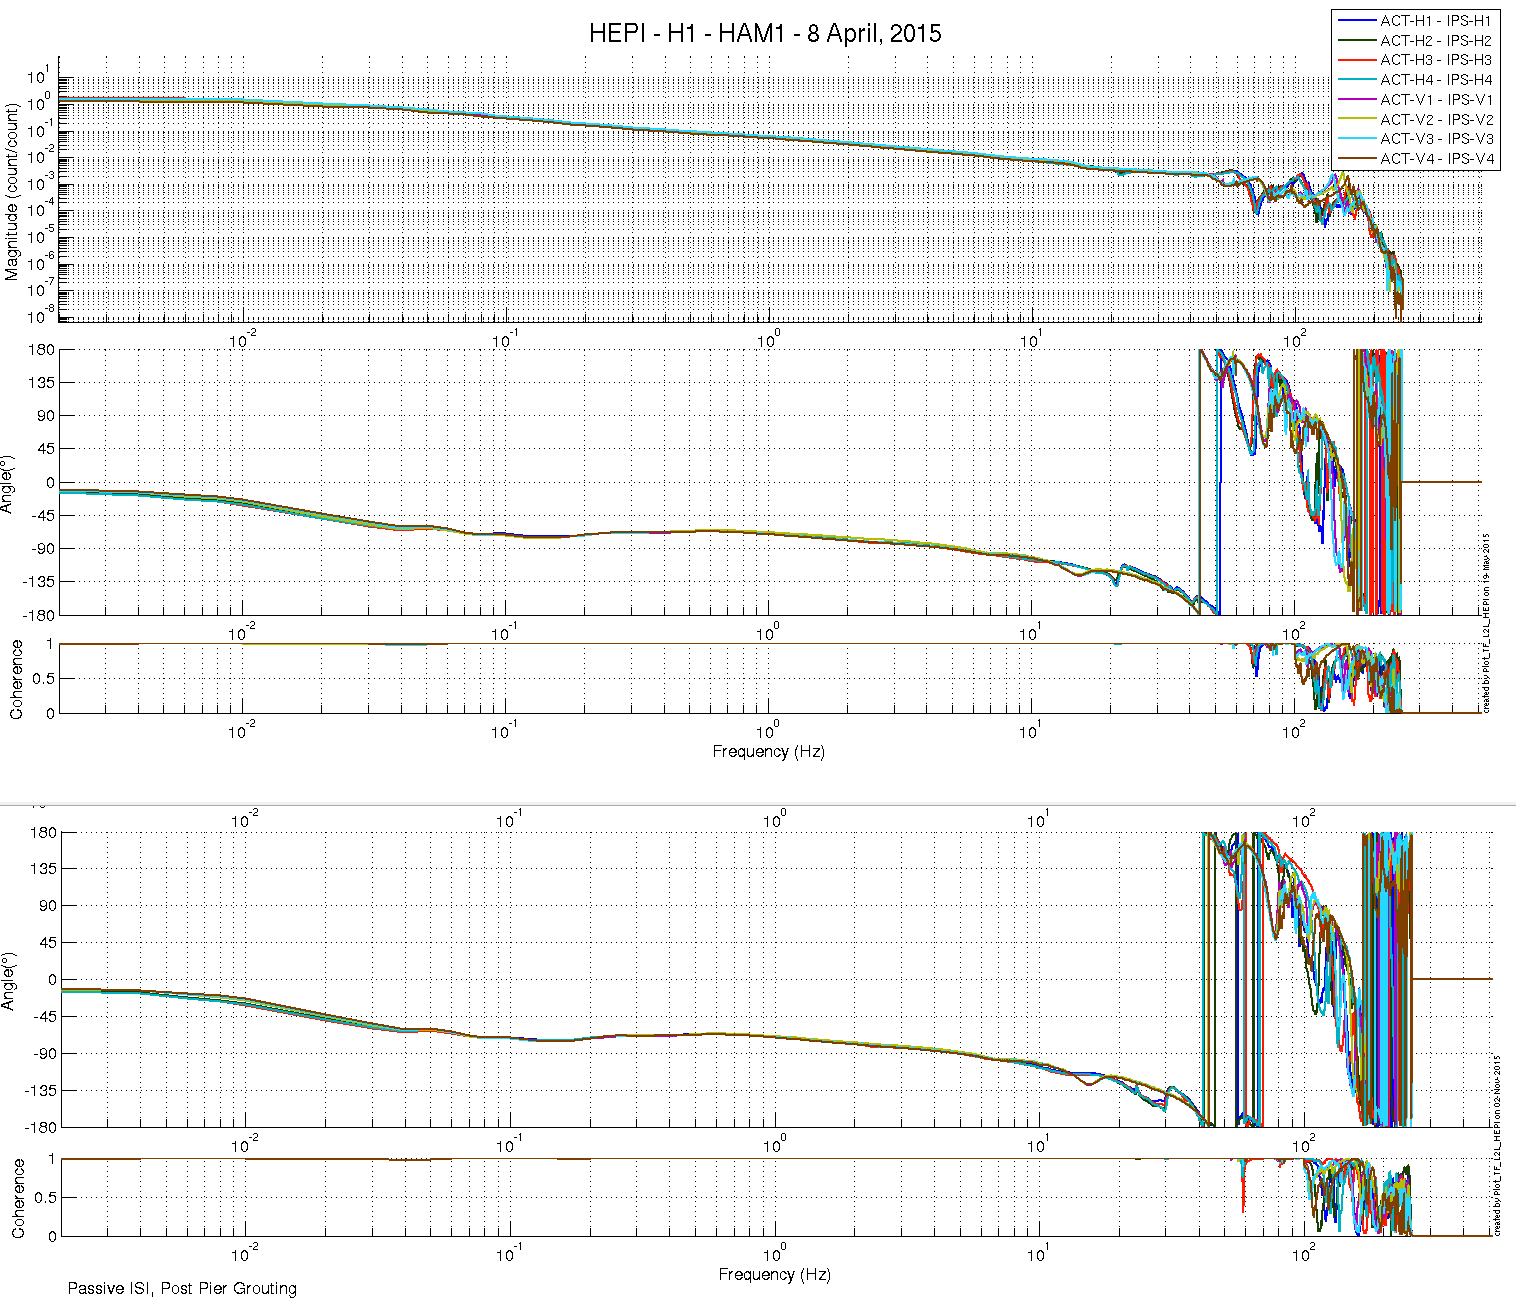
Four attachments here comparing Magnitude & Phase for the L4Cs and the IPS from April 8 and 30 October (before & after grouting.)
The before grouting picture is always in the top panel.
Summary--On the L4Cs, much nicer, cleaner, quieter between 20 & 50hz. There are differences above these frequencies but hard to say if better or worse. For the L4C phase comparison, better coherence and smoother phase. That phase gets to -180 sooner (60 vs 70 hz) though. For the IPS, suttle but a horizontal zero mode might be softer but has moved down from 70 to 60hz. Otherwise, eh. For the phase on the IPS, it gets to -180 about 10 hz sooner, 40 vs 50hz.
Images attached to this report