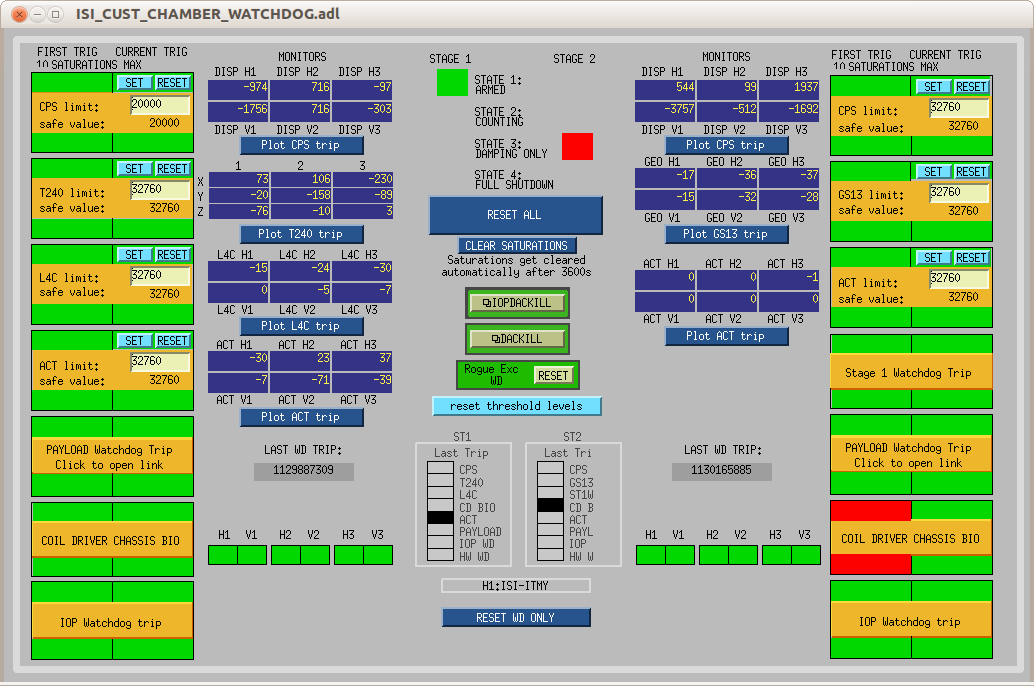
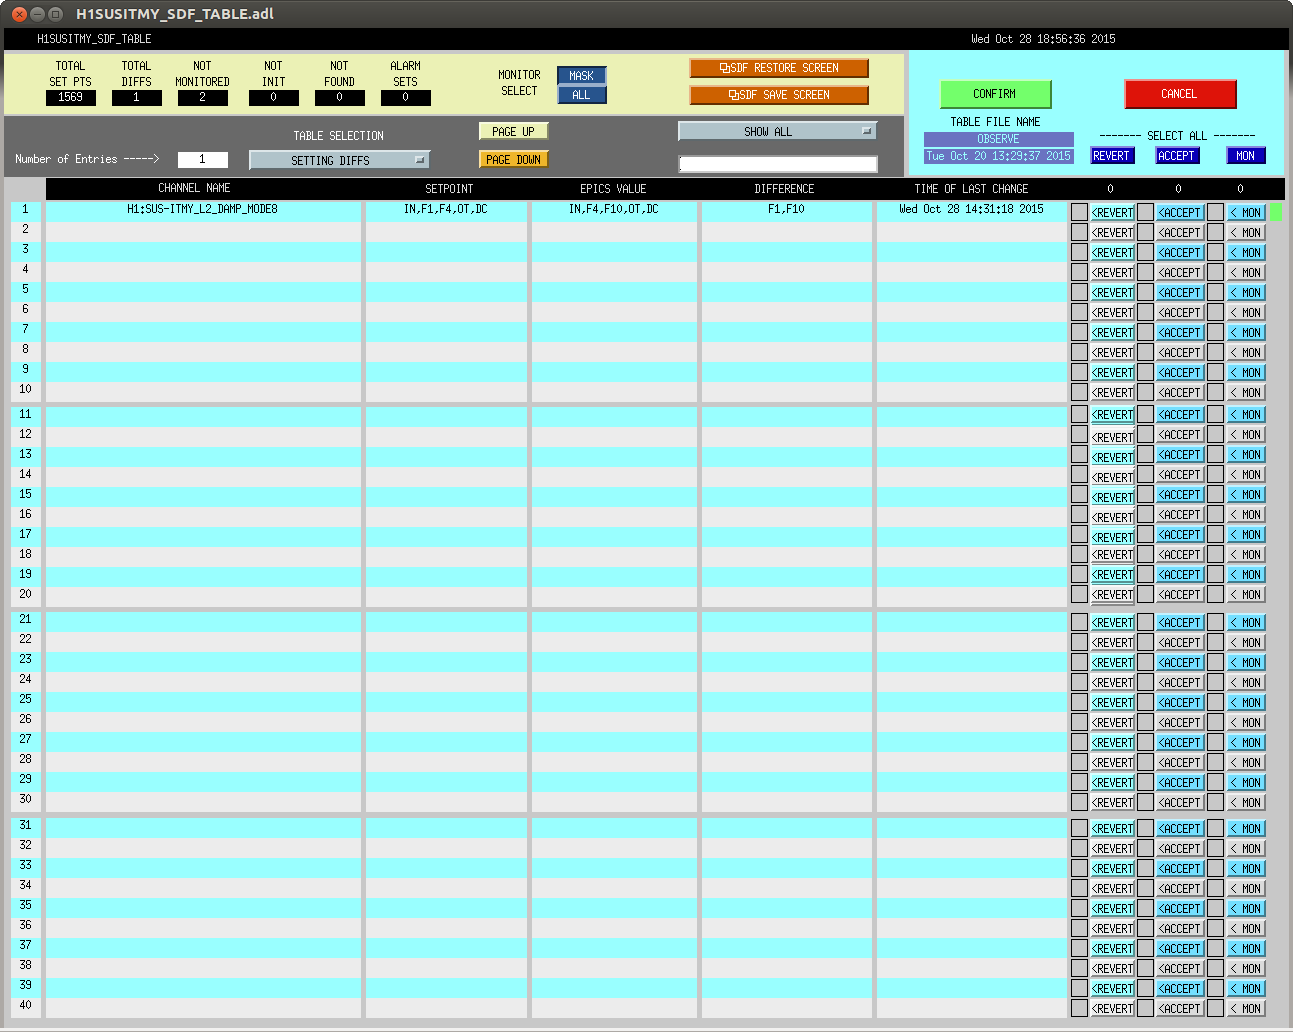
This trip appears to have occured twice with the lock dropping on the first one. The second was about 20 minutes later. The watchdog registers tconvert 1130165885 Oct 29 2015 14:57:48 UTC. The guardian first detected a problem at:
2015-10-29T14:38:52.53819 ISI_ITMY_ST2 [HIGH_ISOLATED.enter]
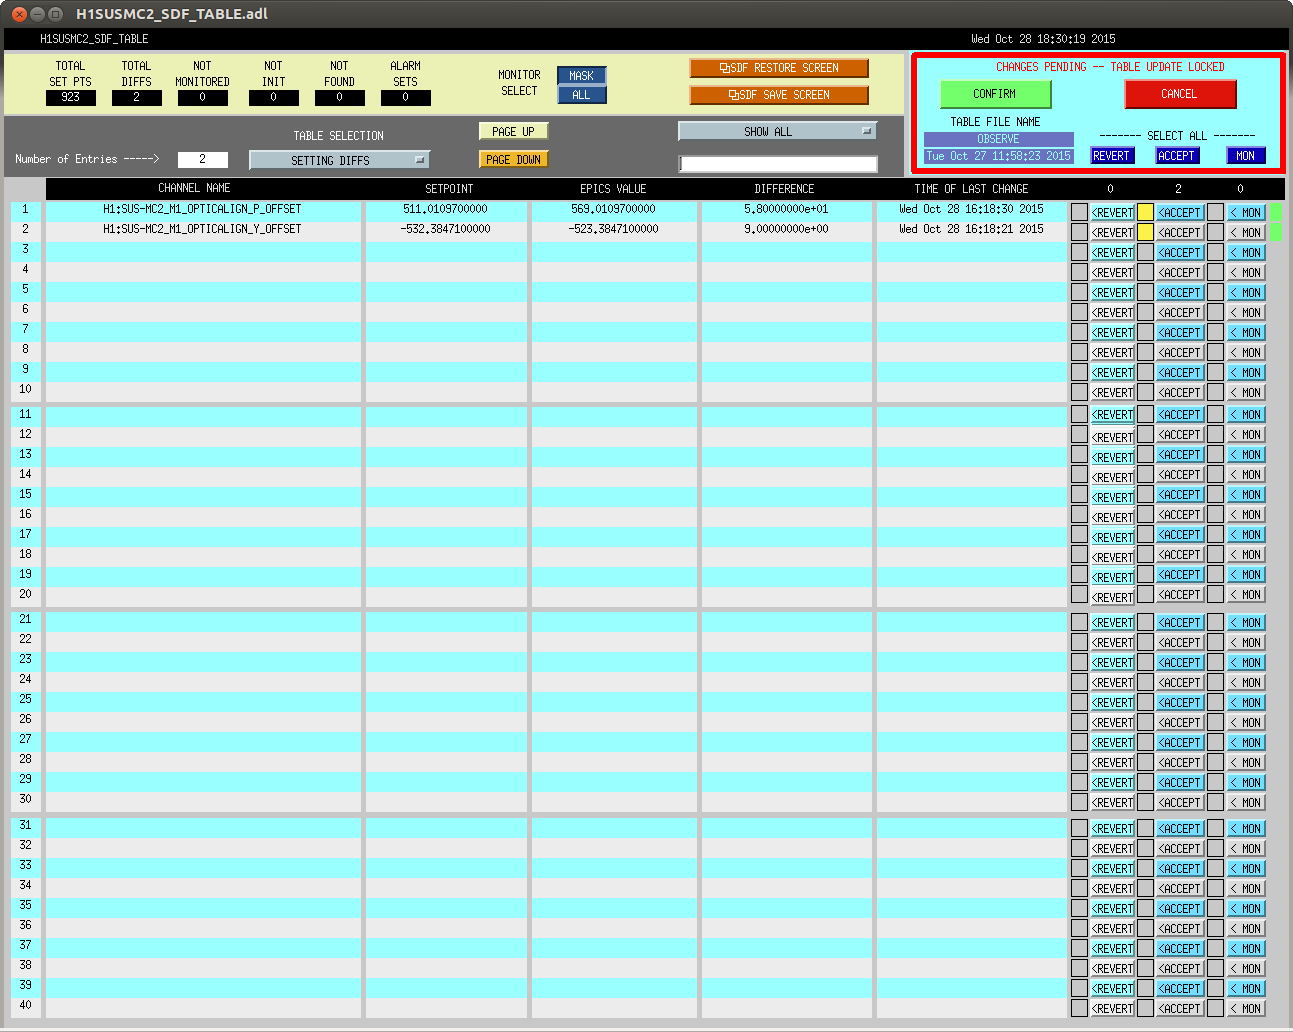
2015-10-29T14:57:49.03752 ISI_ITMY_ST2 [HIGH_ISOLATED.run] USERMSG: SETPOINT CHANGES. see SPM DIFFS for differences
After the WD detected a problem so it doesn't look like the guardian should be suspected.
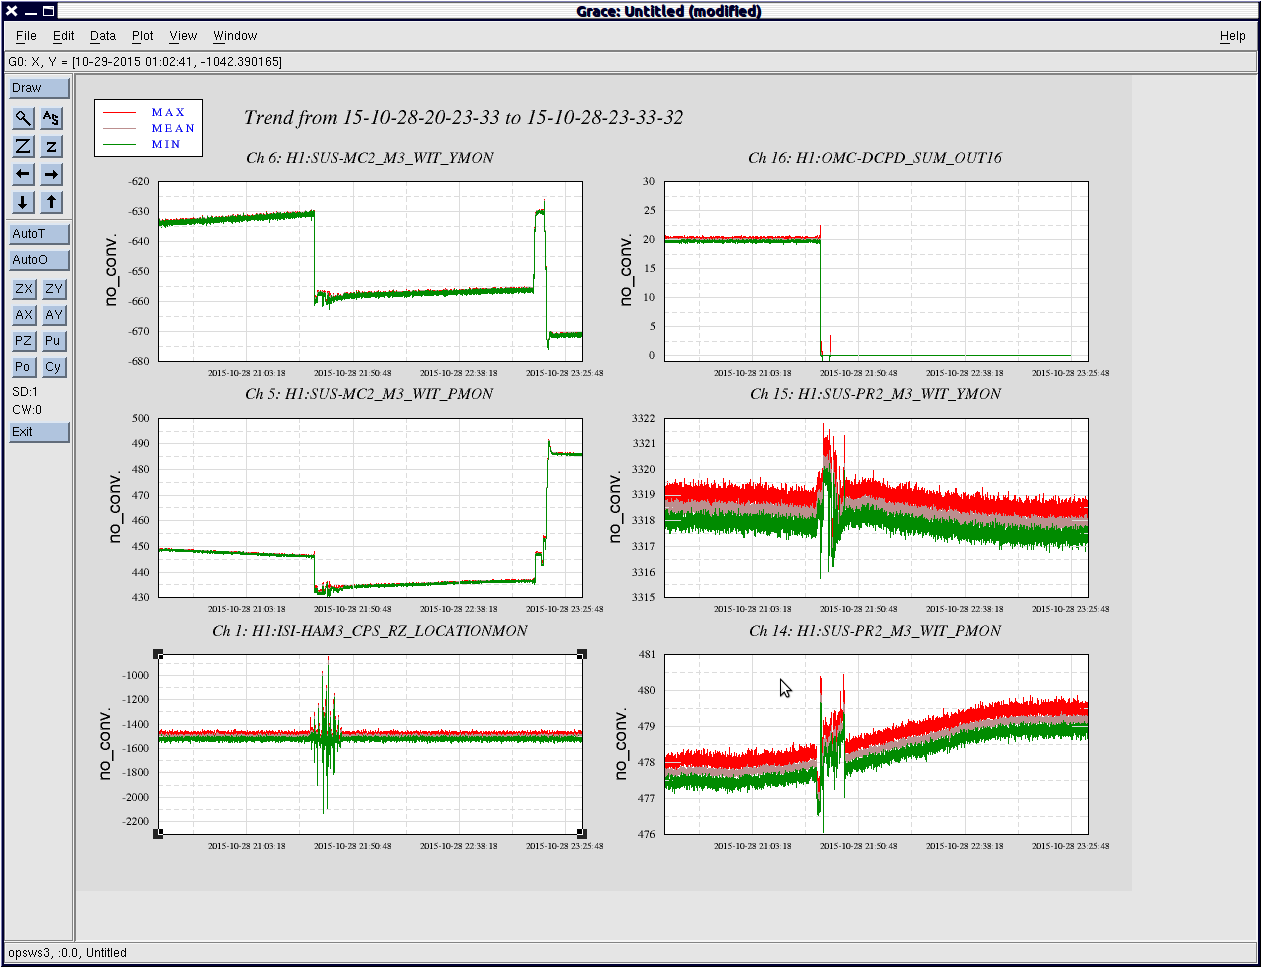
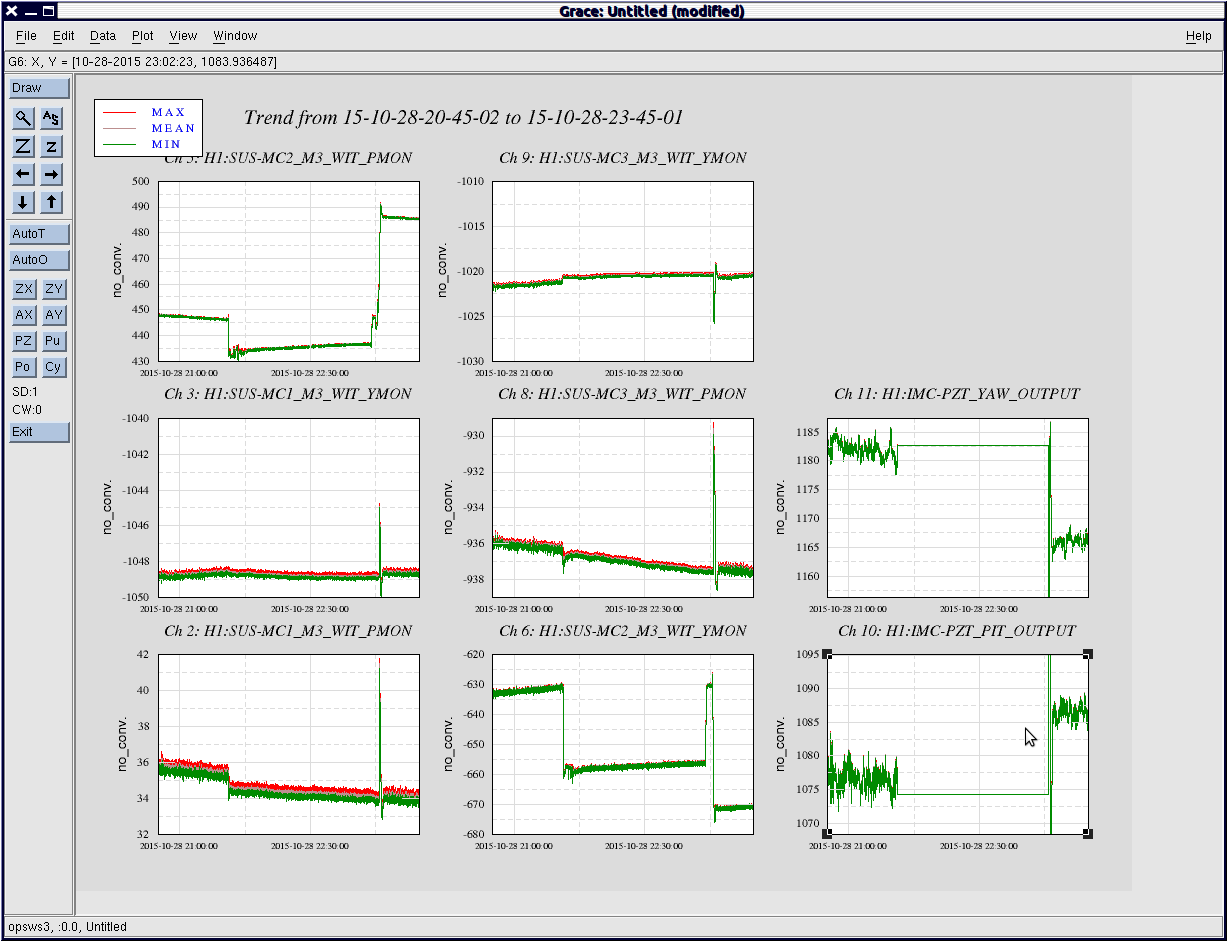
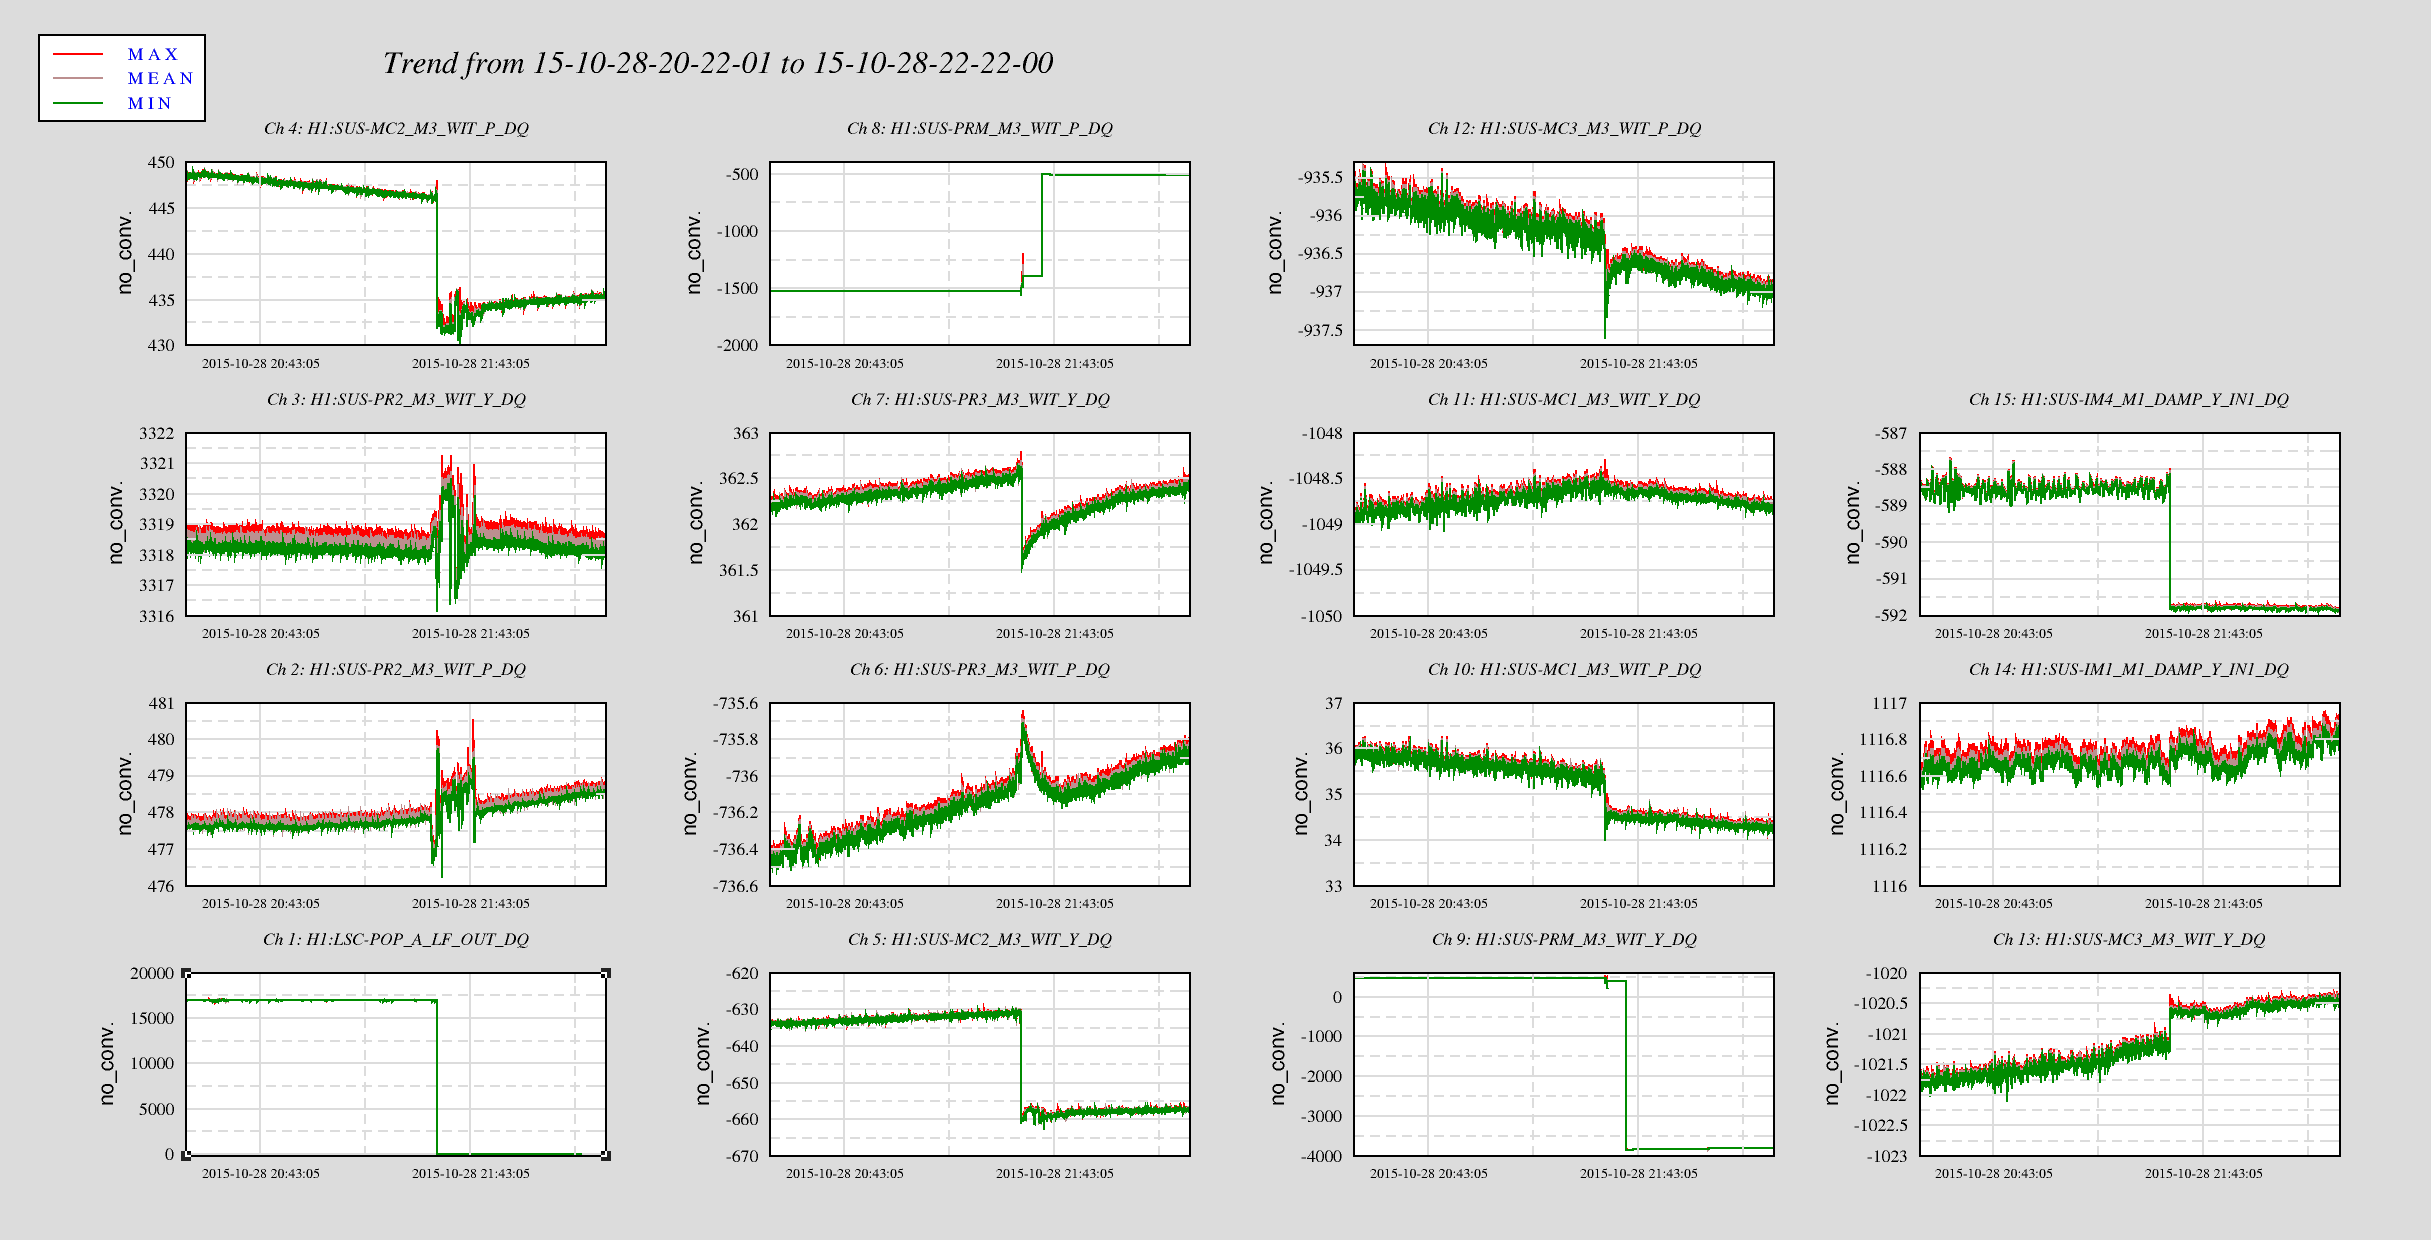
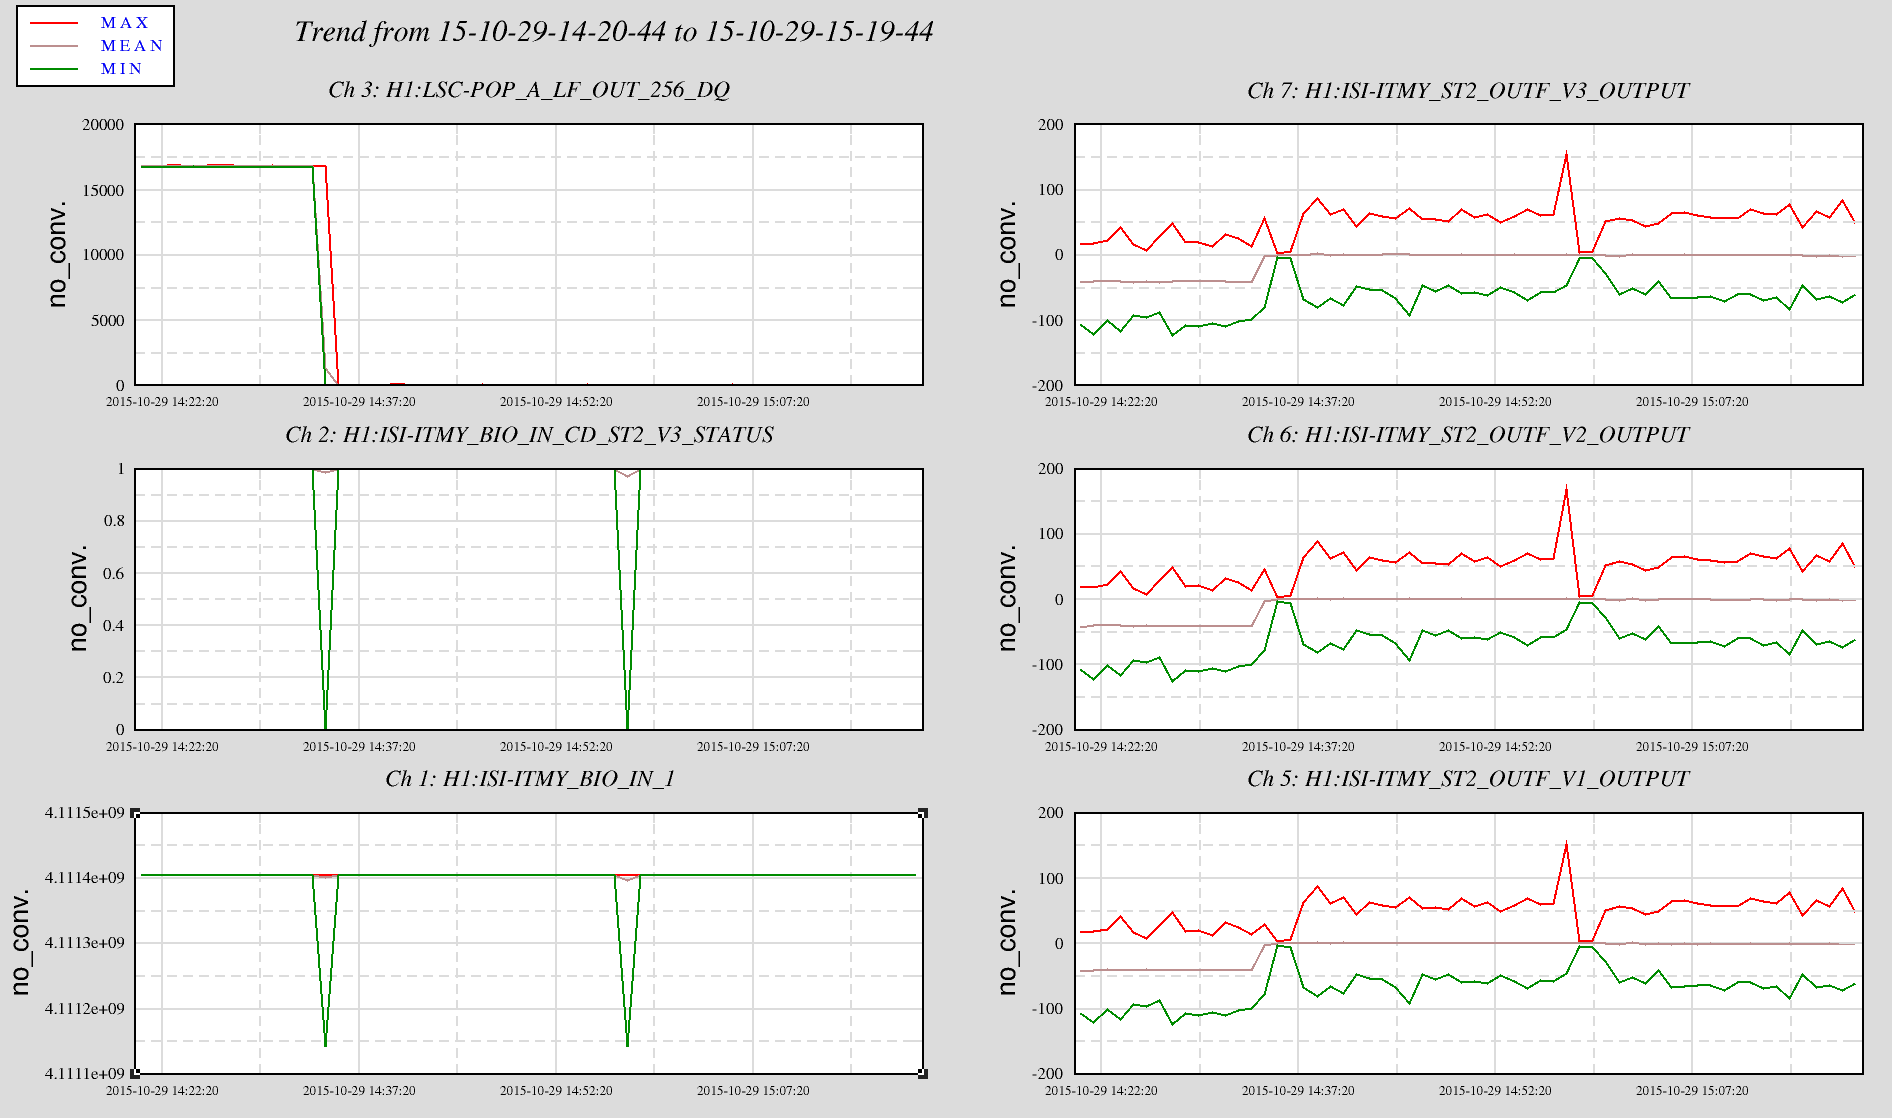
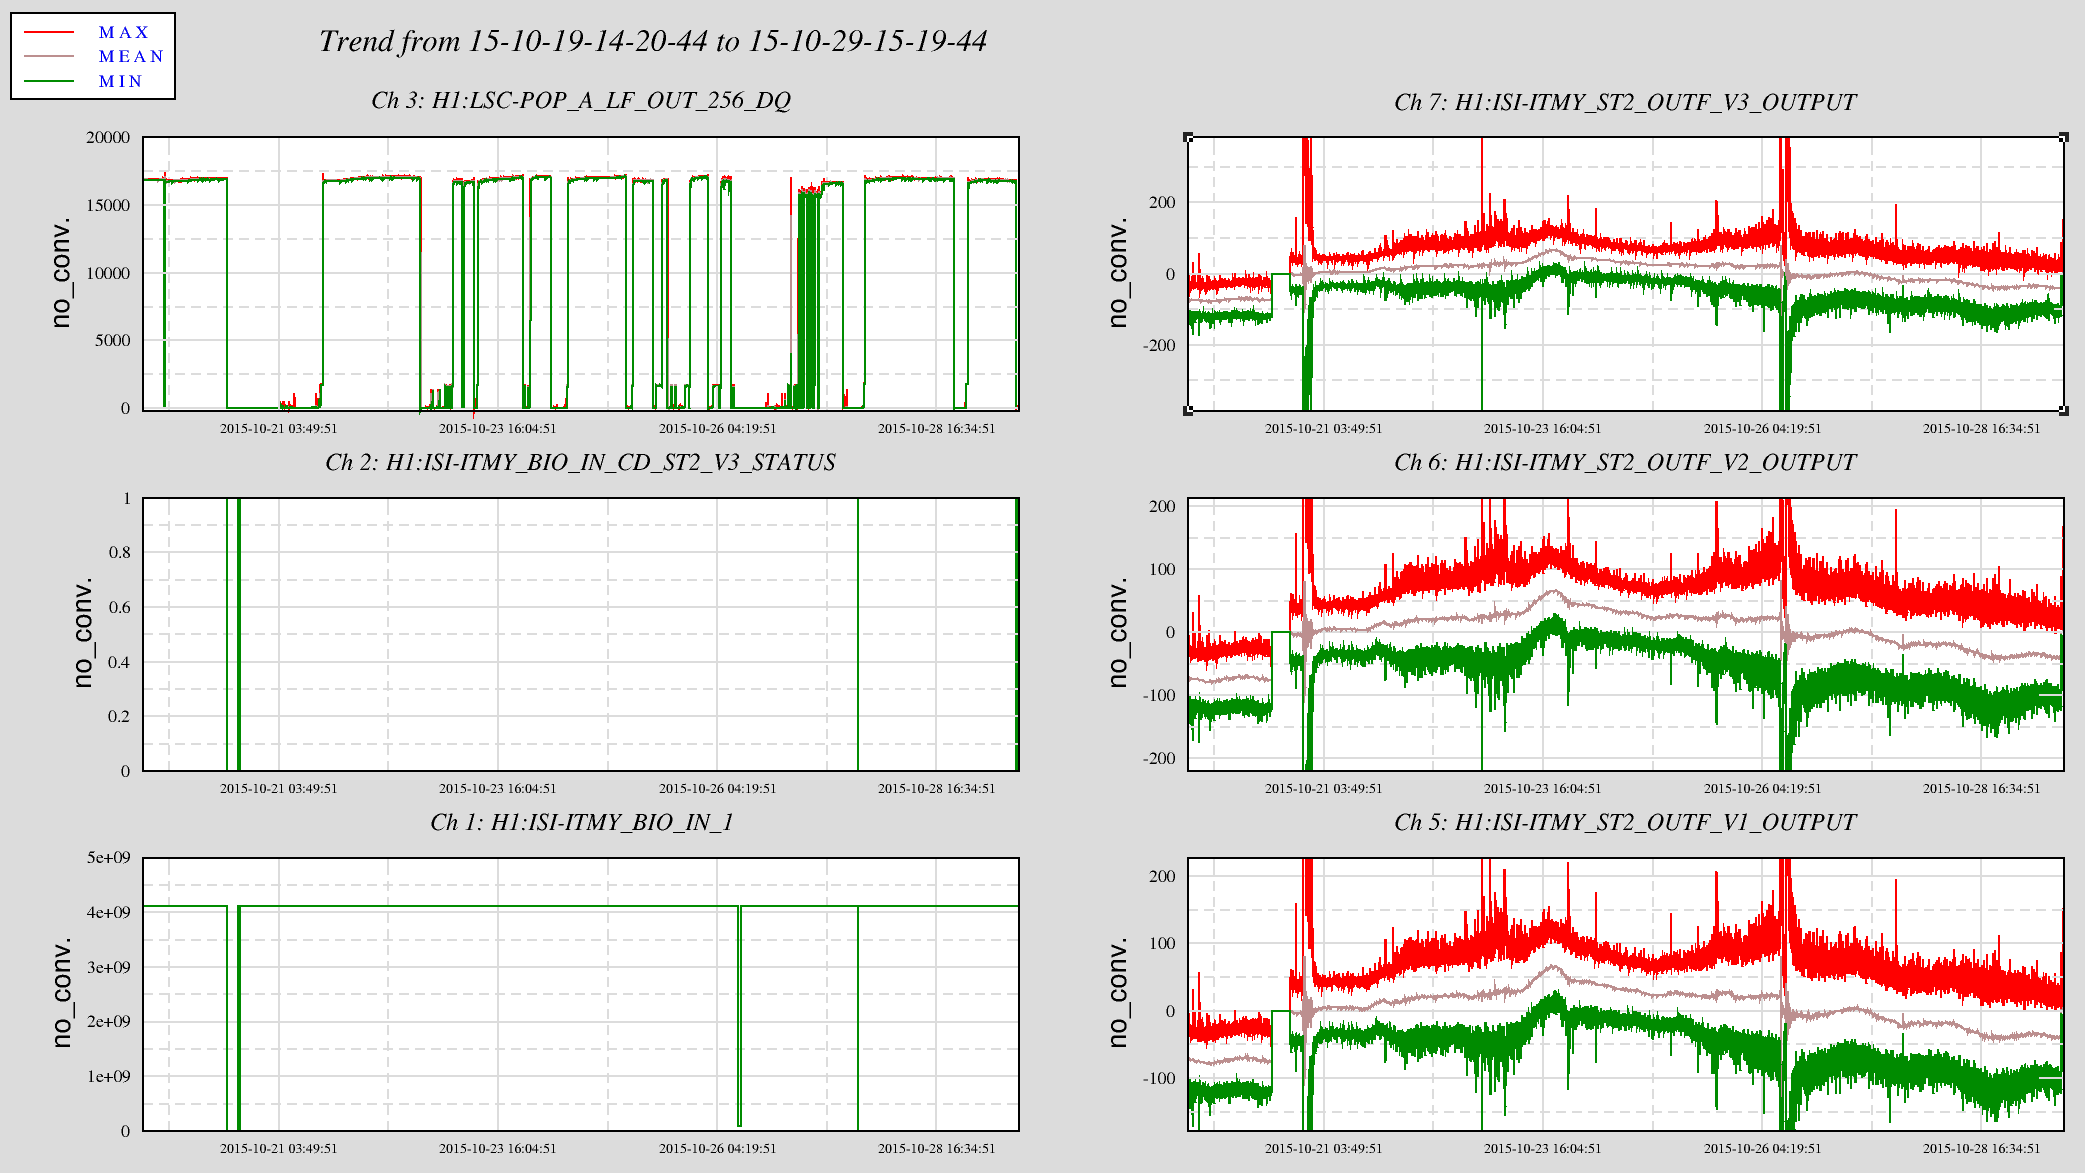
Looking through the Coil Driver BIO channels, the Stage2 V3 CD status is the only element that registers a change. The first attached 1 hour plot shows the BIO signals, the lock loss, and the stage3 coil driver outputs. I don't see the V3 response any different than the V1 or V2 so nothing clear there. The shift to zero is expected as the DC position is reset to zero offset at each Isolation. The second 10 day plot shows this drive reset to zero each time and then slowly drift away from zero during the Isolated period.
Next I'll look through the model for meaning and why.
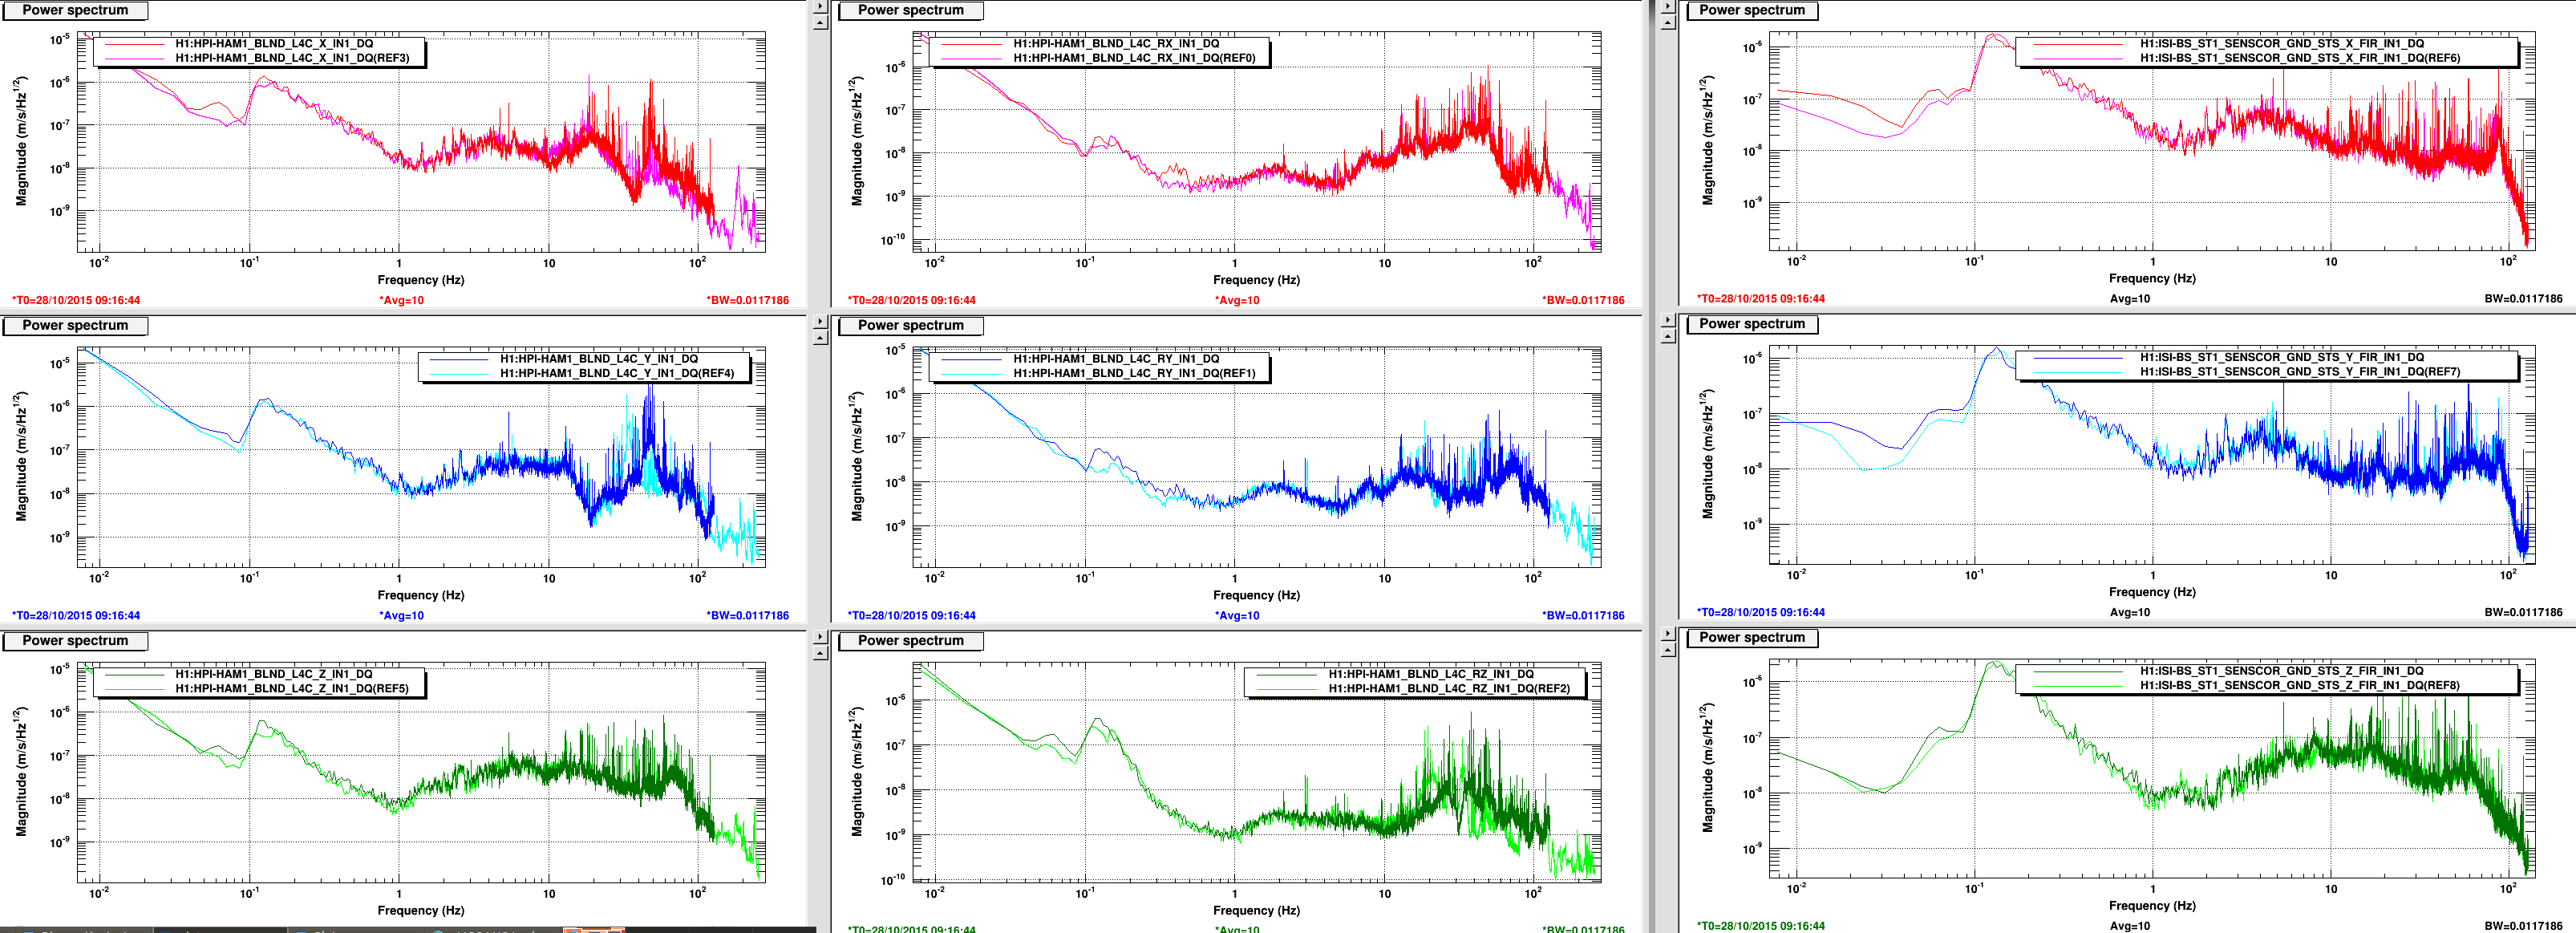
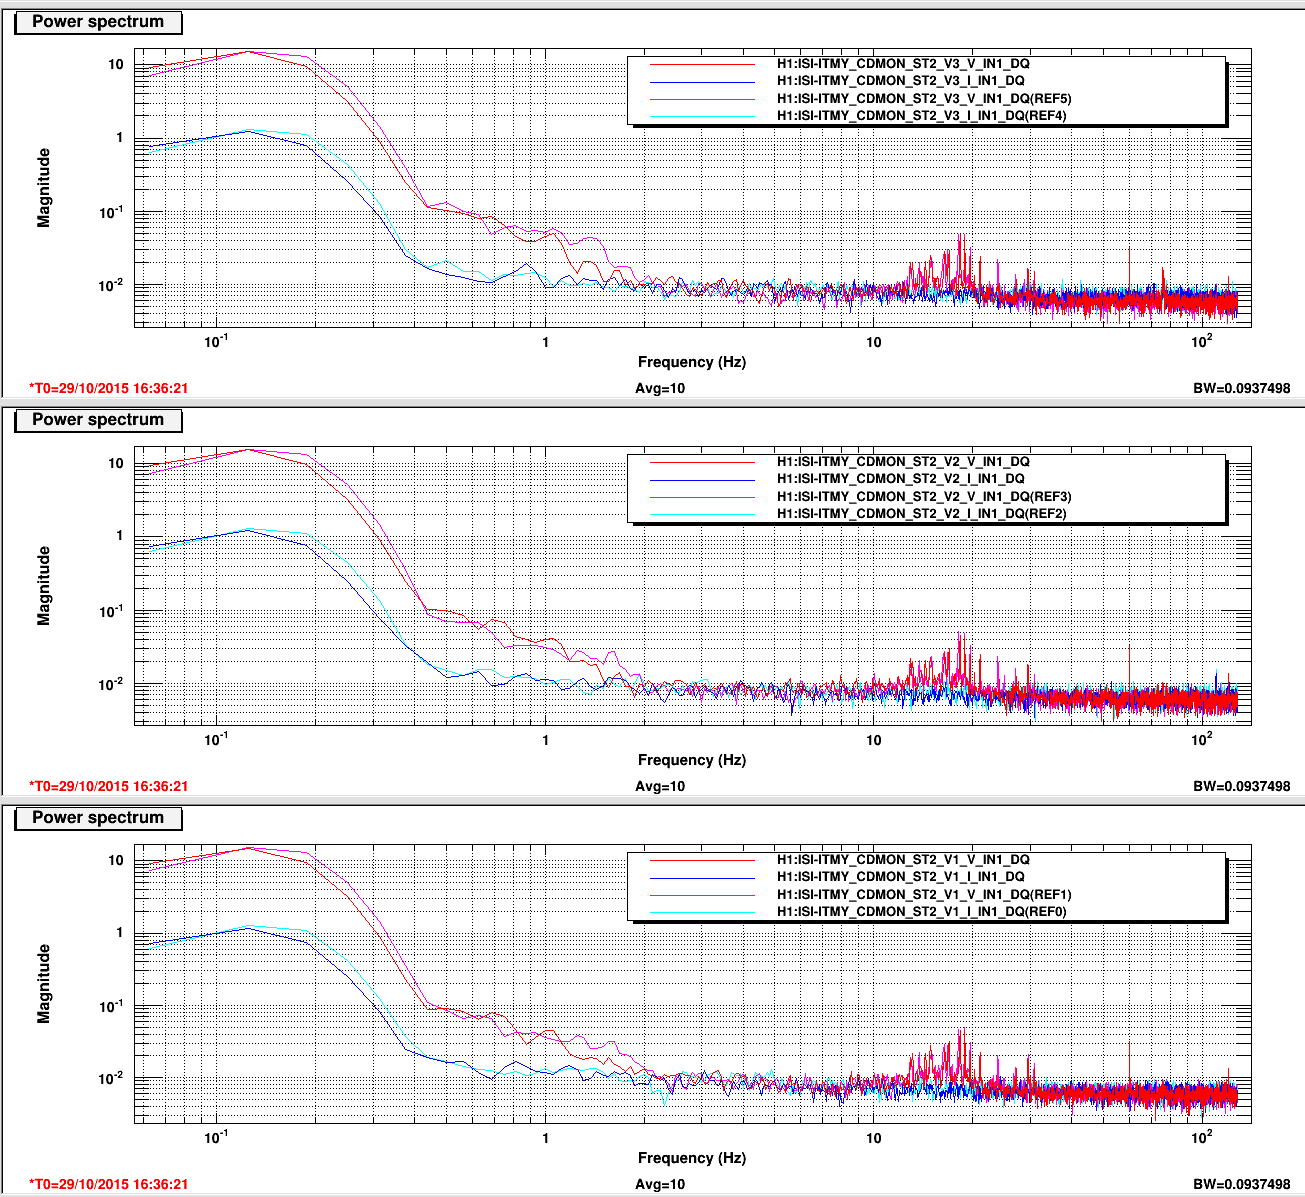
Here are Stage2 Coil Driver Voltage and Current spectra from 3 & 1/2 hours and 10 minutes ago. Reference traces are before the trip. Again, no obvious problem revealed in the current traces.
Looks to me like the coil driver sent a bad status which tripped the watchdog. Hopefully others can weigh in on this too.
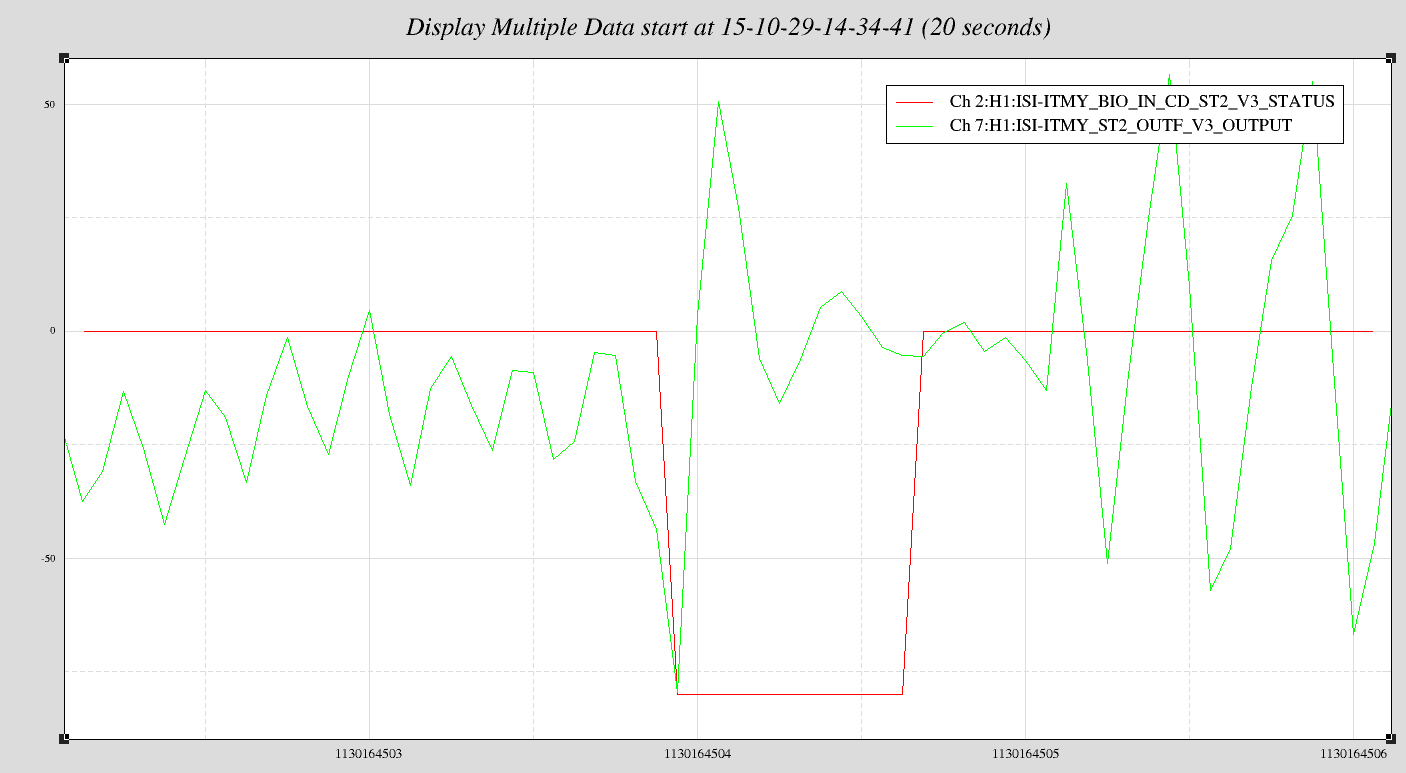
First is the V3 BIO Status (what tripped the WD) and the OUTF Output fro V3. Little hard to tell who/what happened first. The X axis is zoomed in, the status is bad for less than 1 second. As we understand it, this requires a button reset to unlatch. No one was in the CER at the time.
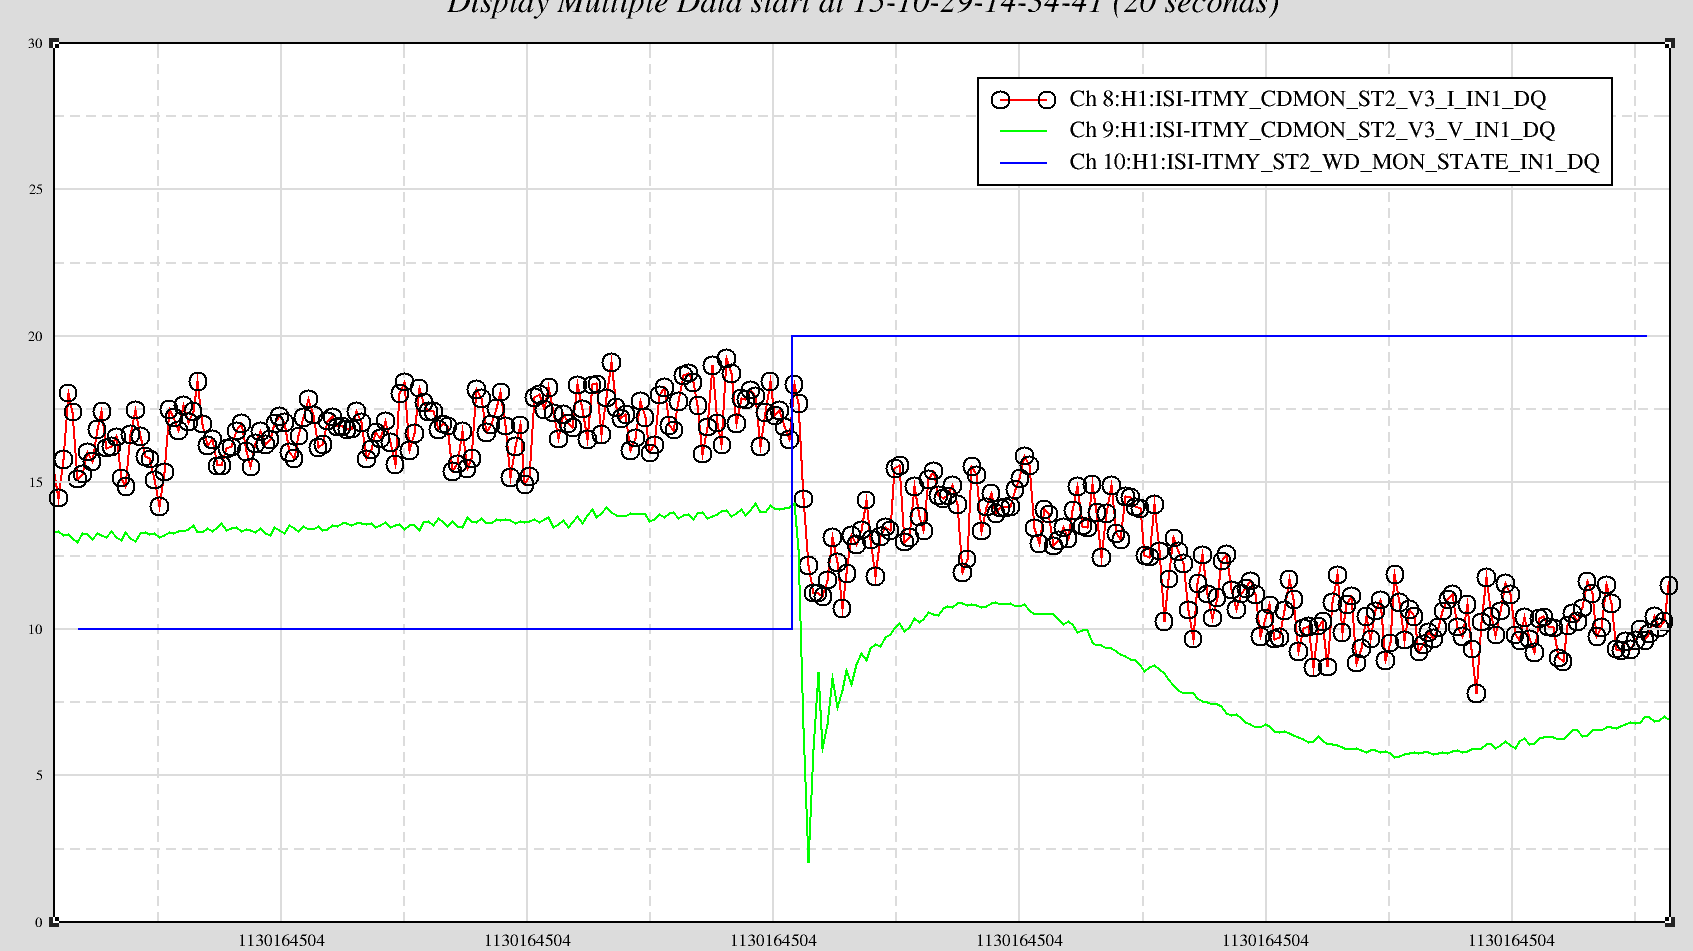
On the second plot here is a zoom into full data. There are the Coil Driver Monitor channels and the WD state. I've scaled the Current and the WD amplitude to better compare times. I've also zoomed into the X axis--this is less than 1 second of data. It sure looks like the Watchdog state change leads Coil Driver Changes. Hope to get some more info from Caltech EE.