WP13042
Jonathan, Erik, EJ, Ryan S, Dave:
This morning we merged the h1susauxh8 model into h1susfc2. This frees up a core such that when the ethernet IPC is installed we will still have 2 free cores for non-rt.
As was done previously when Jeff installed the HAM1 JC[1,3] aux on the h1susham1 model, the AUX parts were installed at the top level of h1susfc2 with underscores in their names (FC2_M1, FC2_M2, FC2_M3) which passes the simulink naming rules and preserves the H1:SUS-FC2_Mx_ channel names.
Also as was found with the HAM1 model, the first attempt to build failed because of duplicate MUX and DEMUX part names between the main model and the aux library models. For example FC2_M1_Mux1 in the control's library block and the AUX's library block. The solution, as had been done previously, was to edit the common library model and rename the MUX and DEMUX parts. Previously we had made up a number, e.g. 100. This time I got the number from today's date, e.g. Mux260303, to ensure uniqueness.
Files modifed for the new h1susfc2:
"path": "sus/h1/models/h1susfc2.mdl",
"svn_rev": 34641,
"path": "sus/common/models/SIXOSEM_T_STAGE_MONITOR_MASTER.mdl",
"svn_rev": 34642,
"path": "sus/common/models/FOUROSEM_STAGE_MONITOR_MASTER.mdl",
"svn_rev": 34642,
Prior to the restarts I verified that the fast and slow channels to be added to h1susfc2 were identical to the existing channels on h1susauxh8 (28 fast, 496 slow). In addition, slow channels associated with the two ADCs used by AUX were accounted for.
Erik made the puppet changes to remove h1susauxh8 from CDS. He also removed it from the testpoint.par file.
Initially we were going to restart the EDC as part of the DAQ restart to move its DAQ send timing to see if we could fix the h1susb13 DAQ 1-leg CRC issues which started last Tuesday. We quickly realized we actually needed an EDC restart to remove the FEC-172 and DAQ SUSAUXH8 channels.
The model change was made with the sequence:
stop all models on h1cdsh8 and fence it from Dolphin
reboot h1cdsh8, new h1susfc2 installed and h1susauxh8 completely removed.
It was at this point we realized the EDC needed an edit for FEC-172 removal. This took longer than anticipated because of a mismatch between old and new DAQ meant python scripts kept installing the aux, so hand editing was needed but at one point puppet undid that. Long story short, it took several rounds of restarts to get the EDC correct.
The DAQ was restarted, and this was also pretty messy. FW1 restarted itself several times, and strangely NDS1 restarted itself after 40minutes of running. We don't think we had seen this before.
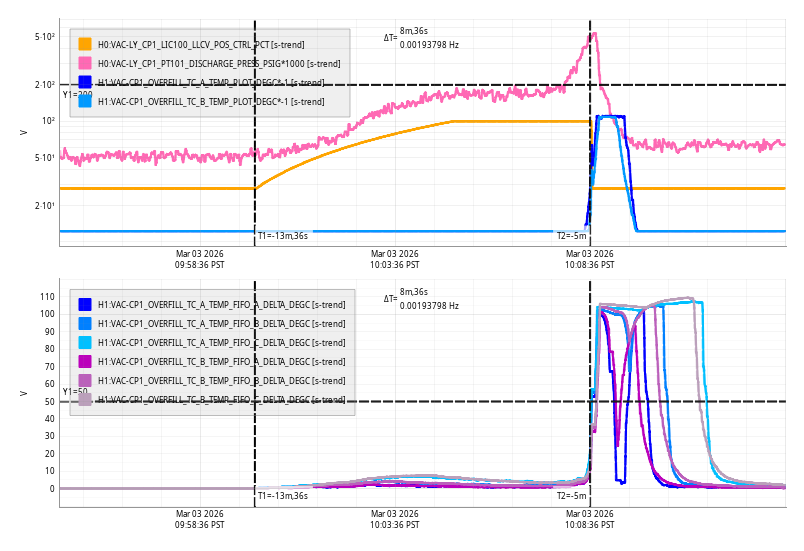
Once the system was stable I wrote a python script to 'activate' the AUX filtermodules to pass the signal through to the OUT_DQ channels. I then trended the 28 DQ channels spanning from when they were on h1susauxh8 to now they are on h1susfc2 to verify they are the same signals, they are.
I updated DAQSTAT to expect 124 dcuids (was 125).


h1susfc2 DAQ data rate increased from 300kB to 500kB per second. Processing time increased by 1uS to 17uS (out of 60uS).
NDS1 restart was caused by 1 second of missed data. Incoming data skipped from 1456605821 cycle 15 to 1456605823 cycle 0. The daqd log is below.
To complete the removal of h1susauxh8 I regenerated the various MEDMs with model lists, e.g. IPC, RCG-ver, load-times and sdf-ref.