travis.sadecki@LIGO.ORG - posted 14:12, Wednesday 21 October 2015 (22727)
Back to Observing Mode
Observing Mode at 21:12 UTC.
Observing Mode at 21:12 UTC.
We have a few piece of evidence that suggest that anthropegenic noise (probably trucks going to ERDF) couples to DARM through scattered light which is most likely hitting something that is attached to the ground in the corner station.
On monday, Evan and I went to ISCT6 and listened to DARM and watched a spectrum while tapping and knocking on various things. We couldn't get a response in DARM by tapping around ISCT6. We tried knocking fairly hard on the table, the enclosure, tapping aggresively on all the periscope top mirrors, and several mounts on the table and nothing showed up. We did see something in DARM at around 100 Hz when I tapped loudly on the light pipe, but this seemed like an excitation that is much louder than anything that would normaly happen. Lastly we tried knocking on the chamber walls on the side of HAM6 near ISCT6, and this did make some low frequency noise in DARM. Evan has the times of our tapping.
It might be worth revisiting the fringe wrapping measurements we made in April by driving the ISI, the OMC sus, and the OMs. It may also be worth looking at some of the things done at LLO to look accoustic coupling through the HAM5 bellow (19450 and
Out of Observing Mode for jitter measurements while LLO is down.
Received a verbal GRB alert at 19:00 UTC. Unfortunately, LLO was down at the time.
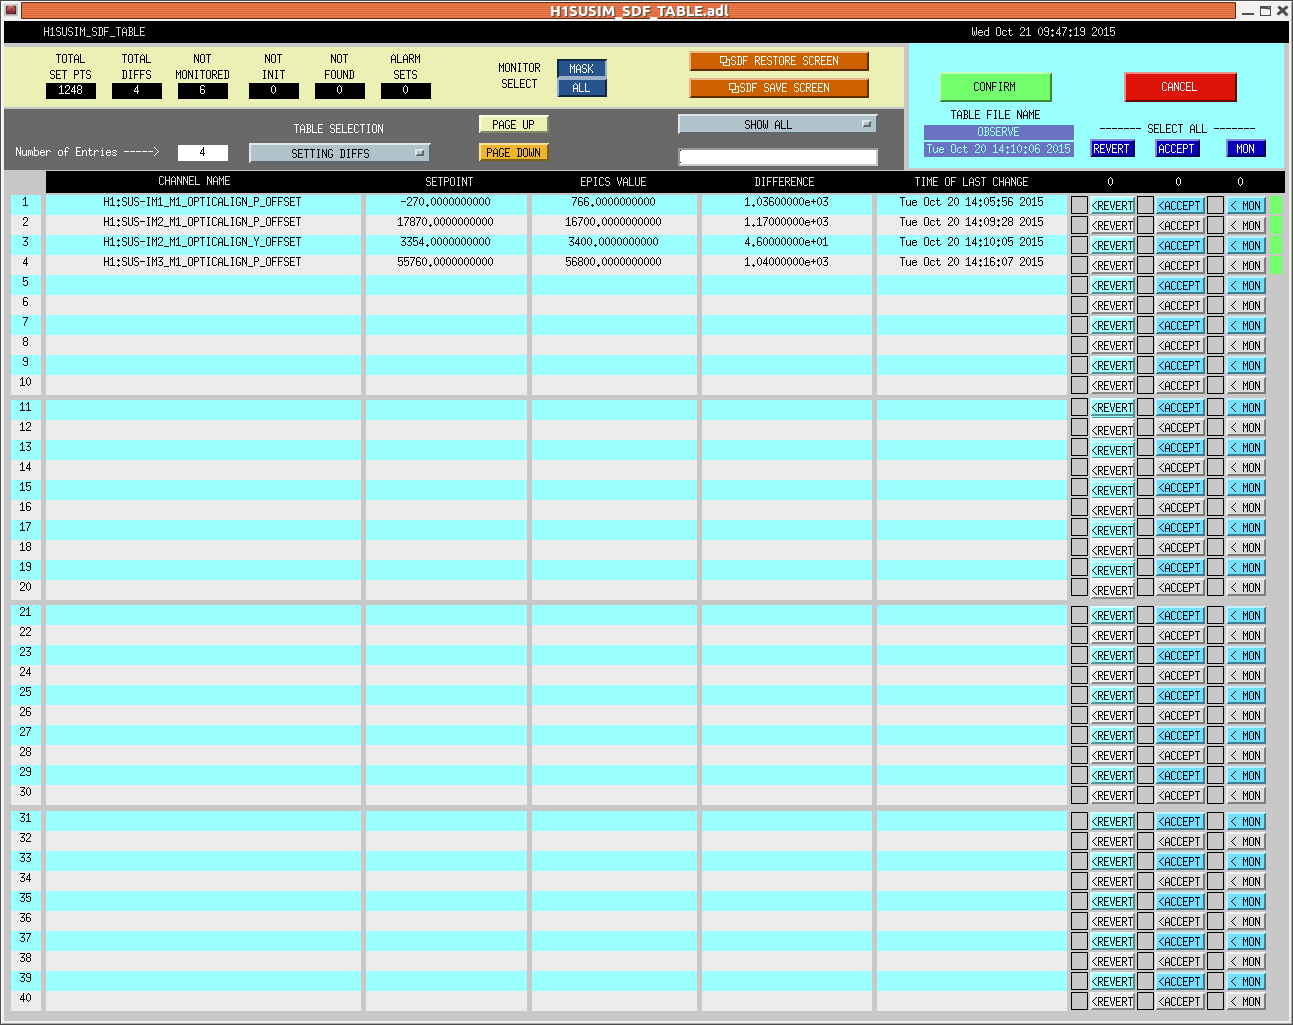
Keita, Evan, Hugh, Kiwamu,
When clearing the SDF differences, we noticed that the pitch bias offset of IM1, 2 and 3 are very different from the past (by ~ 1000 urad). These new offsets are the results of an alignment recovery effort by Cheryl at around 2 pm PT yesterday.
We checked various trends to understand why IMs needed so much change in the bias, but no clue was found. In the end, we accepted the new IM alignments even though we do not understand why they had moved. See the attached for the SDF difference.
The recovery effort
It looks that yesterday Cheryl changed the bias of IM1, 2 and 3 in order to bring them back to a place where their OSEMs read the same alignment values. As written below, after the interferomter was fully locked in this morning, the relevant QPD signals indicated that the laser light hits the same postion in the HAM2 and HAM3 area. This means her alignment recovery really aligned the beam back to where it should be. Or, in other words, IMs really had moved during the power outage for some reason. We still do not know why IMs had moved.
QPDs do not indicate a significant change
We checked the IM4 trans and POP_B QPDs in full lock to see if there is a significant difference in the actual laser beam. It seems that they are back to where they were in the past. This means that the interferomter alignment is not significantly different from the past with the new IM alignment. Good.
Also we looked at the HAM2 ISI oplev. Even though the oplev beam was not centered, we did not see a major change in PIT and YAW signals. They are about the same as before the power outage within a 1 urad.
Note that since POP_A is a part of the ASC control loop, it stayed centered.
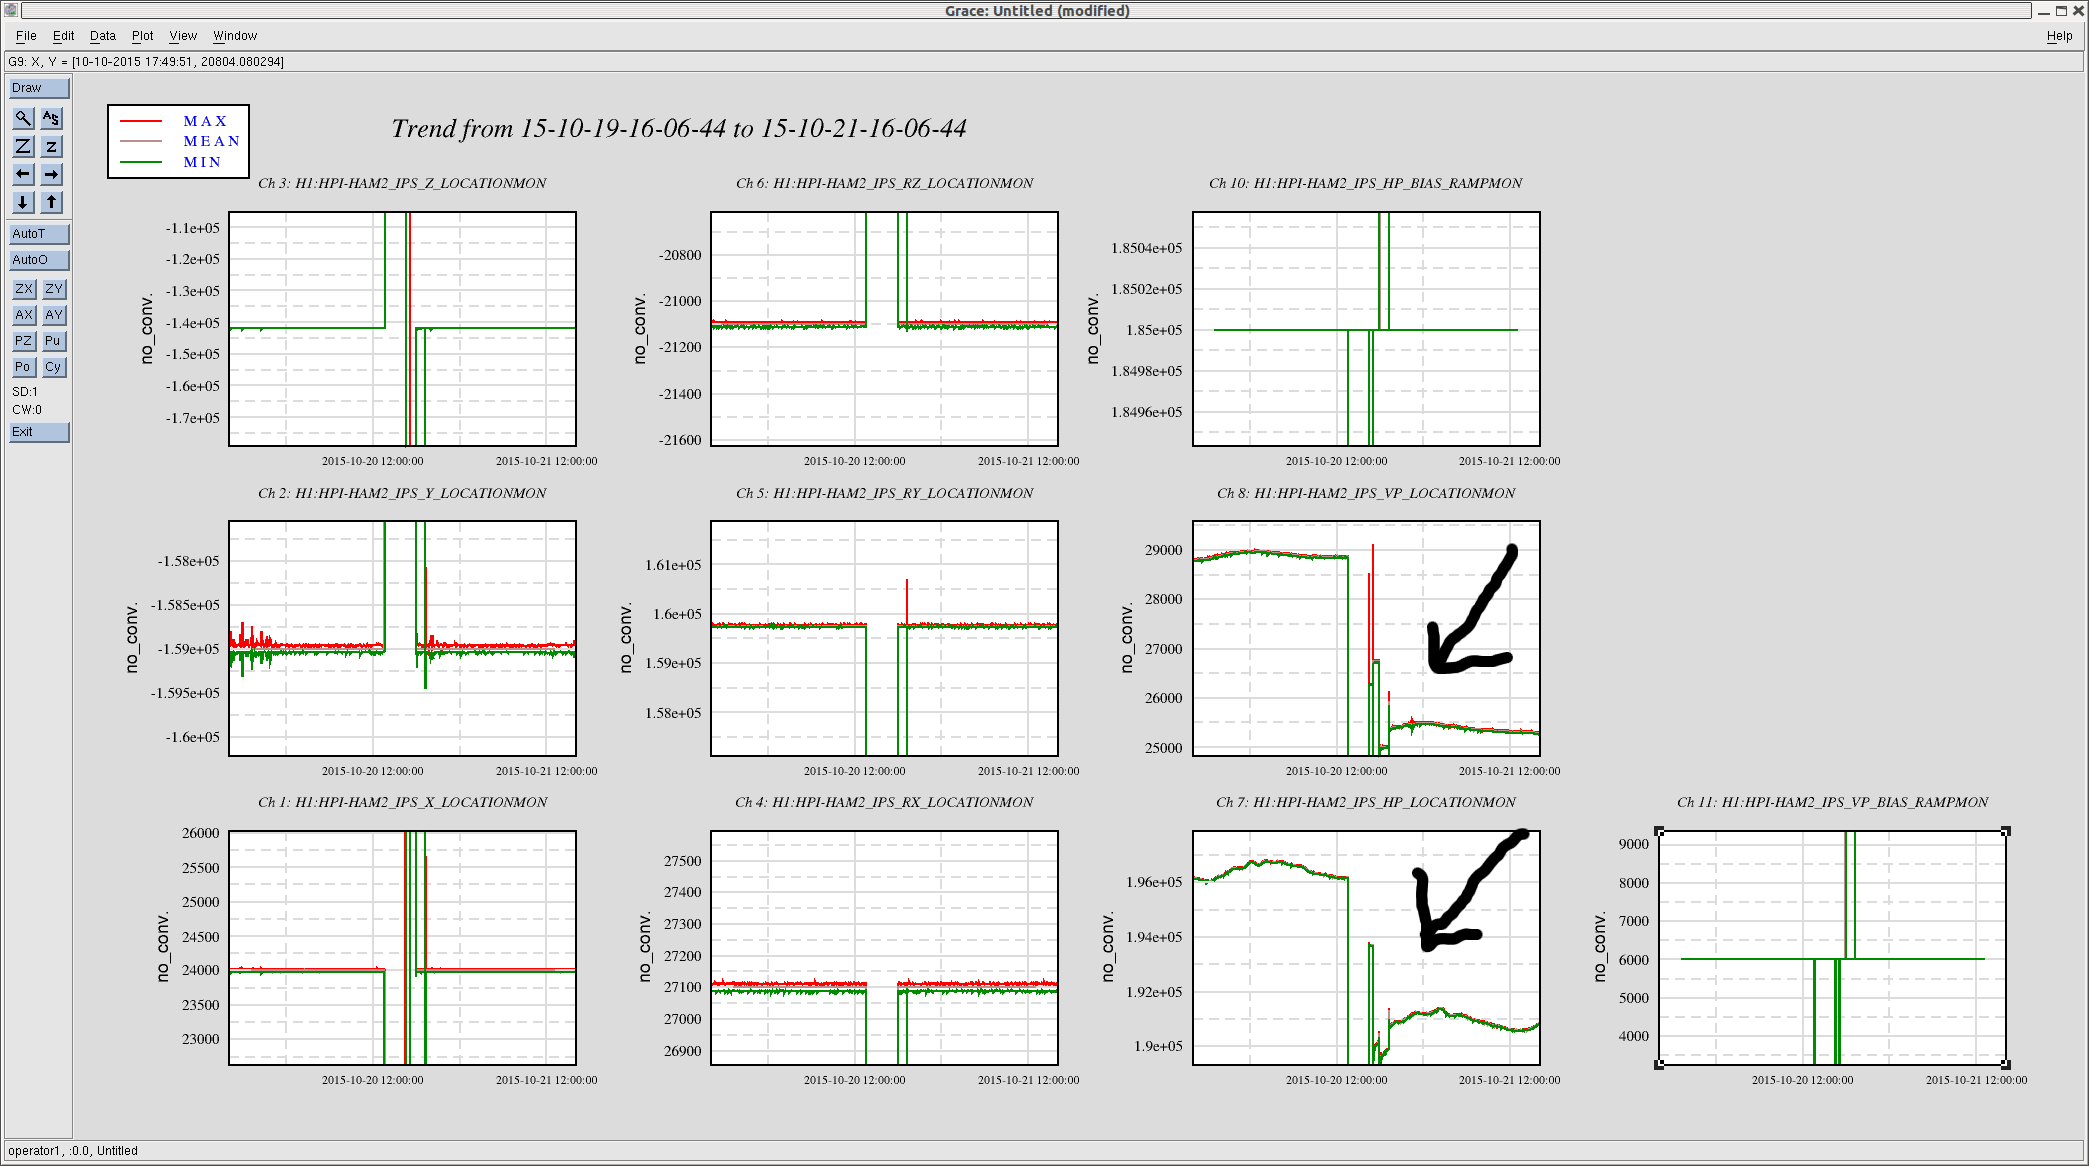
HEPI and ISI
With help from Hugh, we checked HAM2 HEPI and ISI to see if they are back to nominal. And they are the same as before except for two HEPI prignle modes. See the attached for a trend of HEPI position locations. The HP mode moved by 5e5 (nm?) and VP mode changed by 3.5e3 (nm?). We are not sure how significant these numbers are in terms of the ISI table alginement.
Note that since the pringle modes are not DC-controlled and therefore it is sort of natural that they did not come back to where they used to be.
The power outage of yesterday caused the EPICS IOC to not exit completely, so the instructions to restart the process did not work. I logged in to the computer running the process and manually killed the dewpoint process. At this point the instructions to restart (in the CDS wiki) worked. Data is now being collected from the dewpoint sensors.
We have made it back to Observing Mode at 16:59 UTC. The violin modes are a bit rung up, but they are coming down in their characteristically slow fashion.
I ran the A2L script before going to Observing. It gave the following error:
IOError: [Errno 13] Permission denied: 'LinFit.png'
The script creates a temporary file (LinFit.png) that I had forgotten to chmod, so the Ops account couldn't write to it.
Travis just successfully ran the a2l from the Ops account, so I *think* all the bugs are fixed. Note that the script won't return the command line prompt to you until you hit Enter on the keyboard, so it's a bit confusing as to when it's finished, but if all the SDF diffs are gone, it's over and you can go to Observe.
Activity Log: All Times in UTC (PT)

07:00 (00:00) Take over from TJ
08:18 (01:18) Jenne & Nutsinee – Leaving the site
08:23 (01:23) Guardian error – Trying to select INIT. ISC_LOCK reload fixed problem.
08:30 (01:30) redoing initial alignment
12:51 (05:51) Finished initial alignment – Trying to relock
12:57 (05:57) Lockloss at LOCK_DRMI_1F
12:58 (05:58) Peter – Going into LVEA to take some photos
13:03 (06:03) Peter – Out of LVEA
13:10 (06:10) Continuing working on relocking
15:00 (08:00) Turn over to Travis

End of Shift Summary:

Title: 10/21/2015, Owl Shift 07:00 – 15:00 (00:00 – 08:00) All times in UTC (PT)

Support: Jenne, Nutsinee, Jeff K., Sheila, Kiwamu

Incoming Operator: Travis

Shift Summary:
    No progress in relocking. Redoing initial alignment
    No luck with INPUT_ALIGN. Power jumps to 1, then immediately breaks lock. Spoke with Sheila. No progress. Sheila coming to site.
   Completed Initial Alignment and start relocking. Made it to LOCK_DRMI_1F before lockloss
   Making progress at relocking, but still having difficulties. Sheila and Kiwamu are working through the problems.
Things that Jeff B and I have done:
Jeff was having difficulty locking the X arm in IR for inital alignment. Jeff moved SR3 pit to bring witness and oplev back to where they were before the power outage (both indicated that it lost 1-2urad of pit in the outage) (Still could not lock X arm in IR) Jeff re-ran the green WFS alignment, and moved PR3 by 0.5 urad in yaw.
checked all shutters to retore them to the way they were before the outage. (opened ISCT1 spare, IOT2L spare, and X end fiber.) This uncovered an interesting bug, which is that if theX green beam shutter is open, and the fiber shutter is closed, opening the fiber shutter will close the green beam shutter. In most other situations both of these shutters seem to work fine.
After this the X arm locked. Jeff went through the rest of inital alingment without incident until SRC align. Since SR3 was closer to the alignment from before the outage, we re-engaged the cage servo, which was turned off earlier probably because SR3 had moved. the SRC alignment was way off when we started the SRC align step and Jeff aligned by hand to get us close.
We then were able to lock DRMI several times, but had difficulty engaging DRMI ASC as people described last night. We tried doing things by hand, it seemed like we were OK engaging the MICH and INP1 loops, but PRC2 was a problem. In august, Evan and I changed the input matrix for this loop to no longer use refl 45 (alog 20811.) I found the old input matrix in the svn and tried it. This worked once so I've reverted the matrix in the guardian.
Input matrix for PRC2 since august 24th: refl91A-refl9IB
input matrix before august 24th and now:
# PRC2 REFLA45I - REFLA9I
asc_intrix_pit['PRC2', 'REFL_A_RF45_I'] = asc_intrix_yaw['PRC2', 'REFL_A_RF45_I'] = 0.83
asc_intrix_pit['PRC2', 'REFL_A_RF9_I'] = asc_intrix_yaw['PRC2', 'REFL_A_RF9_I'] = 0.5
asc_intrix_pit['PRC2', 'REFL_B_RF9_I'] = asc_intrix_yaw['PRC2', 'REFL_B_RF9_I'] = 0.5
asc_intrix_pit['PRC2', 'REFL_B_RF45_I'] = asc_intrix_yaw['PRC2', 'REFL_B_RF45_I'] = 0.83
This matrix gets reset in the full lock ASC engage states, so this is not a change to the full lock configuration.
After this change we made it past DRMI, to the point where DHARD WFS are engaged durring the CARM offset reduction. The bounce and roll modes are rung up, we spent a few minutes damping them but probably moved on too soon and lost lock probably due to roll modes in the final stages of CARM offset reduction.
Kiwamu and I spent about 15 minutes locked at CARM 10 picometers to damp bounce and roll. We lost lock after that, possibly because the IFO got misaligned as we were sitting at 10pm damping.
In the next lock, we saw that ETMX violin modes are also rung up, Kiwamu lowered the damping gains to stop PUM saturations.
We made it through engaging the ASC in full lock, and found that we couldn't lock the OMC because the Kepco power supply was off.
After we made it to low noise, I cleared 82 diffs in the ASC SDF. Most of these were due to the dark offset script that Jenne and Jeff ran last night. I accidentally accepted all of these with one button click (I hit accept all assuming that was only the first page which I could read, but accept all really means accept all.) Betsy pointed me to the last version to be accepted in SDF, so I was ble to check on the things I had inadvertently accepted. There were a few oddball things, like ADS SIG DEMOD TRAMPS, (I accepted the new 3 second TRAMPs), and offsets in the SRC1 loops (now set to 0).
   Difficult morning for locking.

   After many lock failures, and at Jenne's suggestion started to run another an Initial Alignment. One had been done earlier during the day. No problem with ALS green. Could not get Input_Align to complete. It would grab lock with good power for a second or two and then drop. Ran through a couple of things with Sheila on the phone, but made no real progress. Sheila is coming in to work on resolving this problem.
Title:  10/21/2015, Owl Shift 07:00 – 15:00 (00:00 – 08:00) All times in UTC (PT)

State of H1: 07:00 (00:00) Relocking after yesterday’s power outage

Outgoing Operator: TJ

Quick Summary: Wind is a light to gentle breeze; seismic activity is low. Working on IFO recovery.
TITLE: "10/20 [EVE Shift]: 23:00-07:00UTC (16:00-00:00 PDT), all times posted in UTC"
STATE Of H1: Unlocked, struggling
SUPPORT: Jenne, Jeff K, Nutsinee, Sheila (by phone)
SHIFT SUMMARY: Problems from the beginning of my shift. Initial alignment presented two issues alog22705 and alog22707. Then trouble with DRMI has taken up the rest of my shift, alog22709 and alog22711. Let's hope for some good luck from here.
INCOMING OPERATOR: Jeff B
J. Kissel, J. Driggers, T. Shaffer

After several lock losses of DRMI that were obviously caused by DRMI WFS running away with the optics, we've begun the arduous journey of going through each step of the DRMI WFS turn on process. We're trying the usual -- identify which step is problematic, slow things down, try turning on with low gains and no boosts, etc. We've run through tuning dark offsets suspecting we might have problems there and our earlier experience with the TransMon QPDs, but they didn't change too much. We've checked whitening filters and gains, all looks OK.

Jenne's gunna stick it out with Bartlett for a few more attempts of finagling the WFS loops in hopes of working through them enough that they offload goodness to the SUS, but TJ and I are going to call it a night.
J. Kissel, J. Driggers, T. Schaffer

After a very quick transition through ALS (nice!) we were stuck trying to get through DRMI 1f lock acquisition. After all of the usual tricks of taking SRM out of the equation, touching up alignment here and there, we began to be suspicous of beckhoff settings of our error signal photodiodes, as just about all of our problems have been this evening. Gains, whitening filters, all checked out. However, finally just *looking* at the error signal in dataviewer, we saw little to nothing. Jenne caught it -- the REFL shutter on ISCT was closed (similar to the earlier shutter gotcha LHO aLOG 22696).

40 mins ... *flush*
[Basically everyone in the control room]
We spent a lot of time working on pre-initial alignment, since we weren't seeing any light at the ALS transmission cameras or PDs.
All of the test mass optics and PR3 were restored to where their oplevs thought they were before the power outage (since the oplevs are independent of ISI pointing). The TMS suspensions were aligned using the baffle PD script.
Eventually, it was discovered that a shutter on ISCT1 was closed, and blocking the transmitted green beams.
Keita and Daniel are looking into why it was closed at all when the power went out and why it wasn't opened after the burt restore that Patrick did, but I have also added it to the ISC_LOCK DOWN state, so that we don't get bitten by this again.
We're getting good flashing in the arm cavities, both for green and IR, so as soon as this earthquake finishes ringing down, we can do initial alignment and finally relock.
[Jenne, TJ]
After finishing the green initial alignment step, we noticed that the COMM beatnote power was tiny - something like -32dBm. No good. After trying some PR3 alignment with no effect, we looked at some more shutters. As it turns out, the PSL green beam also has a shutter, so we weren't getting any PSL green to the beat PD. Opening that immediately fixed the problem. TJ finished off hand-aligning PR3 to maximize the beatnote power, and we went off to our next initial alignment step. (See aLog 22705 for that "fun"....)
This shutter was also added to the ISC_LOCK down state, so we don't get bitten by it either.
Two hours ... *flush*
Executive summary:
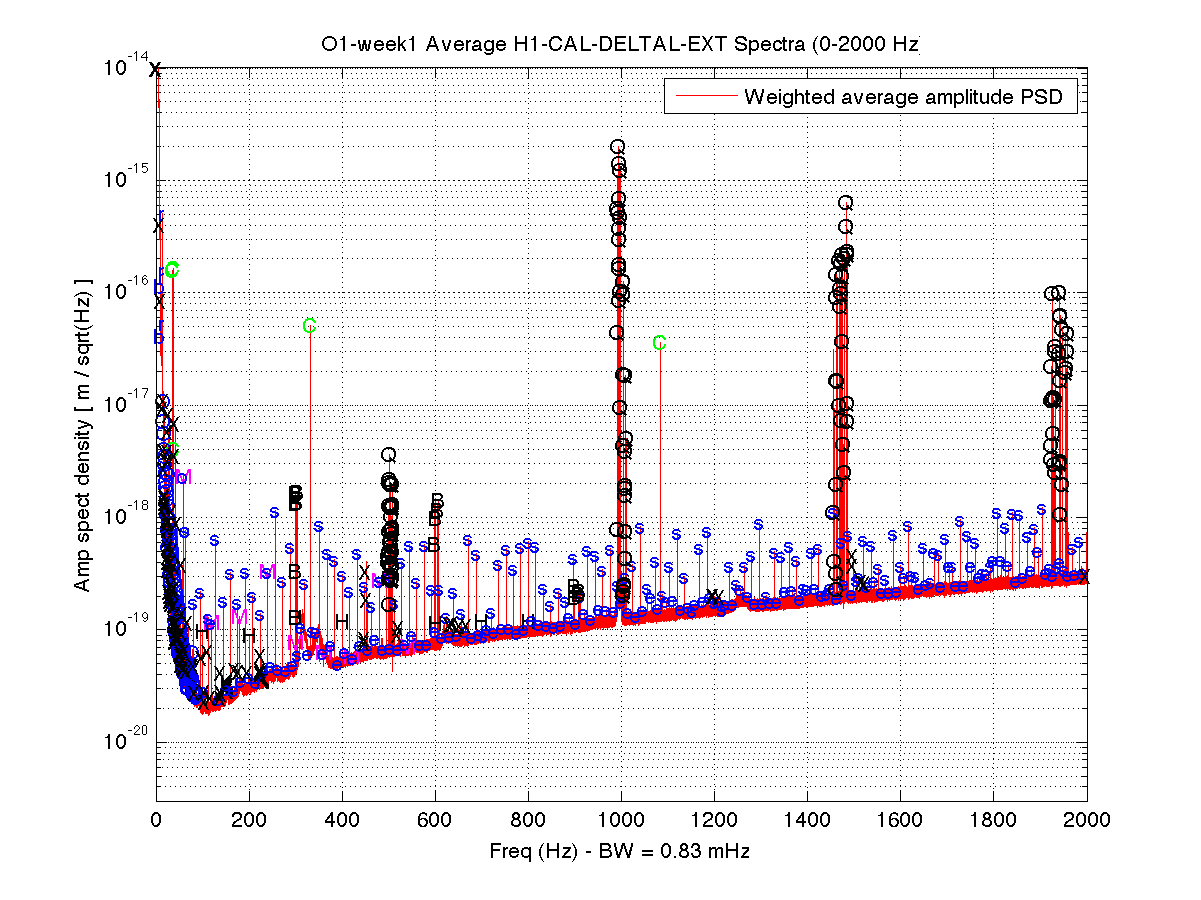
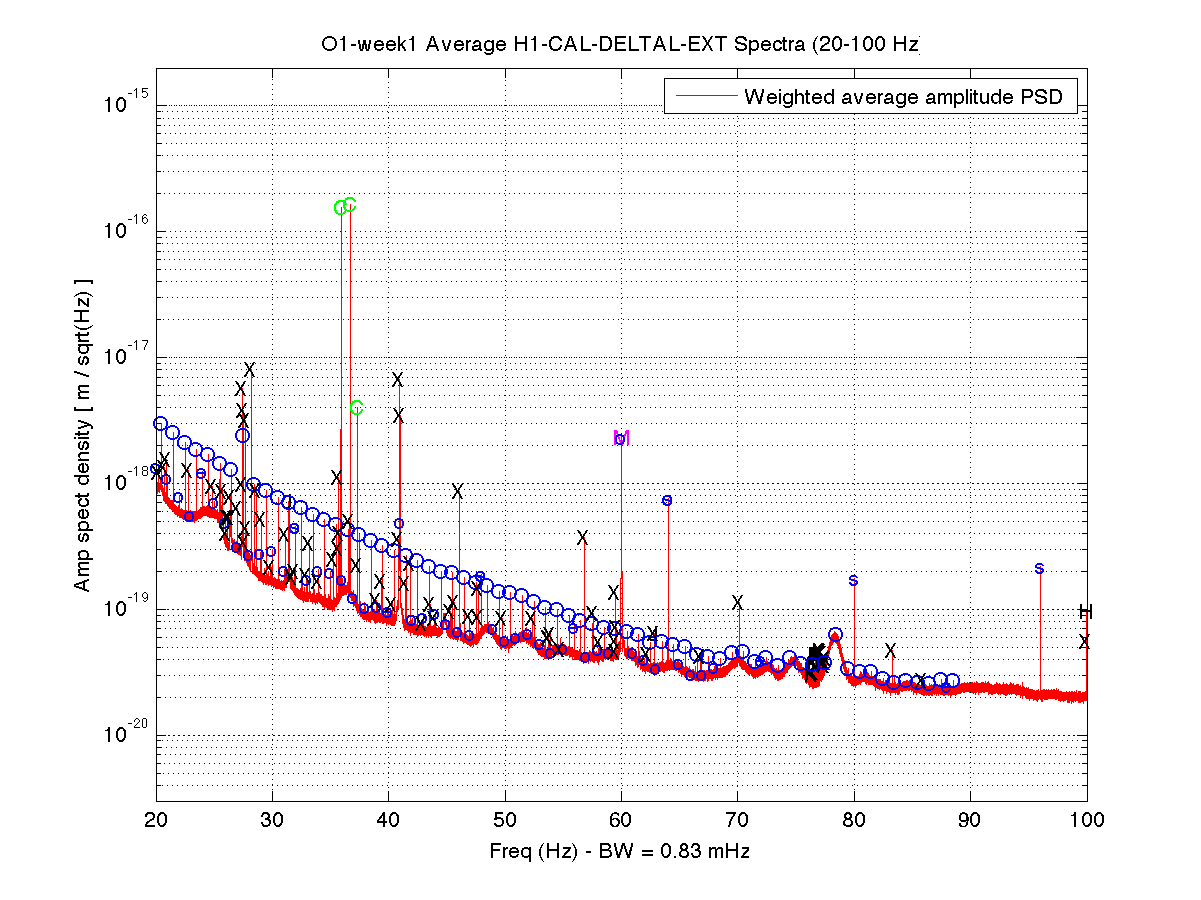
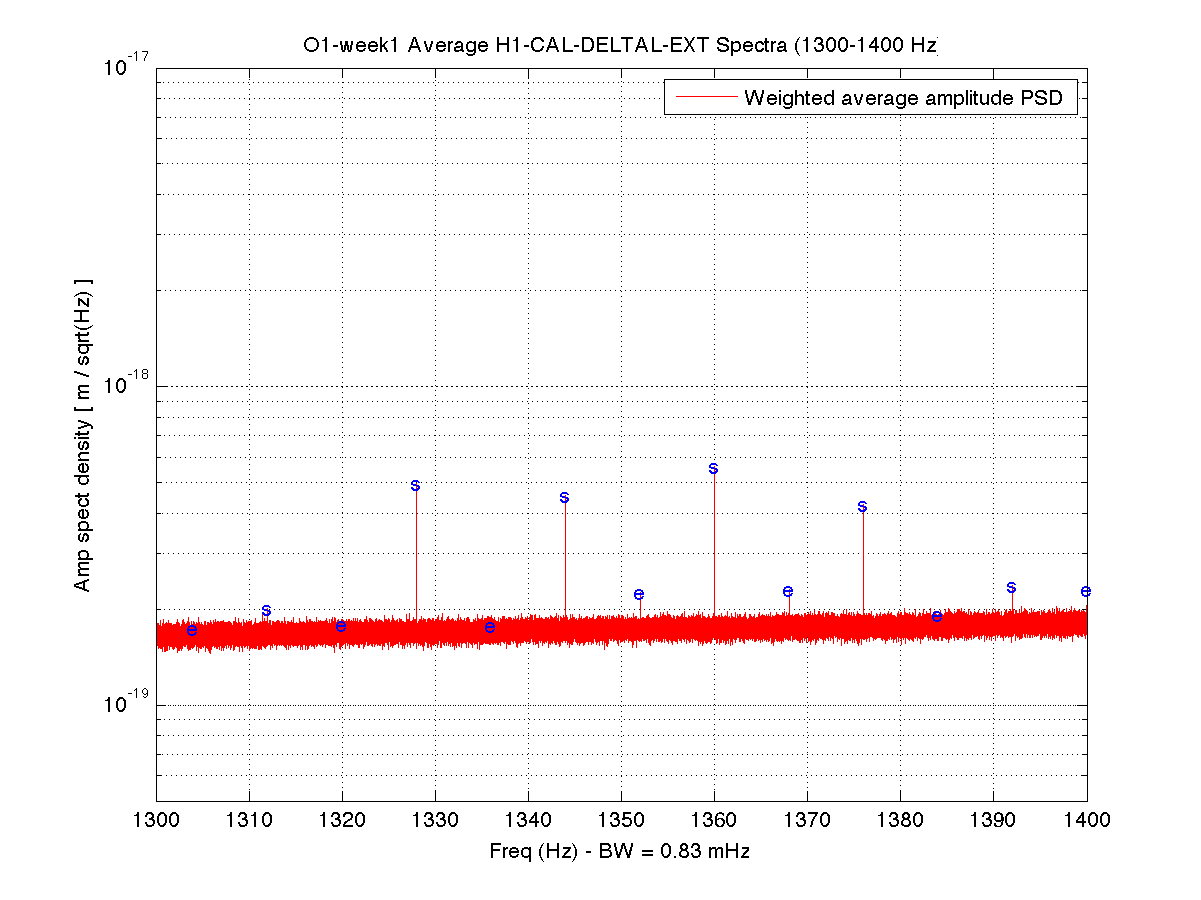
A matlab file (37 MB) containing the averaged inverse-noise-weighted spectrum from the first week can be found here:

https://ldas-jobs.ligo.caltech.edu/~keithr/spectra/O1/H1_O1_week1_0-2000_Hz.mat

Because of the way multiple epochs are handled, the matlab variable structure is non-obvious.
Here is how to plot the full spectrum after loading the file:  semilogy(freqcommon,amppsdwt{1,1})
Keith has found:
"There is a sporadic comb-on-comb with 0.088425-Hz fine spacing that appears with limited spans in three places near harmonics of 77, 154 and 231 Hz (ambiguity in precise fundamental frequency)"

Using the coherence tool, we have seen coherence between h(t) and a number of auxiliary channels that shows this comb around 77 Hz. Seems to be around the input optics, in channels:
H1:PEM-CS_MAG_LVEA_INPUTOPTICS_Z_DQ
H1_SUS-ITMY_L1_WIT_L_DQ
H1:SUS-BS_M1_DAMP_L_IN1_DQ
H1_SUS-ITMY_L1_WIT_P_DQ
H1:SUS-BS_M1_DAMP_T_IN1_DQ
H1_SUS-ITMY_L1_WIT_Y_DQ
H1:SUS-BS_M1_DAMP_V_IN1_DQ
H1_SUS-ITMY_L2_WIT_L_DQ
H1:SUS-BS_M1_DAMP_Y_IN1_DQ
H1_SUS-ITMY_L2_WIT_Y_DQ

See the attached figures.

Nelson, Soren Schlassa, Nathaniel Strauss, Michael Coughlin, Eric Coughlin, Pat Meyers
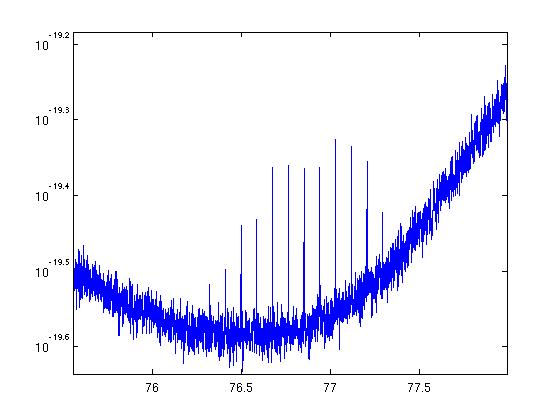
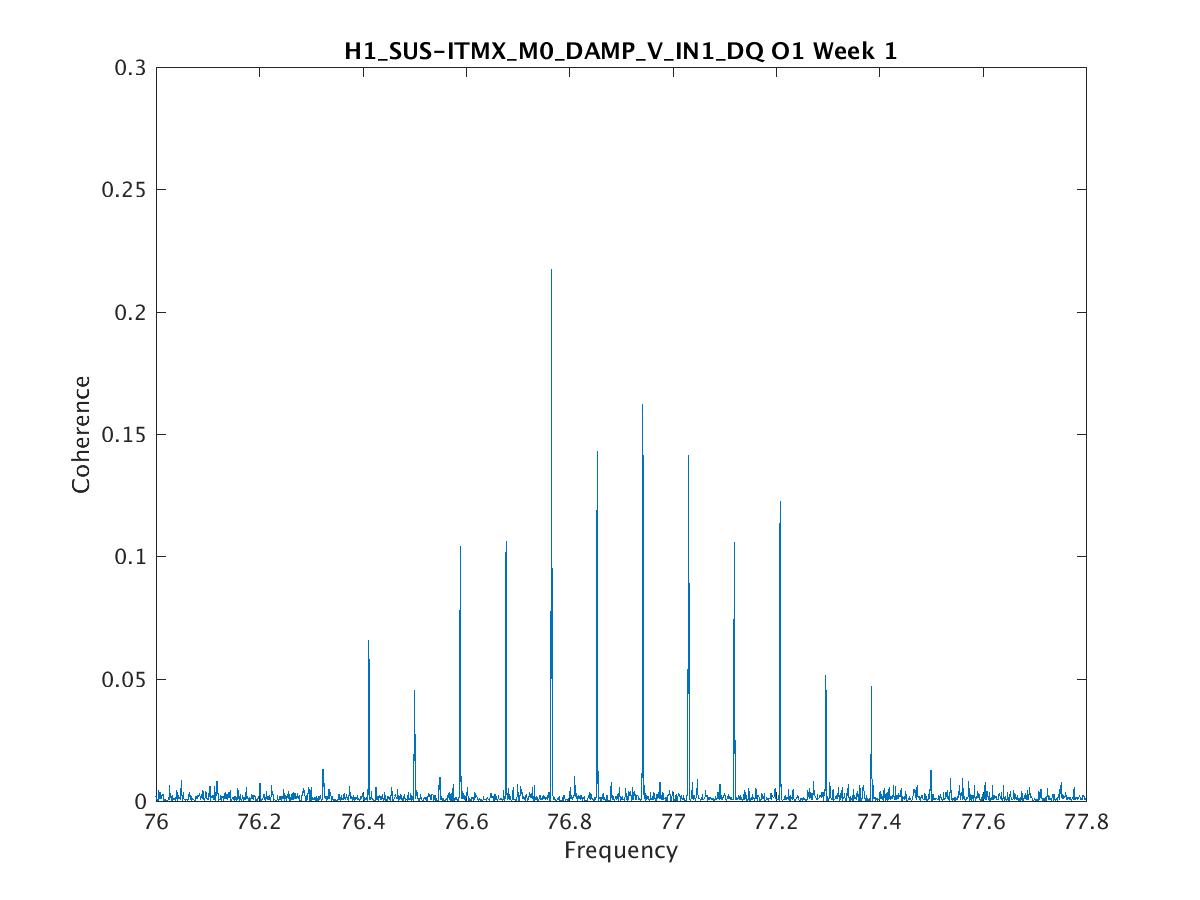
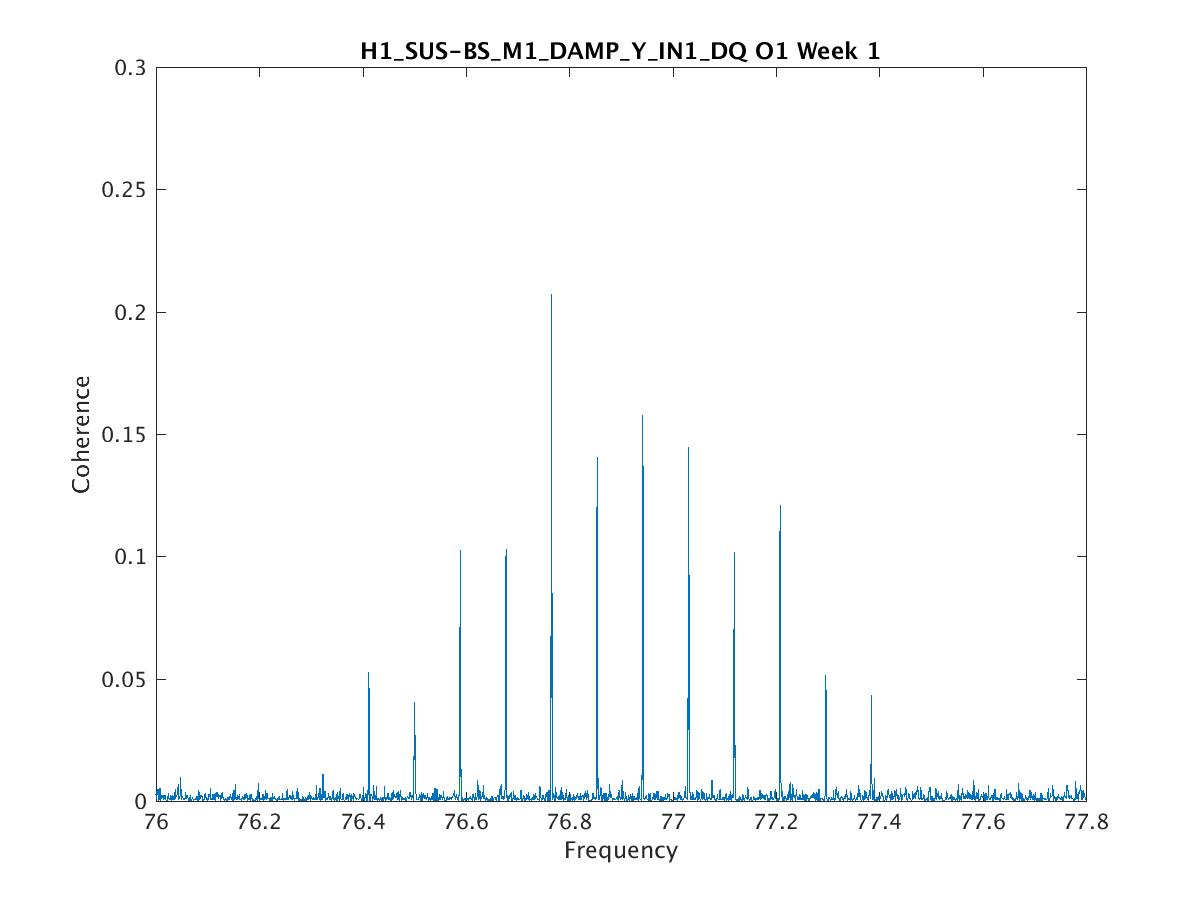
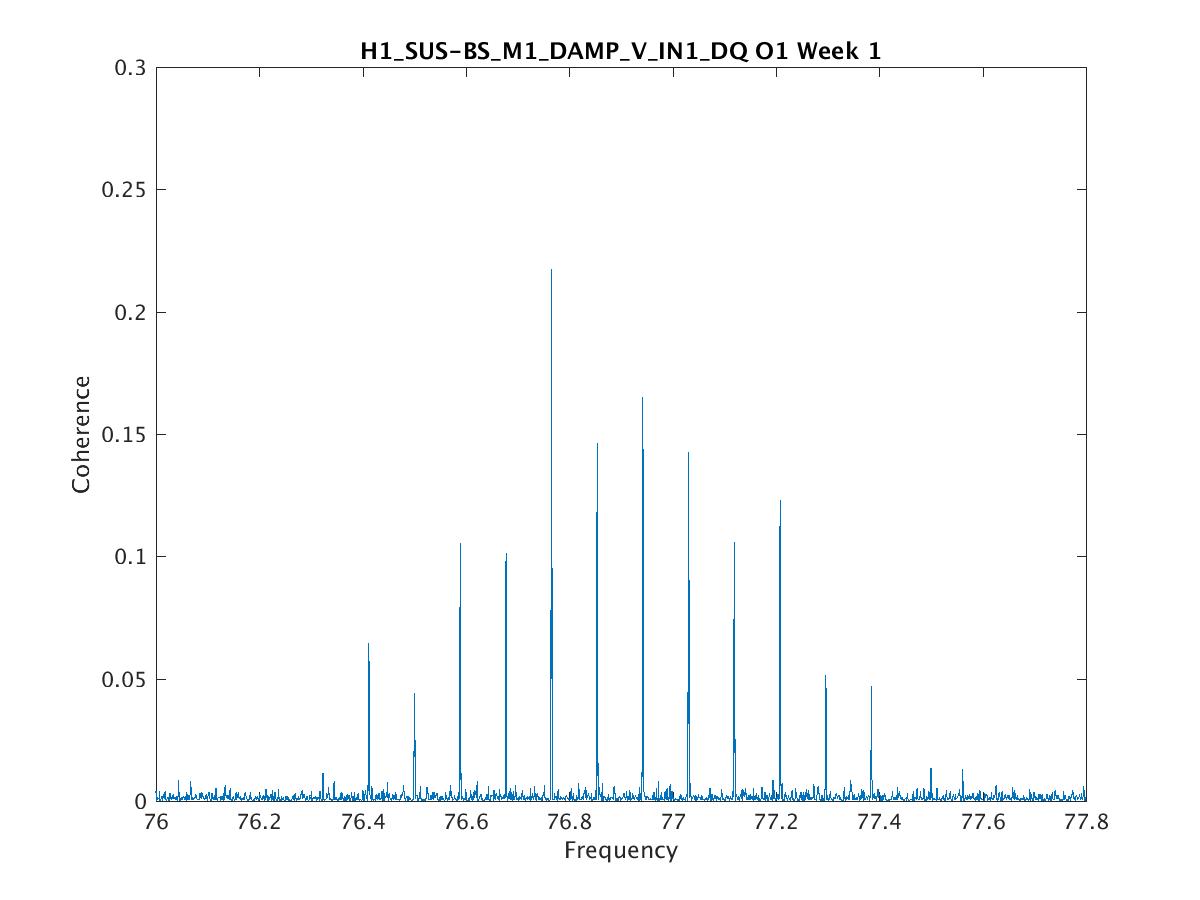
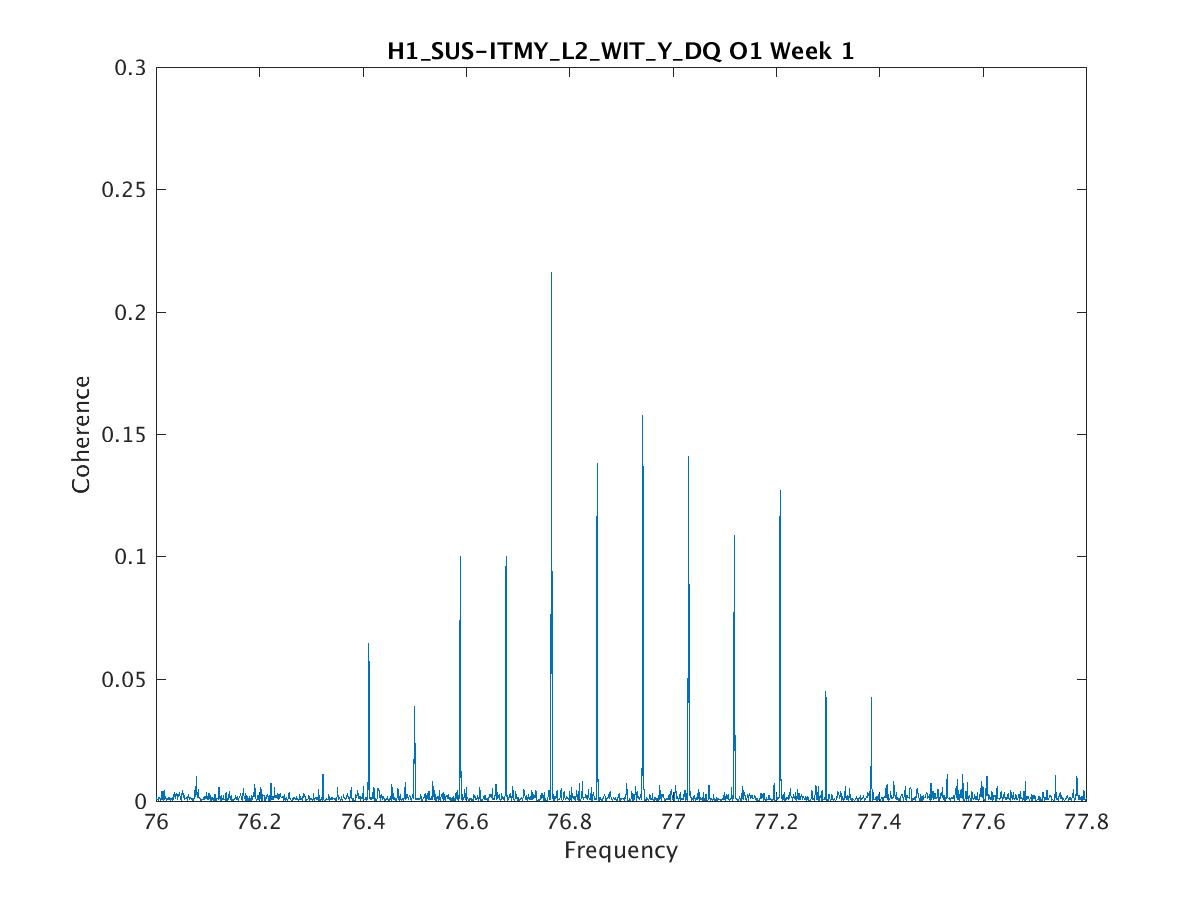
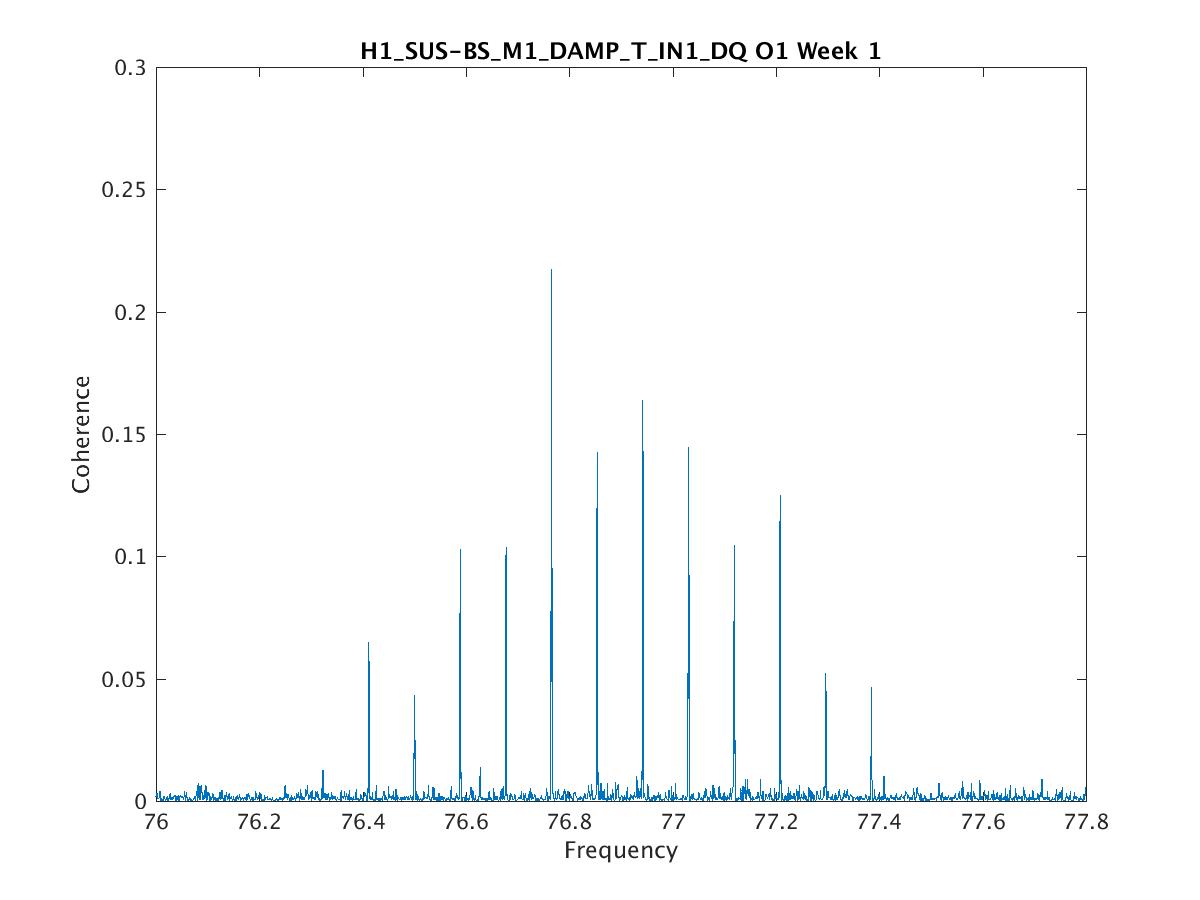
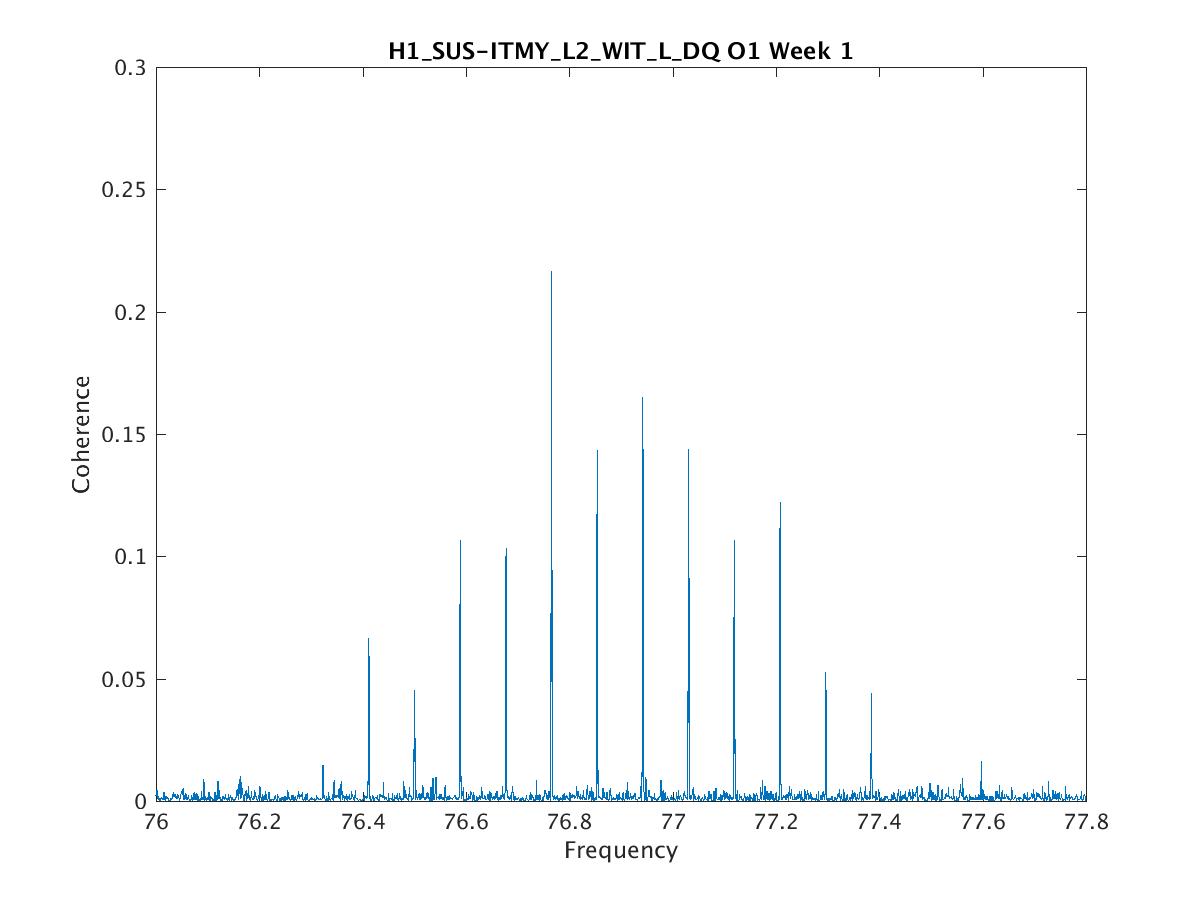
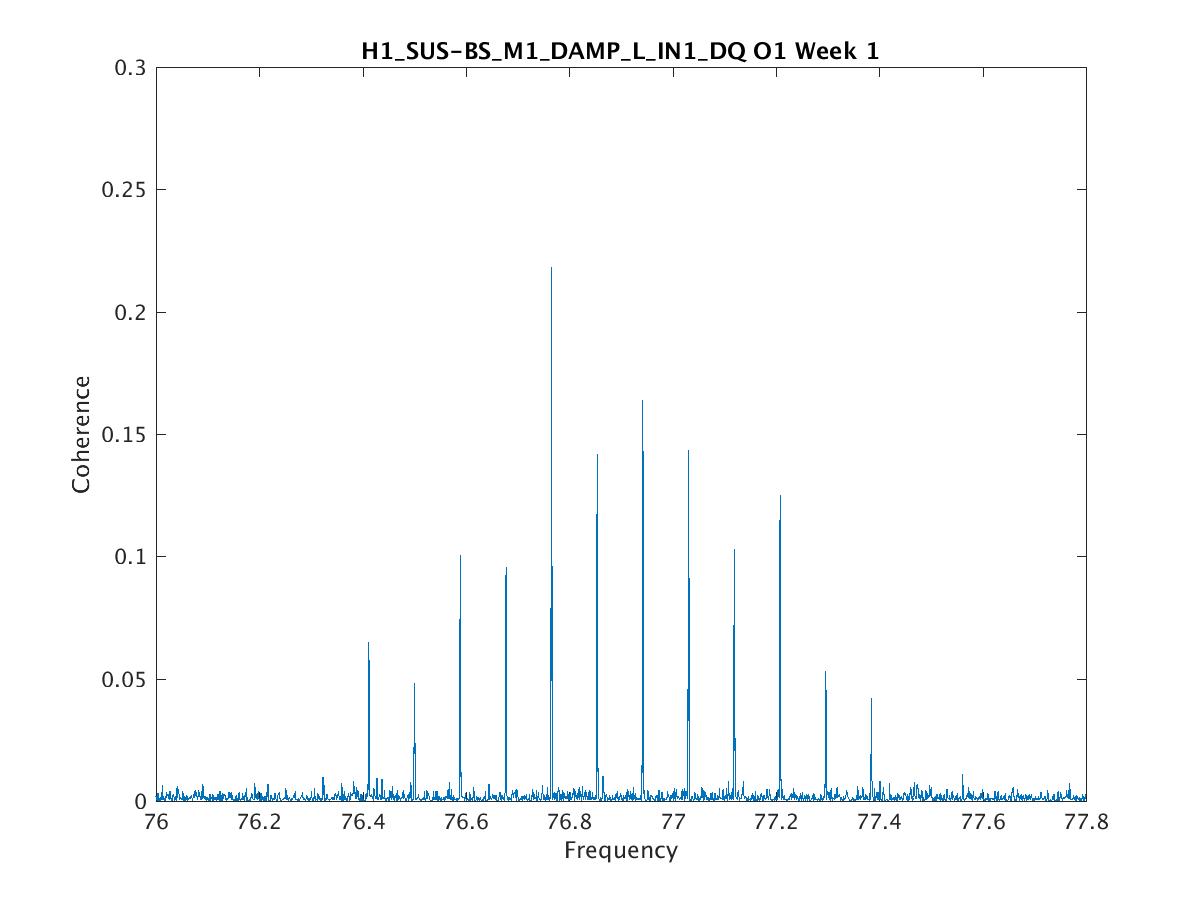
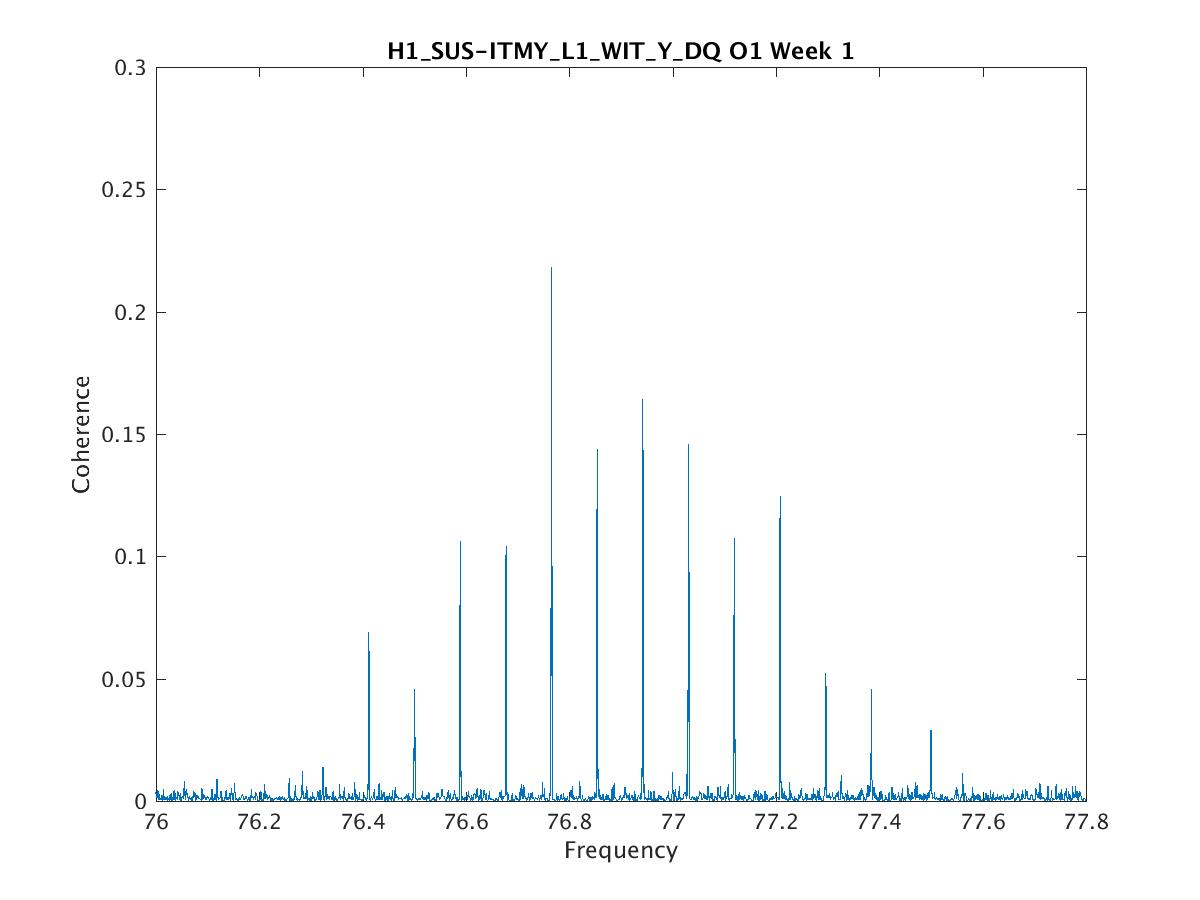
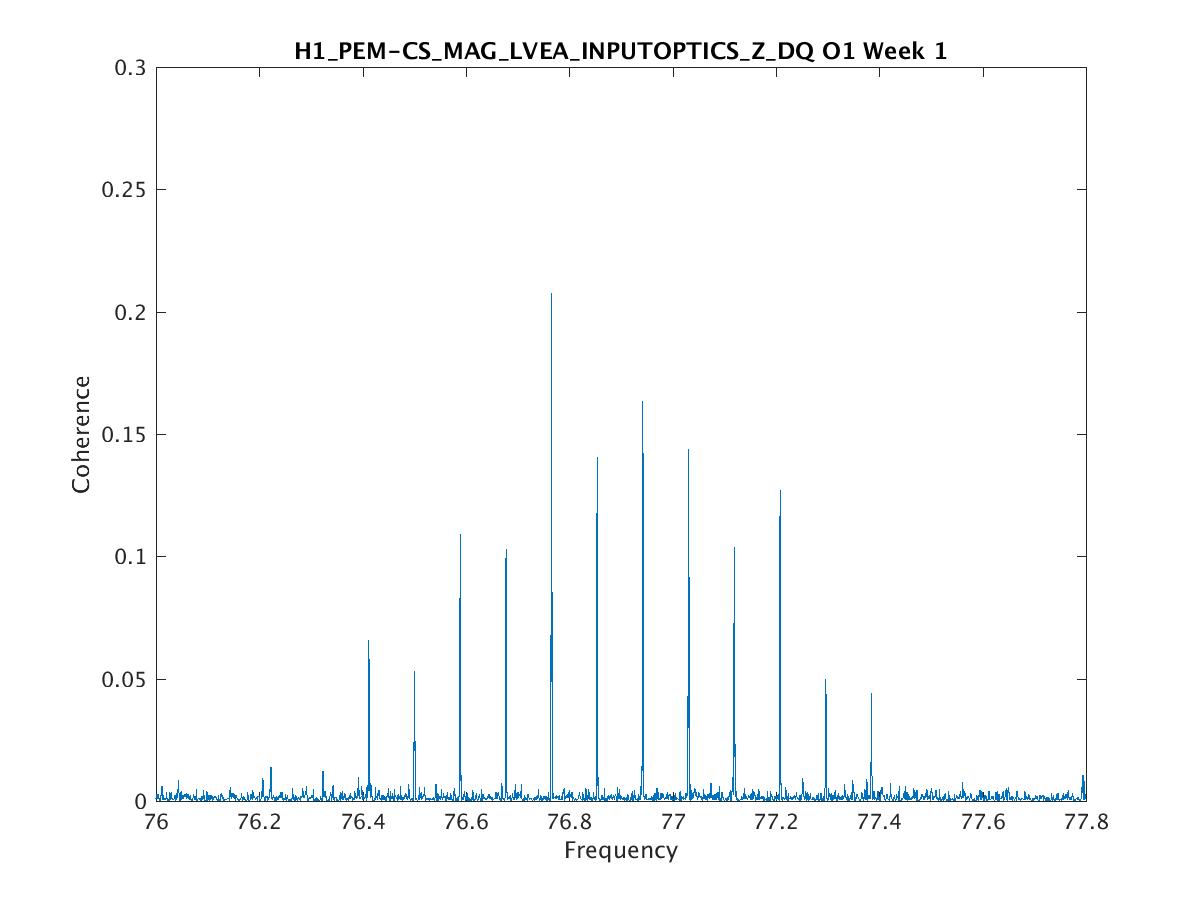
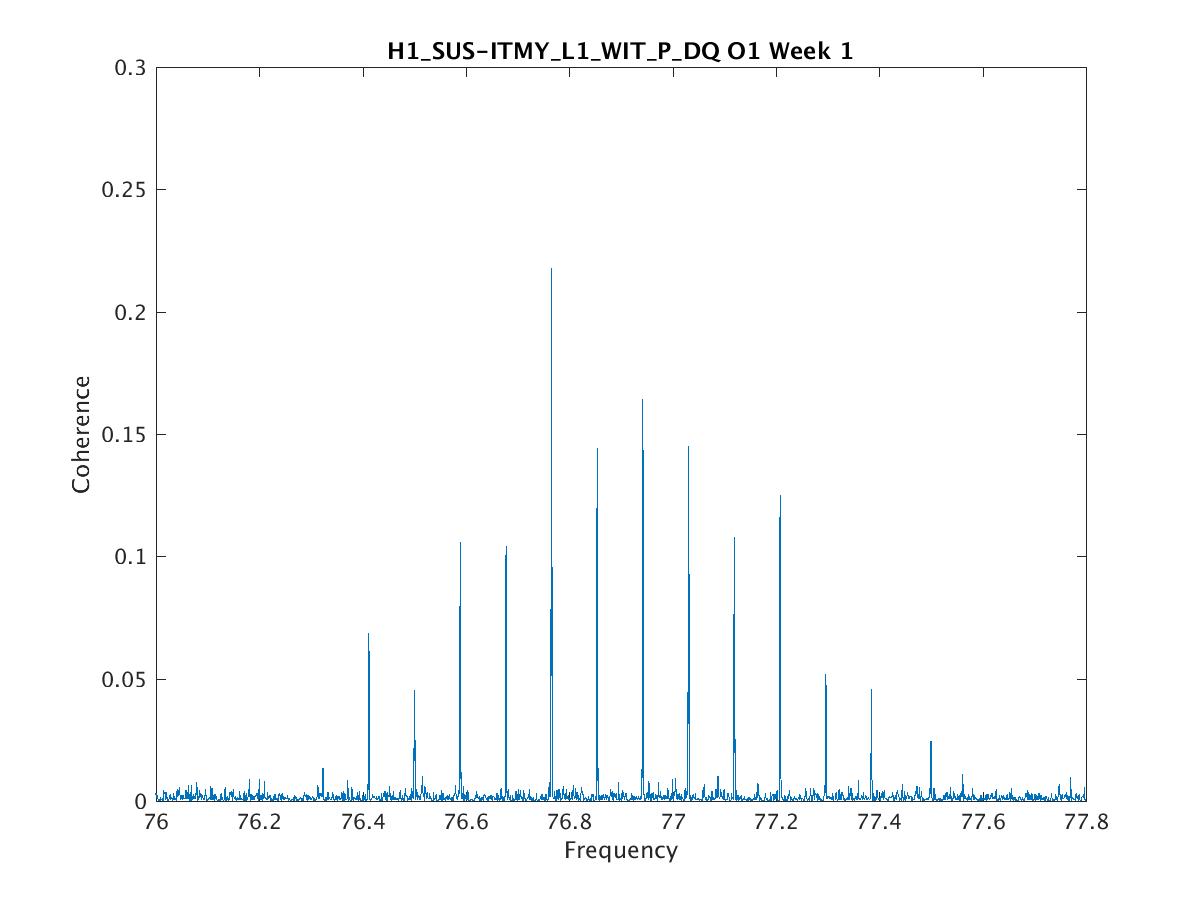
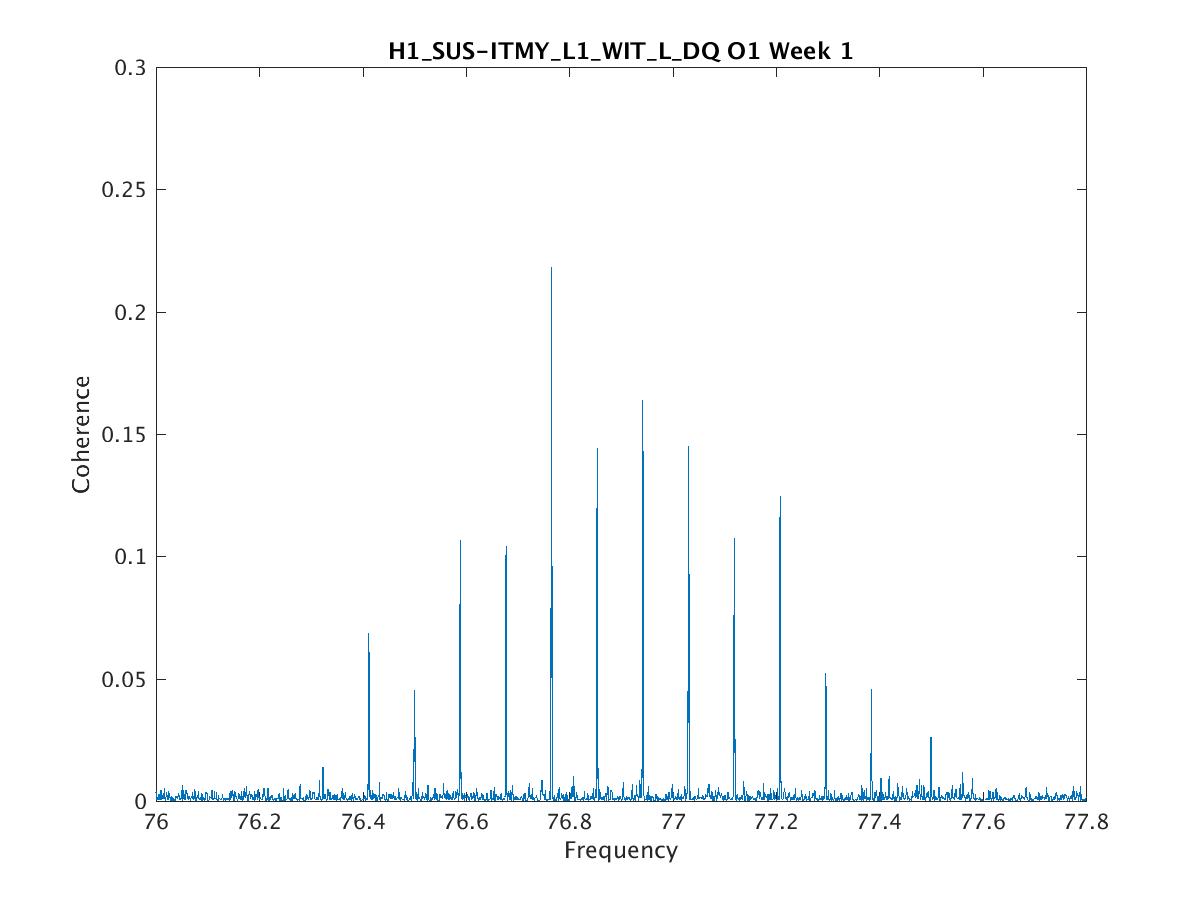
The structure at 76.4Hz Nelson listed some channels for above shows up in at least 50 other channels.

Greatest coherence is consistently at 76.766 Hz, second greatest is (mostly) consistently at 76.854Hz.

Spacing between the two combs is about 0.0013Hz.

The epicenter seems to be the INPUTOPTICS/the SUS-BS and SUS-ITM* channels, like Nelson said (see below for fuller list).

The plots above are pretty typical, but I have plots for all channels listed and can post any more that are useful. Most or all channels showing the comb with max coherence greater than 0.1 are listed below. Max coherences over 0.2 are marked below as strong, and max coherences under 0.15 as weak. Those marked strongest are around 0.22. I haven't included anything of max coherence <0.1 but I'm sure there are many.

H1:ASC-AS_A_RF36_I_PIT_OUT_DQ (weak)
H1:ASC-AS_A_RF36_I_YAW_OUT_DQ
H1:ASC-AS_A_RF36_Q_PIT_OUT_DQ
H1:ASC-AS_A_RF36_Q_YAW_OUT_DQ (weak)
H1:ASC-AS_B_RF36_I_YAW_OUT_DQ
H1:ASC-AS_B_RF36_Q_YAW_OUT_DQ (strong)
H1:ISI-BS_ST2_BLND_RZ_GS13_CUR_IN1_DQ (strong)
H1:ISI-BS_ST2_BLND_Z_GS13_CUR_IN1_DQ (strong)
H1:ISI-HAM2_BLND_GS13RZ_IN1_DQ
H1:ISI-HAM2_BLND_GS13Z_IN1_DQ
H1:ISI-HAM3_BLND_GS13Z_IN1_DQ (strong)
H1:ISI-HAM5_BLND_GS13RZ_IN1_DQ
H1:ISI-HAM5_BLND_GS13Z_IN1_DQ
H1:ISI-HAM6_BLND_GS13RZ_IN1_DQ
H1:ISI-ITMX_ST2_BLND_RX_GS13_CUR_IN1_DQ (weak)
H1:ISI-ITMX_ST2_BLND_Z_GS13_CUR_IN1_DQ (strong)
H1:ISI-ITMY_ST1_BLND_RZ_T240_CUR_IN1_DQ (weak)
H1:ISI-ITMY_ST1_BLND_Y_T240_CUR_IN1_DQ (weak)
H1:ISI-ITMY_ST2_BLND_RZ_GS13_CUR_IN1_DQ (strong)
H1:ISI-ITMY_ST2_BLND_Z_GS13_CUR_IN1_DQ (strong)
H1:LSC-PRCL_IN1_DQ
H1:PEM-CS_LOWFMIC_LVEA_VERTEX_DQ (strong)
H1:PEM-CS_MAG_LVEA_INPUTOPTICS_Y_DQ (strongest)
H1:PEM-CS_MAG_LVEA_INPUTOPTICS_Z_DQ (strong)
H1:SUS-BS_M1_DAMP_L_IN1_DQ (strongest)
H1:SUS-BS_M1_DAMP_T_IN1_DQ (strong)
H1:SUS-BS_M1_DAMP_V_IN1_DQ (strong)
H1:SUS-BS_M1_DAMP_Y_IN1_DQ (strong)
H1:SUS-ITMX_M0_DAMP_R_IN1_DQ (strong)
H1:SUS-ITMX_M0_DAMP_V_IN1_DQ (strong)
H1:SUS-ITMY_L1_WIT_L_DQ (strong)
H1:SUS-ITMY_L1_WIT_P_DQ (strong)
H1:SUS-ITMY_L1_WIT_Y_DQ (strong)
H1:SUS-ITMY_L2_WIT_L_DQ (strong)
H1:SUS-ITMY_L2_WIT_P_DQ (strong)
H1:SUS-ITMY_L2_WIT_Y_DQ (strong)
H1:SUS-MC1_M3_WIT_L_DQ
H1:SUS-MC1_M3_WIT_P_DQ (weak)
H1:SUS-MC2_M1_DAMP_L_IN1_DQ
H1:SUS-MC2_M1_DAMP_T_IN1_DQ
H1:SUS-MC2_M1_DAMP_Y_IN1_DQ
H1:SUS-PR2_M1_DAMP_P_IN1_DQ
H1:SUS-PR2_M1_DAMP_R_IN1_DQ
H1:SUS-PR2_M1_DAMP_V_IN1_DQ
H1:SUS-PR2_M3_WIT_L_DQ
H1:SUS-PR2_M3_WIT_P_DQ (weak)
H1:SUS-PR2_M3_WIT_Y_DQ (weak)
H1:SUS-PR3_M1_DAMP_P_IN1_DQ
H1:SUS-PR3_M1_DAMP_V_IN1_DQ
H1:SUS-PRM_M1_DAMP_L_IN1_DQ (strongest)
H1:SUS-PRM_M1_DAMP_T_IN1_DQ
H1:SUS-PRM_M1_DAMP_Y_IN1_DQ (strong)
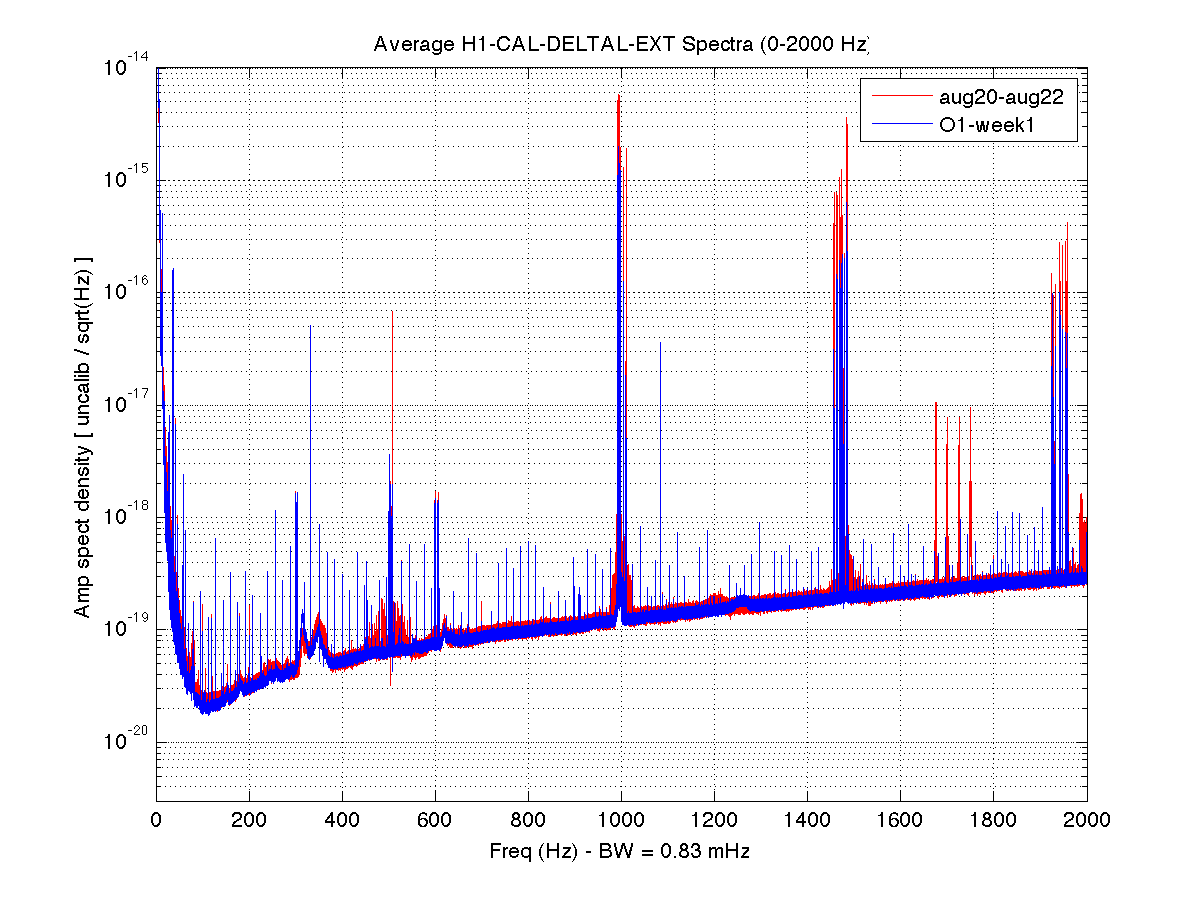
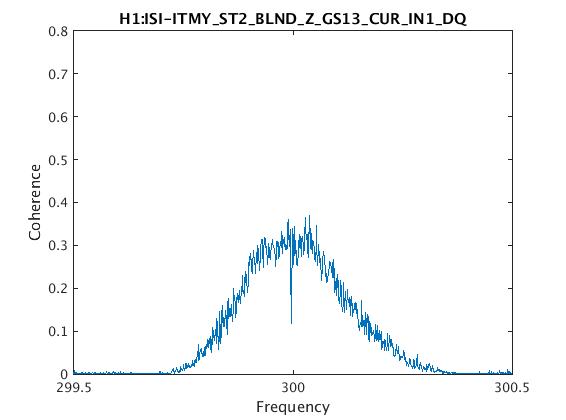
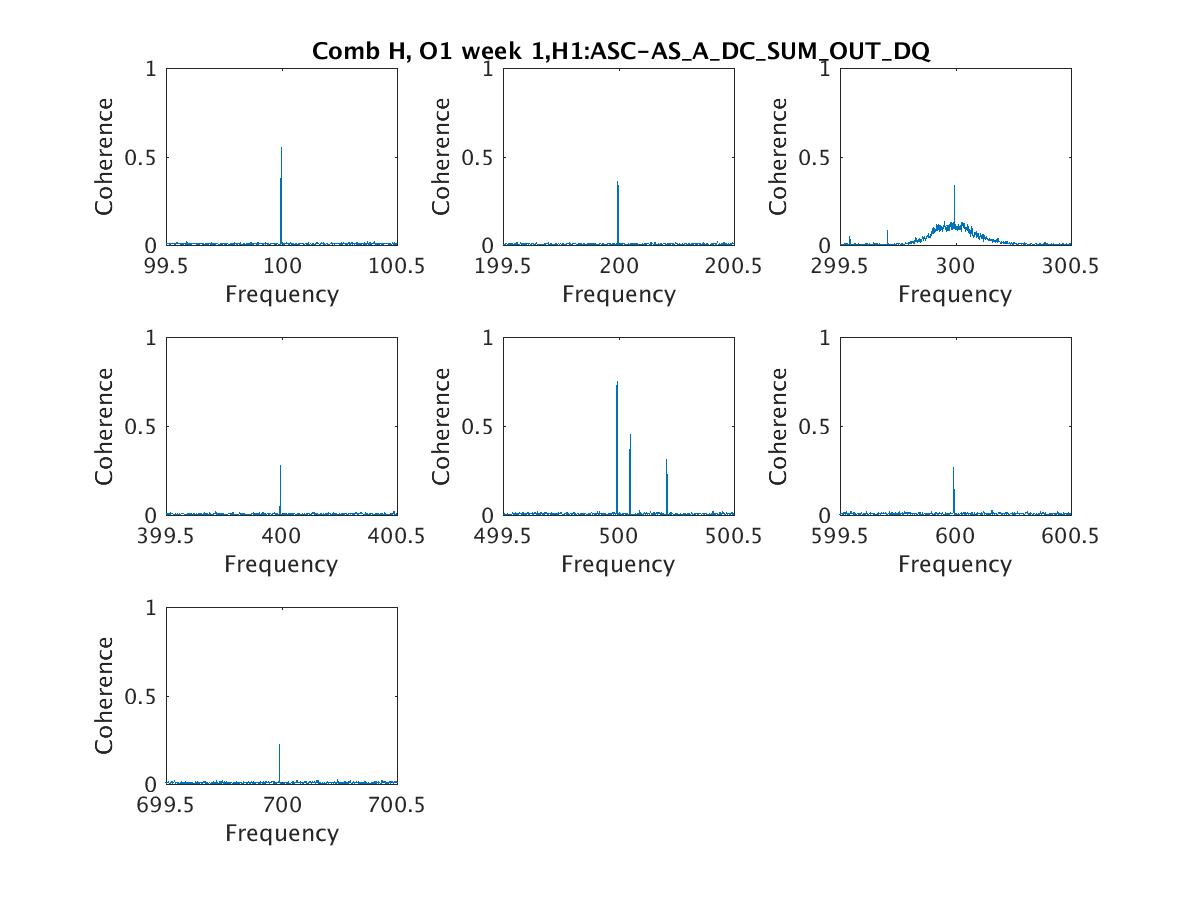
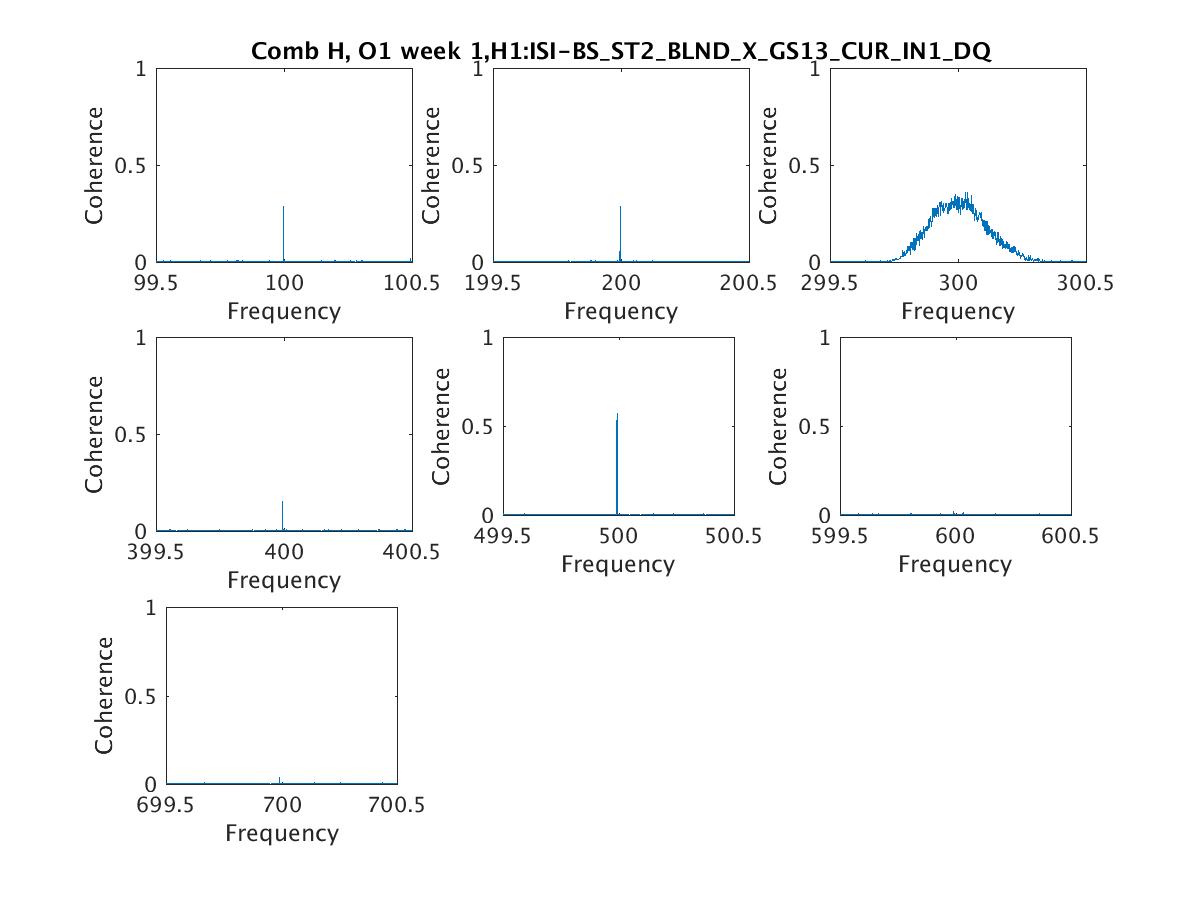
The 99.9989Hz comb Keith found (designated H) appears in 109 channels (list is attached). Coherence is uniformly greatest at the ~500Hz harmonic, with many channels approaching .7 and greater, drops off sharply at the ~600Hz and ~700Hz, and is invisible after 700. (See spreadsheet titled "comb_H_sigcohs_wk1.xslx" for a list of cohering channels by line, with coherence value.)

At all harmonics except the ~300Hz, the structure manifests in the signal and the coherences as two lines .001Hz apart, but if I recall correctly .001Hz is the resolution of the frequency series, so it's safer to say that this is a bulge with .001Hz < width < .002Hz. At ~300Hz, almost all the cohering channels with data in that range show a bulge of width about 0.5Hz (see attached "disjoint_plots" for a comparison of typical channels by harmonic). This bulge, and the fact that it appears in all the same channels associated with the rest of the comb, makes me think that the fundamental may be the bulge at ~300Hz and not the line at 99.9989Hz. An interesting feature of the bulge is that in many cases, it has a prominent upward or downward spike at 299.96Hz, which is just the place the line would be if it were there (see "bulge_w_spike.jpg").

More to come re: changes in week 4 data, patterns in cohering channels, and the spike.


14:31: tapping on HAM6 table
14:39: tapping on HAM6 chamber (ISCT6 side), in the region underneath AS port viewport
14:40: tapping on HAM6 chamber (ISCT6 side), near OMC REFL light pipe
14:44: with AS beam diverter open, tapping on HAM6 chamber (ISCT6 side)
14:45: with OMC REFL beam diverter open, tapping on HAM6 chamber (ISCT6 side)
14:47: beam diverters closed again, tapping on HAM6 chamber (ISCT6 side)
All times 2015-10-19 local
I've made some plots based on the tap time Evan recorded (the recorded time seems off by half a minute or so compare to what really shows up in the accelerometer and DARM). Not all taps created signals in DARM but every signal that showed up in DARM has the same feature in a spectrogram (visible at ~0-300Hz, 900Hz, 2000Hz, 3000Hz, and 5000Hz. See attachment2). Timeseries also reveal that whether or not the tap would show up in DARM does not seems to depend on the overall amplitude of the tap (seen in HAM6 accelerometer, see attachment 3). PEM spectrum during different taps times doesn't seem to give any clue why one tap shows up in DARM more than the other (attachment 4,5). Apology for the wrong conclusion I drew earlier based on the spectrum I plotted using wrong GPS time (those plots have been deleted).
I zoomed in a little closer at higher frequency and realized this pattern is similiar to the unsolved n*505 glitches. Could this be a clue to figuring out the mechanism that caused the n*505?