keith.riles@LIGO.ORG - posted 18:22, Saturday 22 August 2015 - last comment - 01:08, Saturday 05 September 2015(20790)
Narrow lines in early ER8 DARM
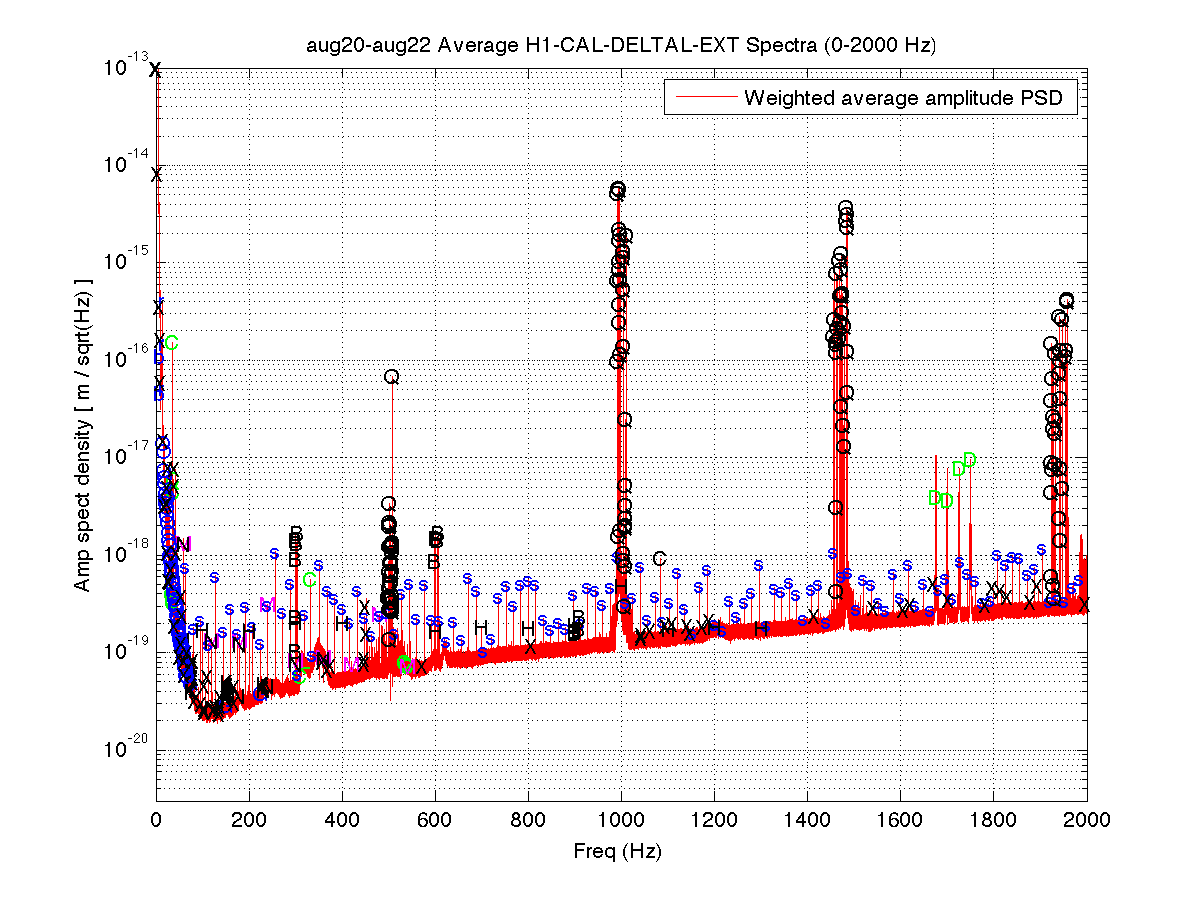
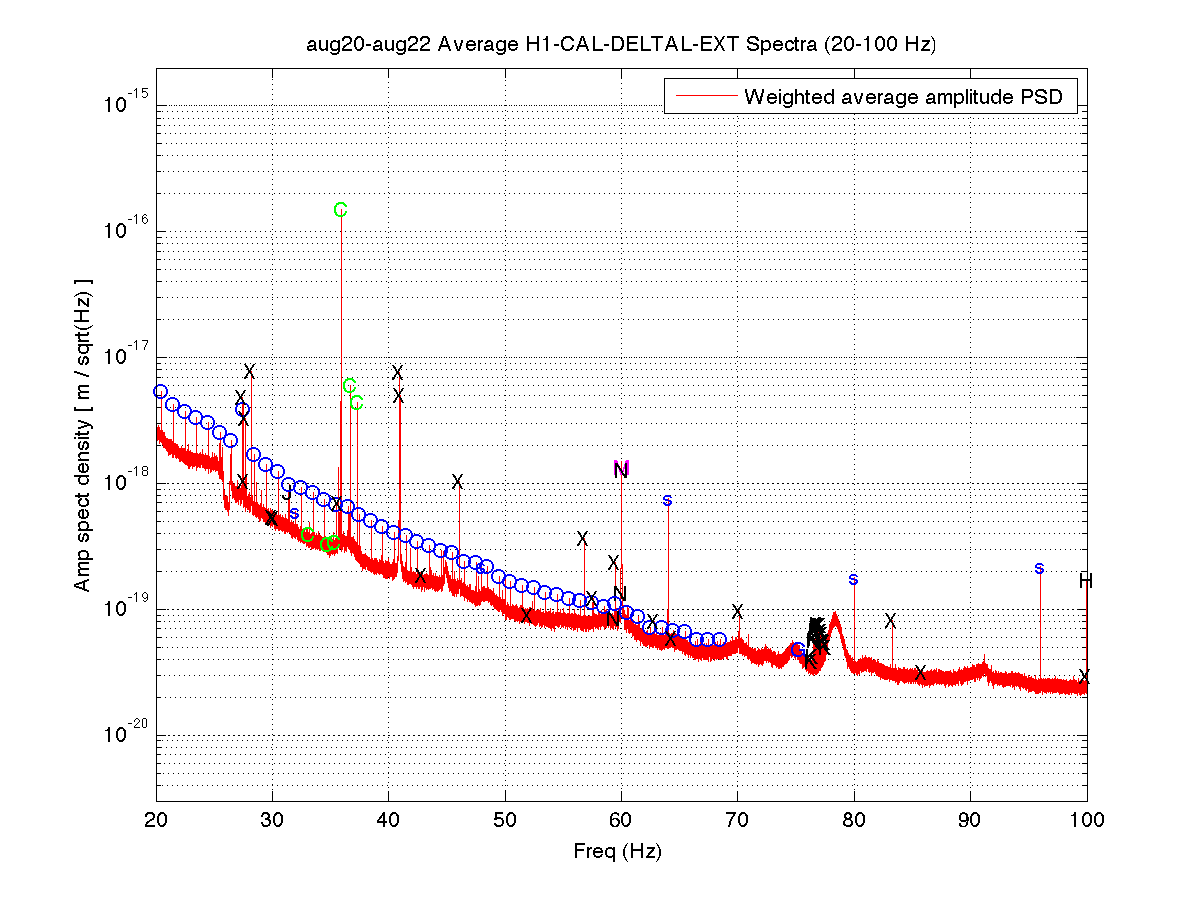
I took a look at the integrated DARM 0-2000 Hz spectrum from 50 hours of 30-minute FScans SFTs taken
over the last few days. A couple of sample plots are shown below, and a more extensive set of plots is
attached in a zip file. The alphabetic labels on narrow lines conform to those defined in this earlier pre-ER7 report.

Highlights and lowlights:
* The 0.1698-Hz comb seen before is gone.
* The 3.9994-Hz comb seen before is gone.
* The 36.9725-Hz comb seen before is gone.
* The 16-Hz comb seen in ER7 is still prevalent throughout the spectrum. The 64-Hz harmonics are no longer marked separately, since they don't seem as special as they once did.
* There is a new 1-Hz comb with a 0.5-Hz offset, that becomes visible at about 16.5 Hz and peters out around 69.5 Hz (for this integration time). This comb seems likely connected to there being strong digital lines at 0.5 Hz and 1 Hz.

There are some new single lines marked here and there (with 'x'), plus some new calibration lines. I have not removed singles marked previously, in case they reappear with deeper integrations to be done after more ER8 data is available.

Figure 1 - 0-2000 Hz
Figure 2 - 20-100 Hz (note the new 1-Hz comb marked with 'O' for 'One'
Images attached to this report
Non-image files attached to this report

Comments related to this report
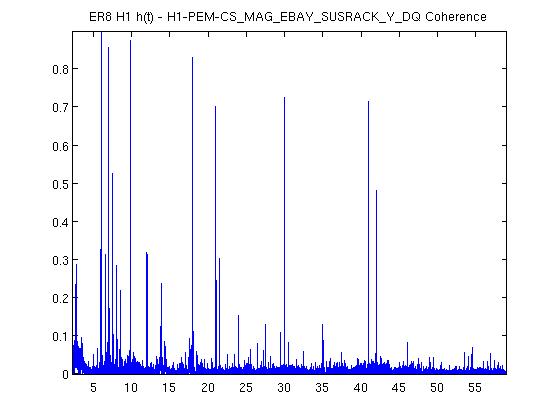
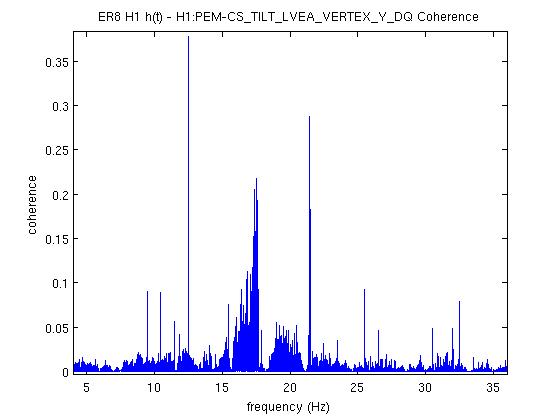
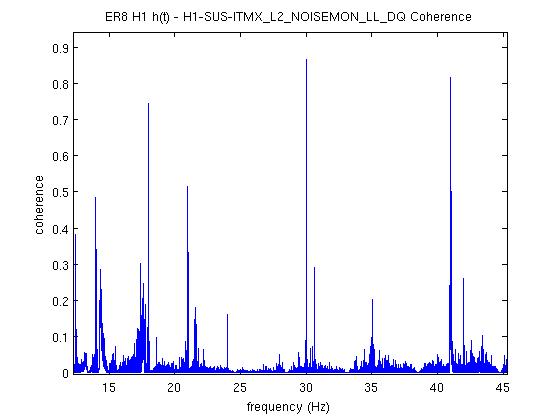
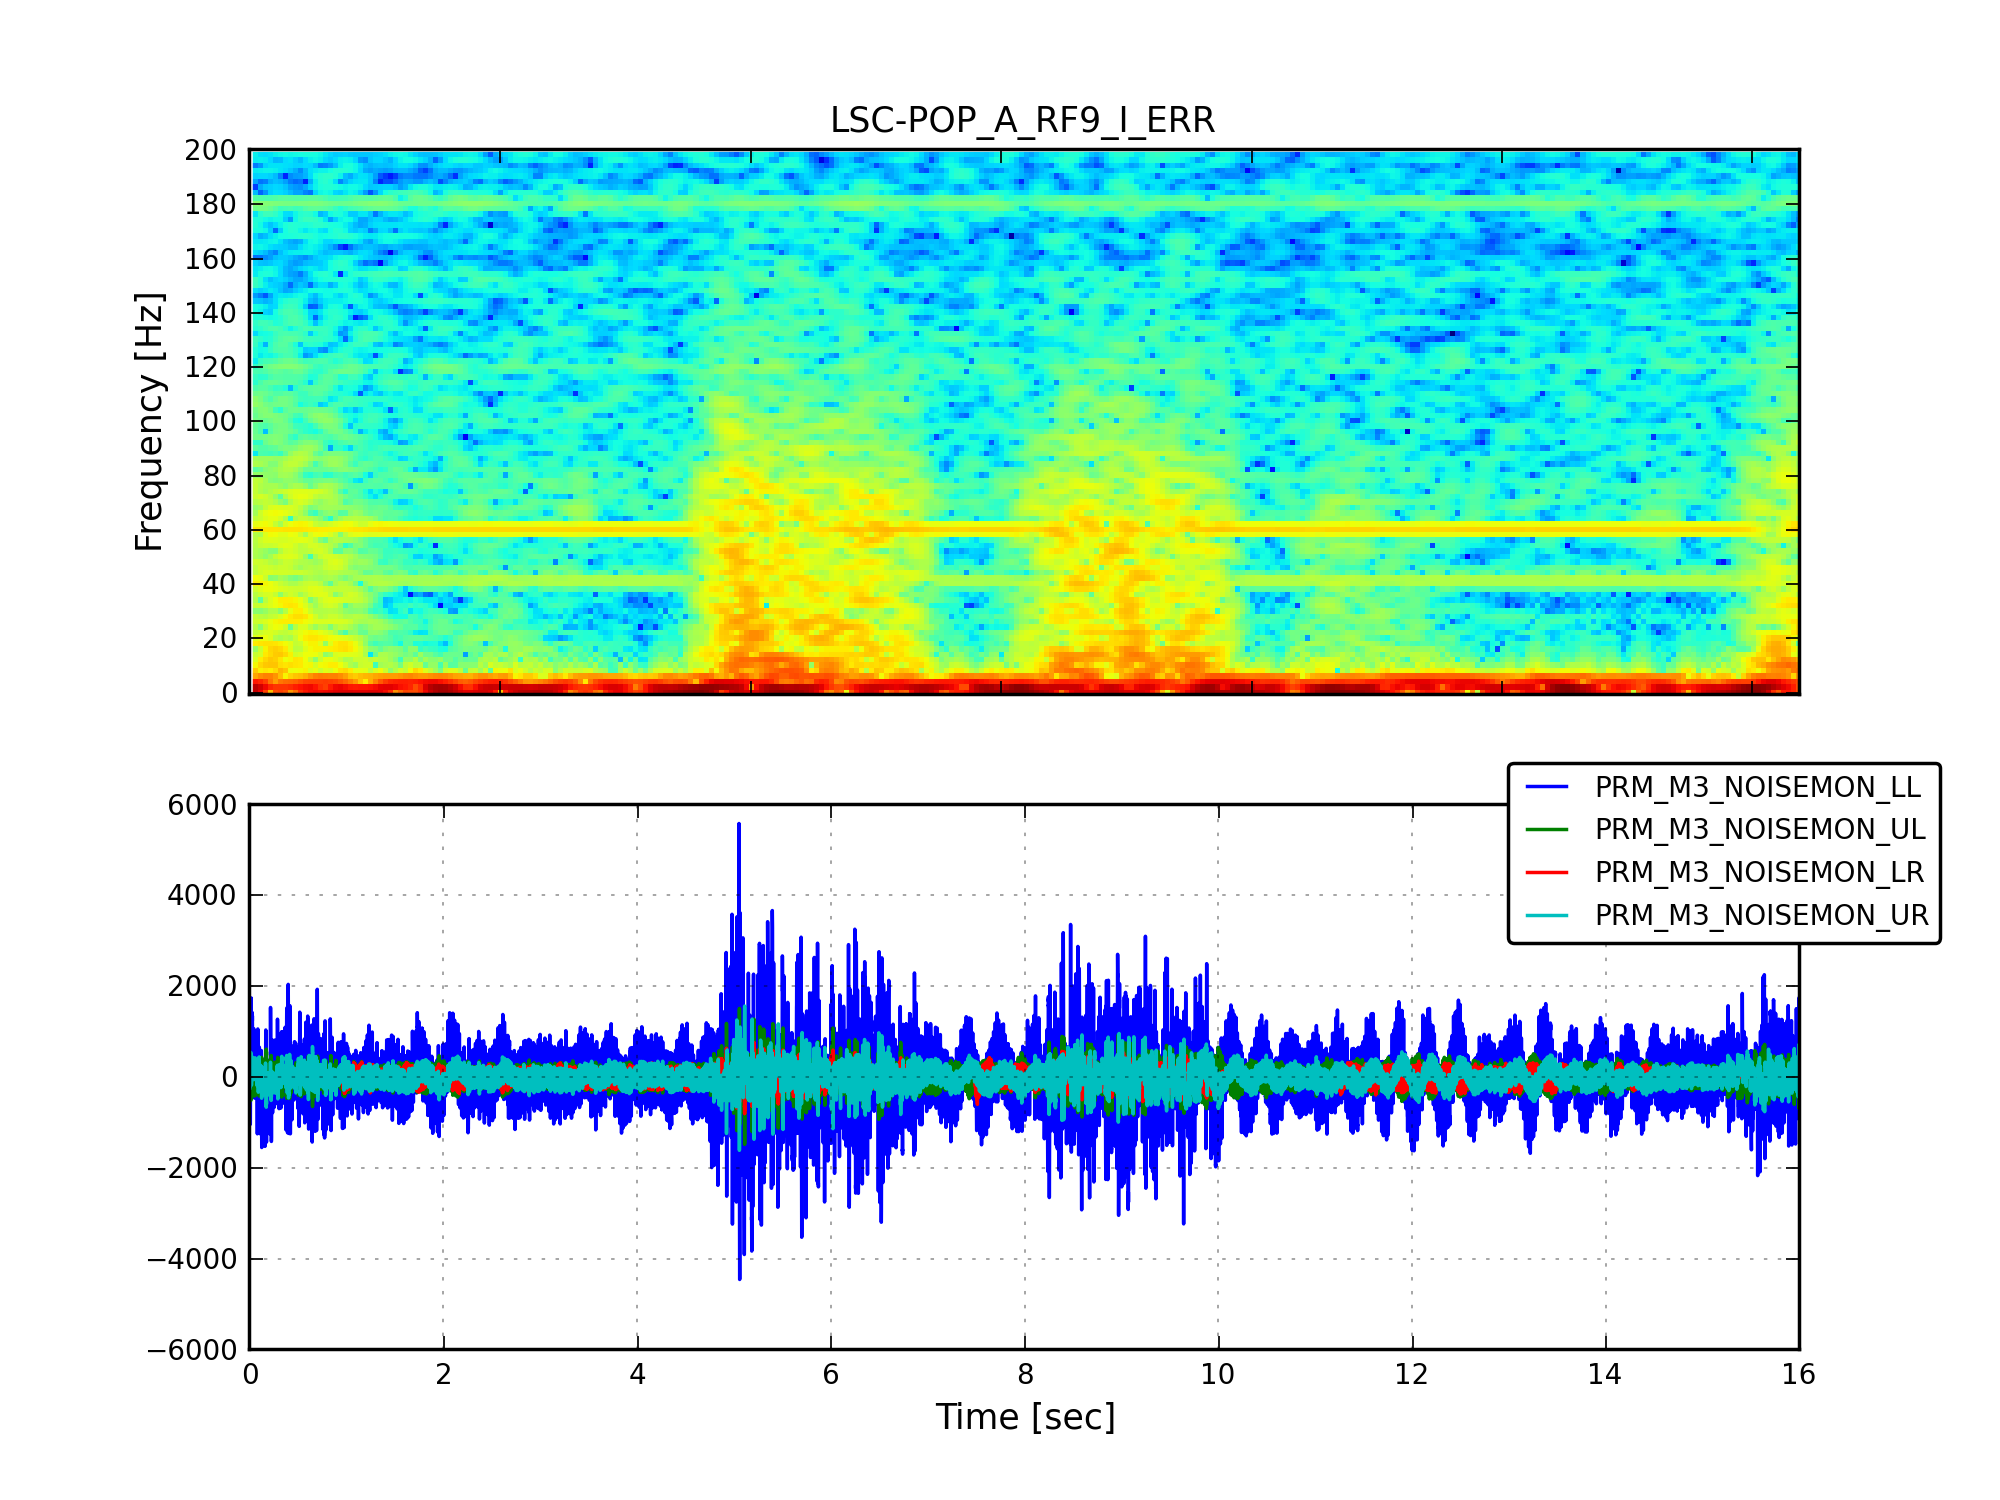
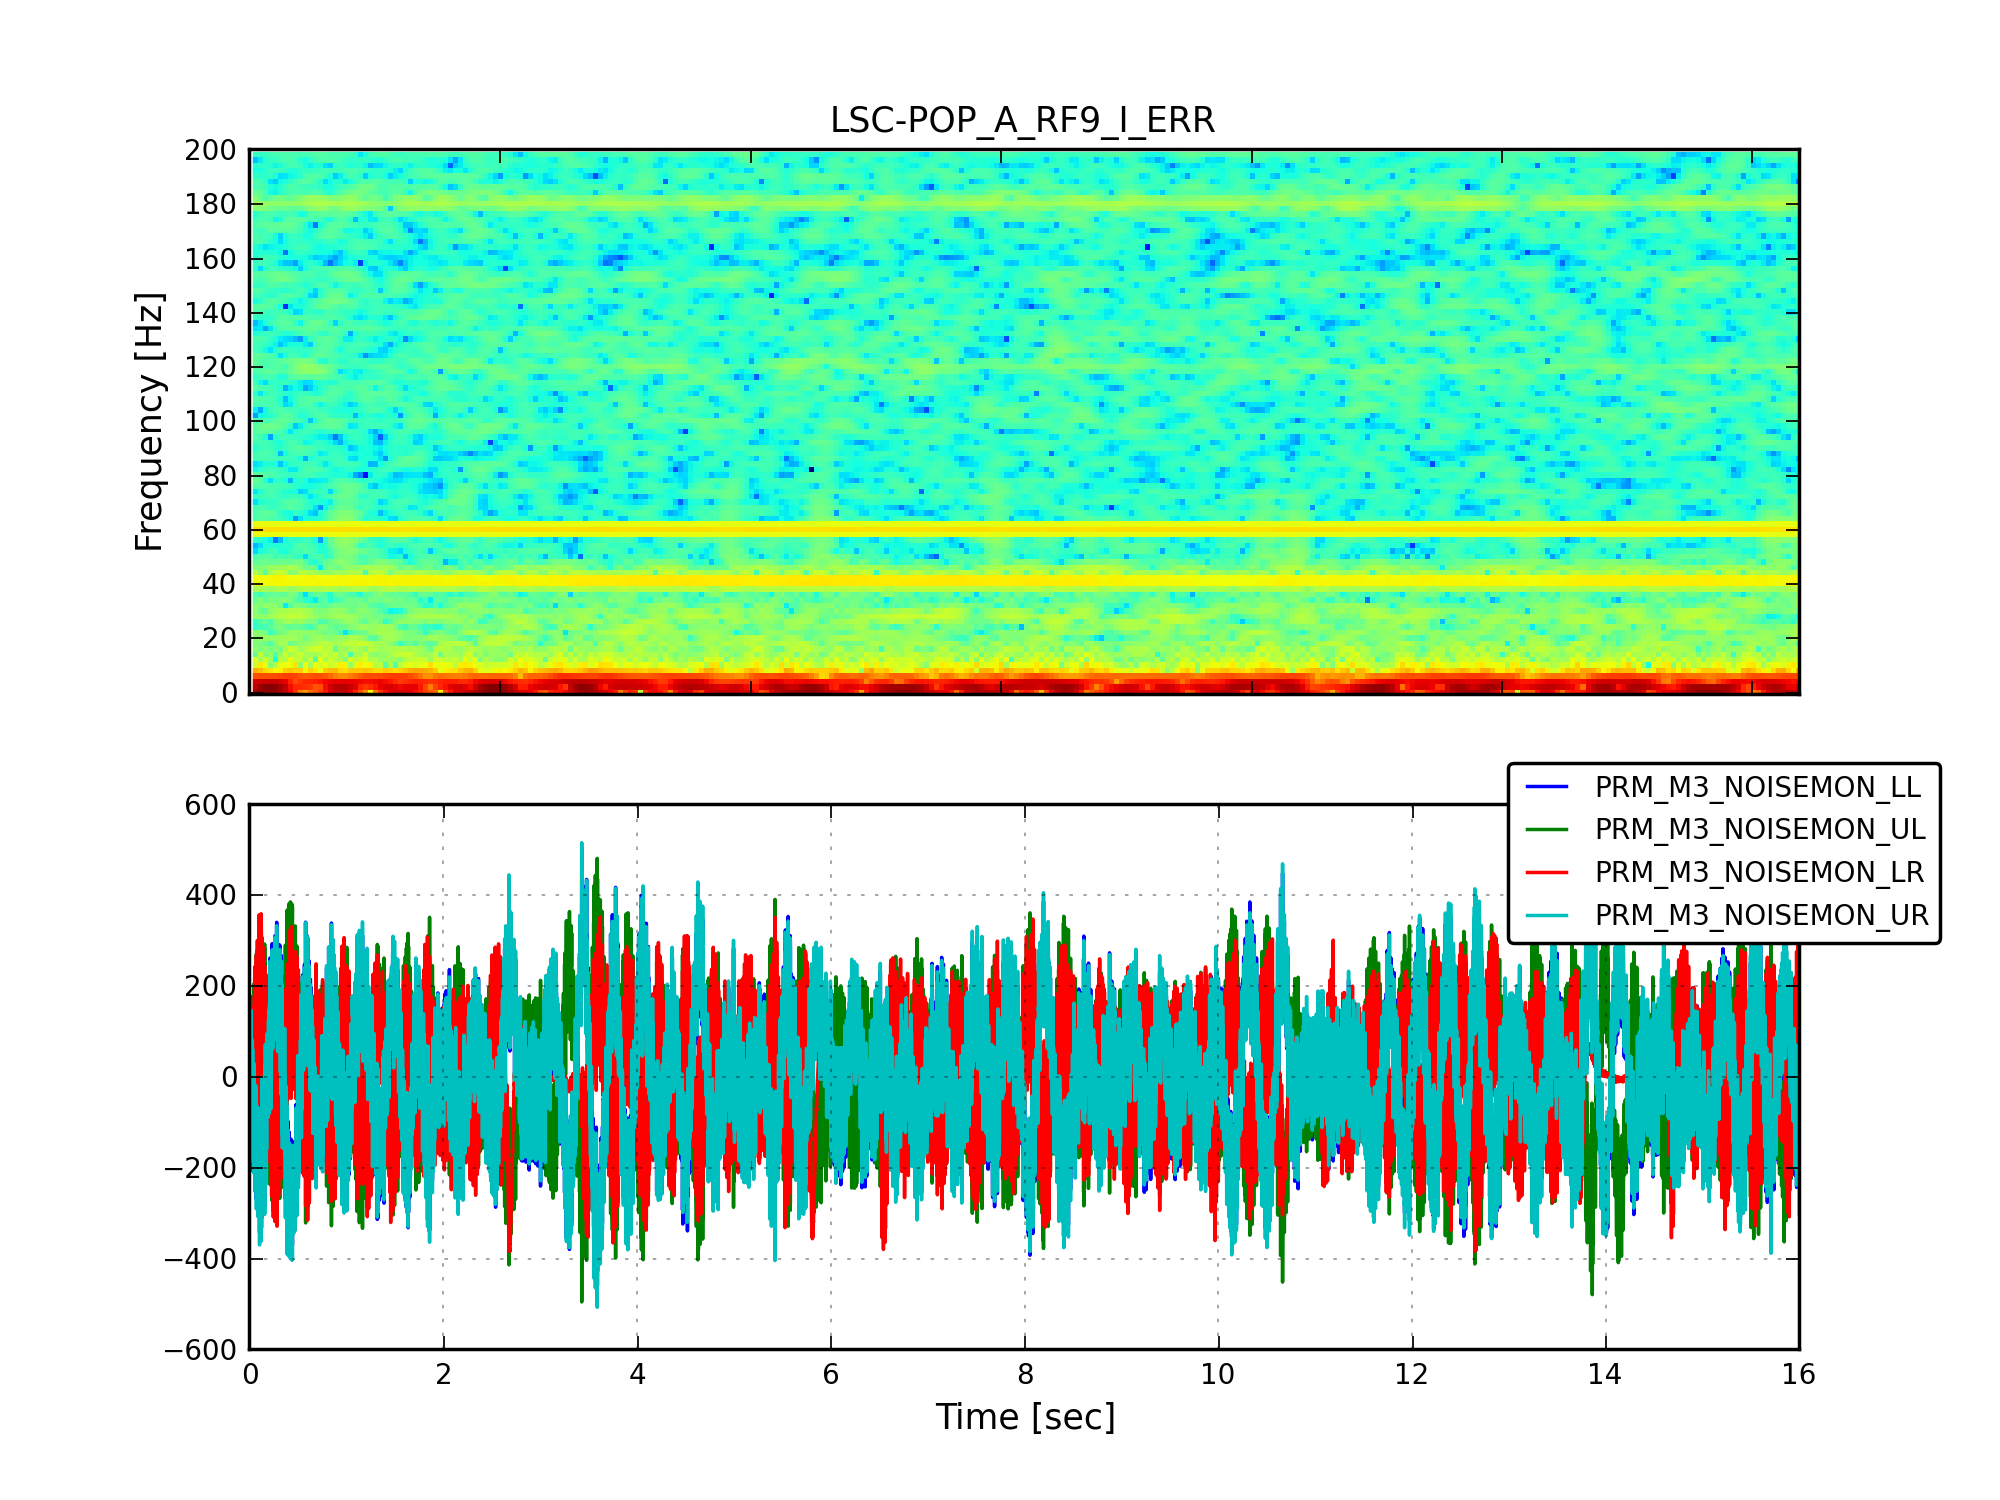
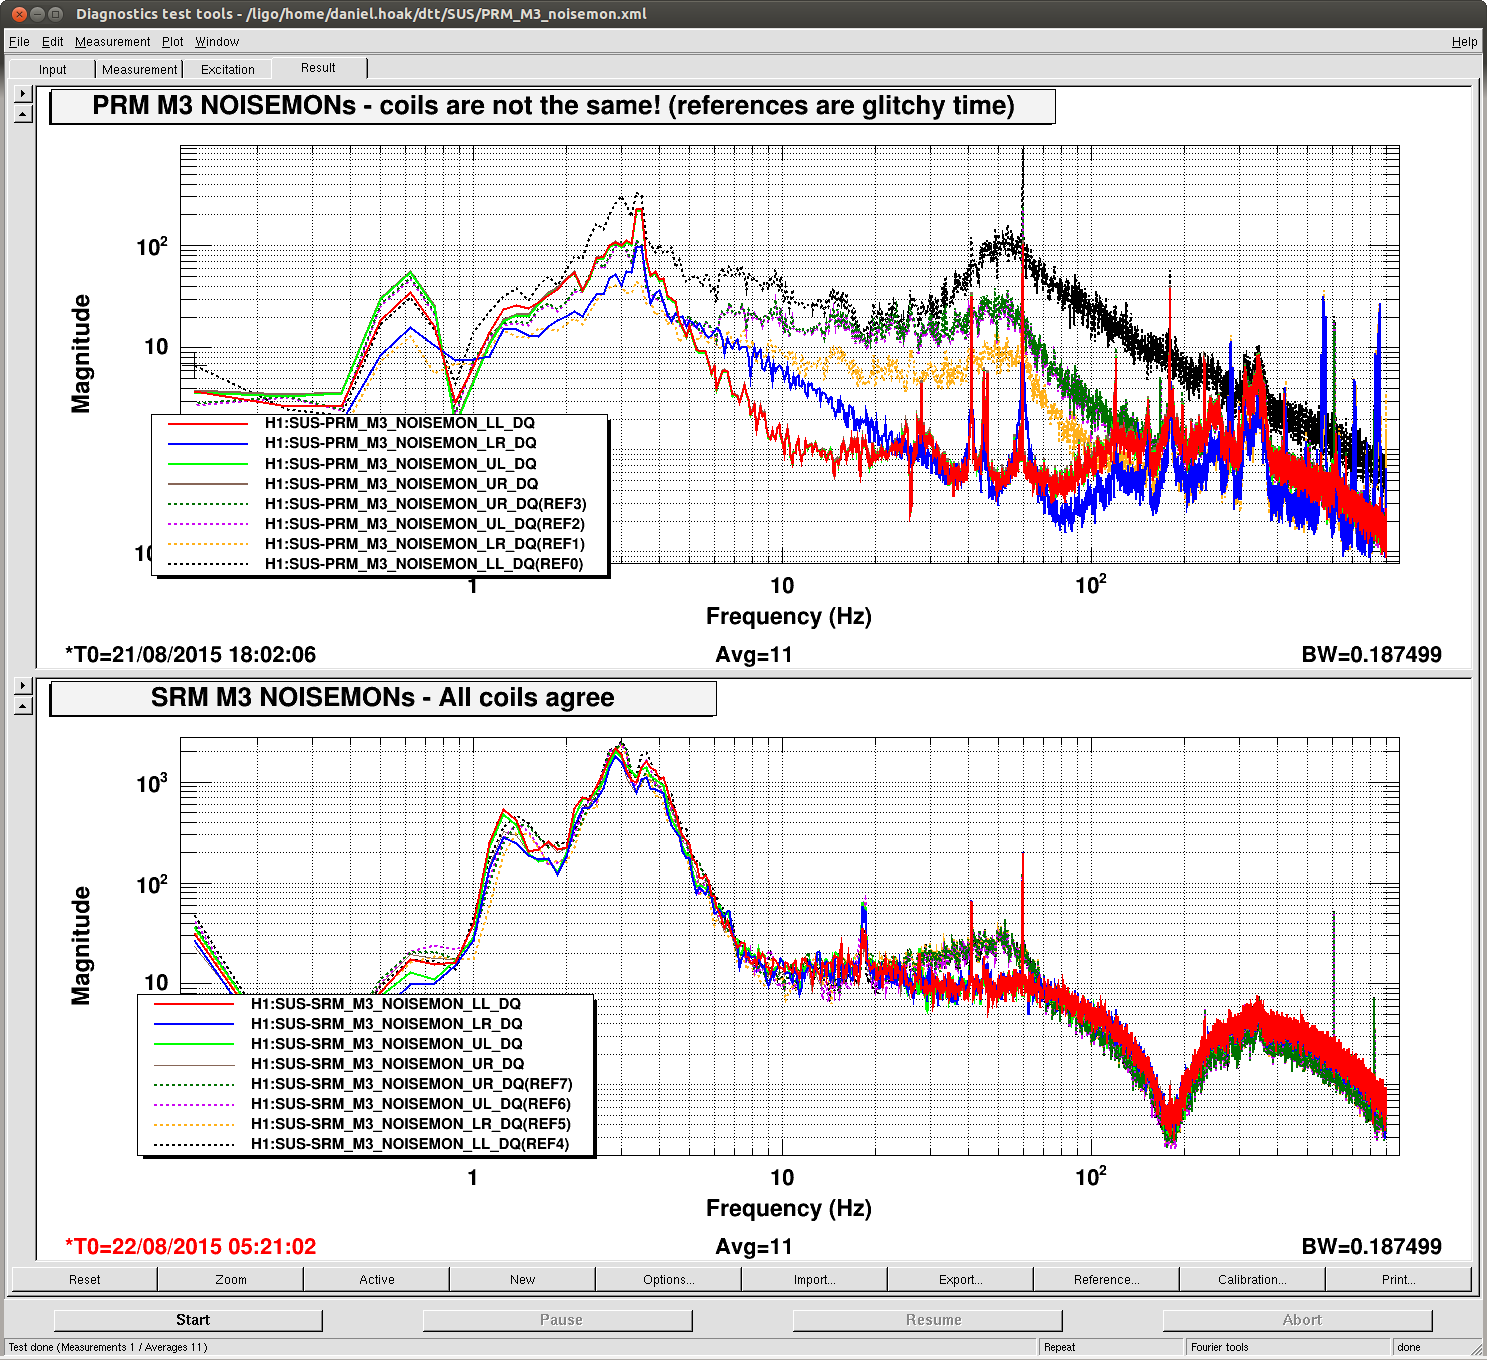
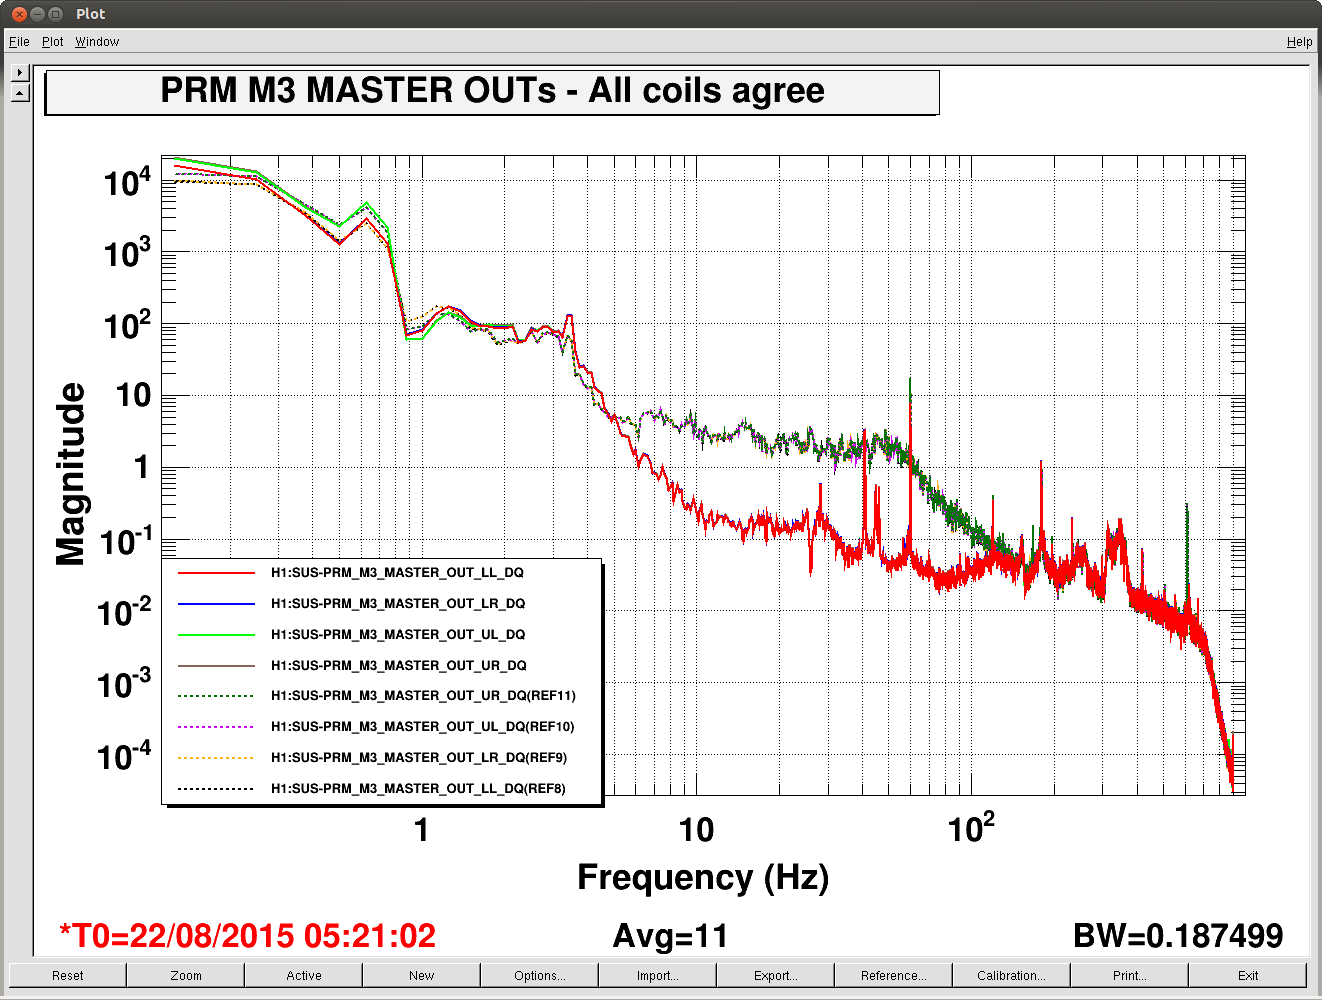
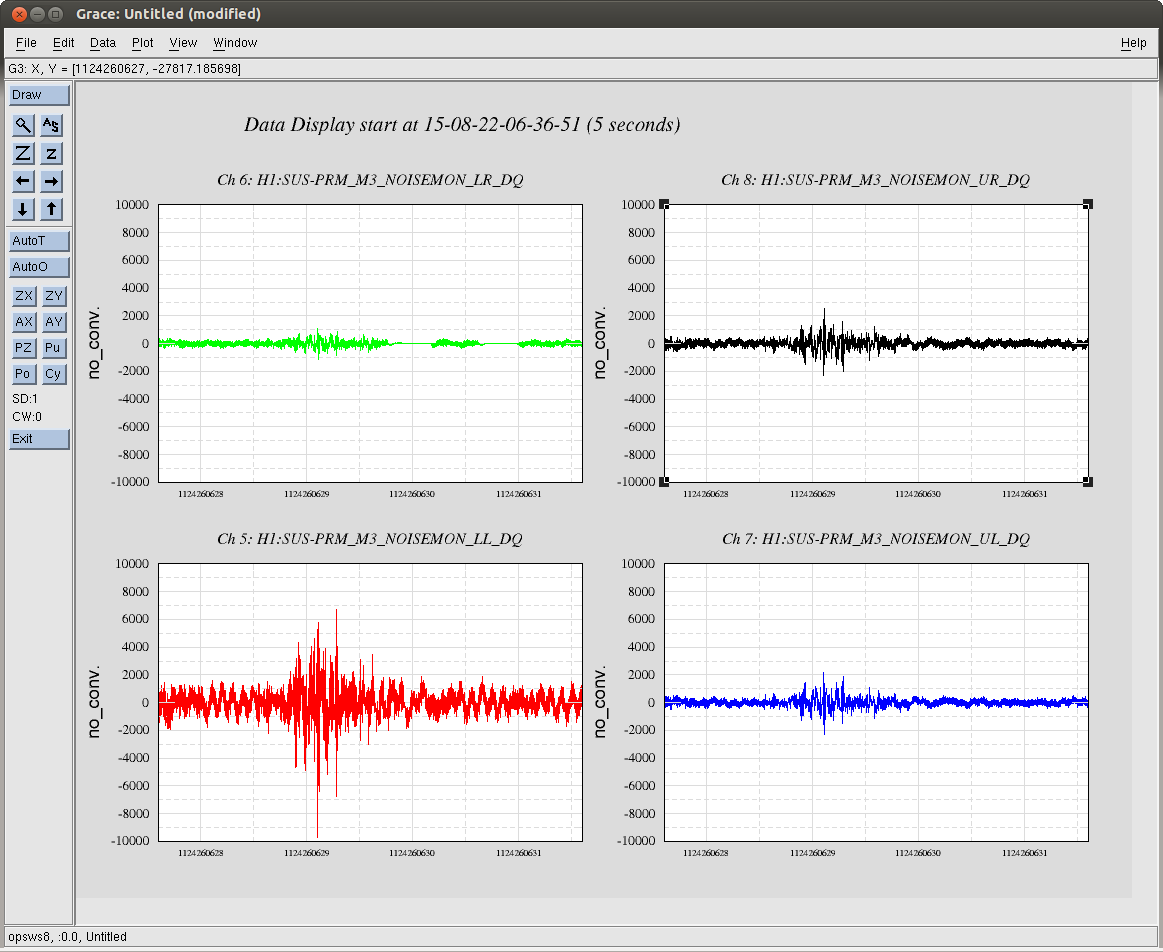
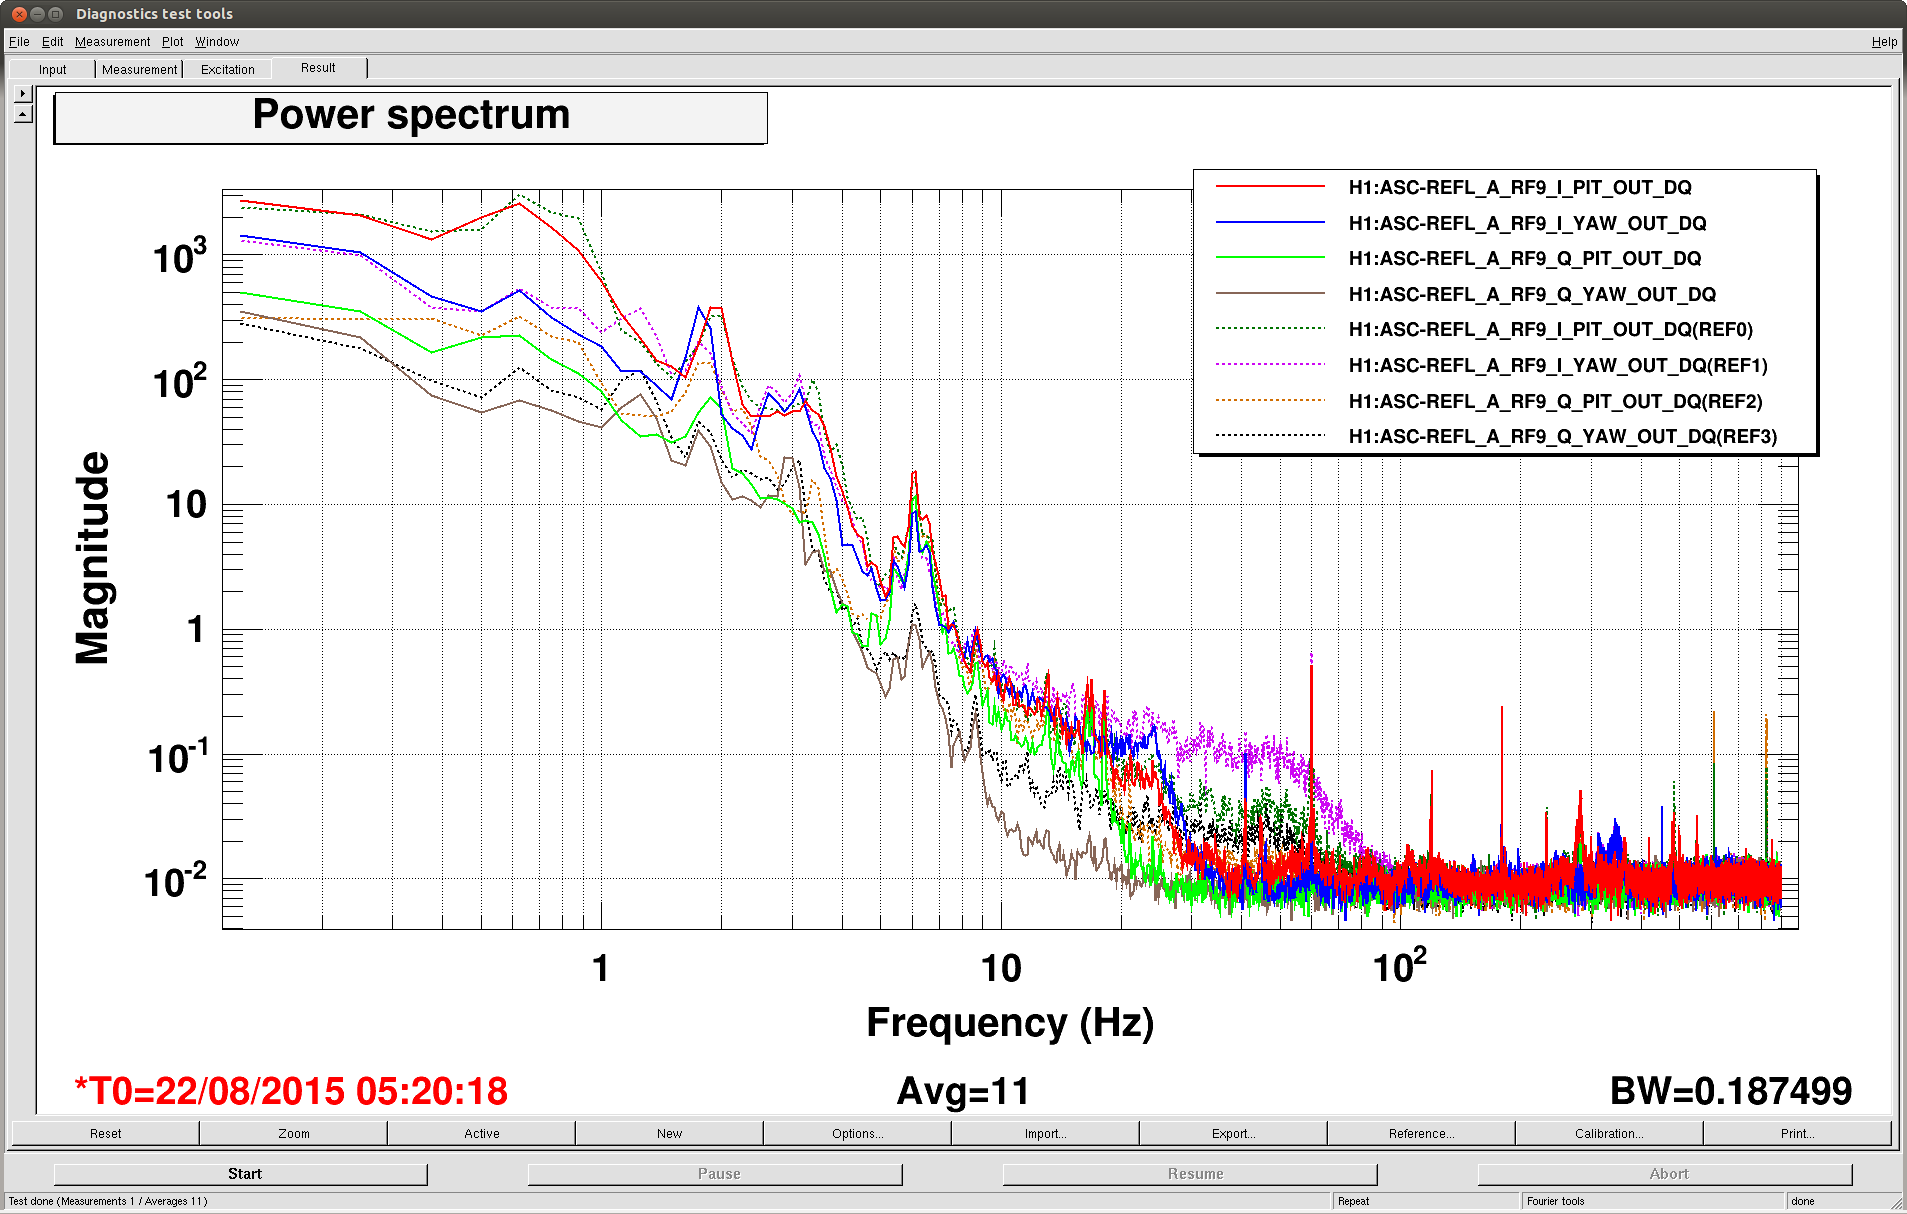
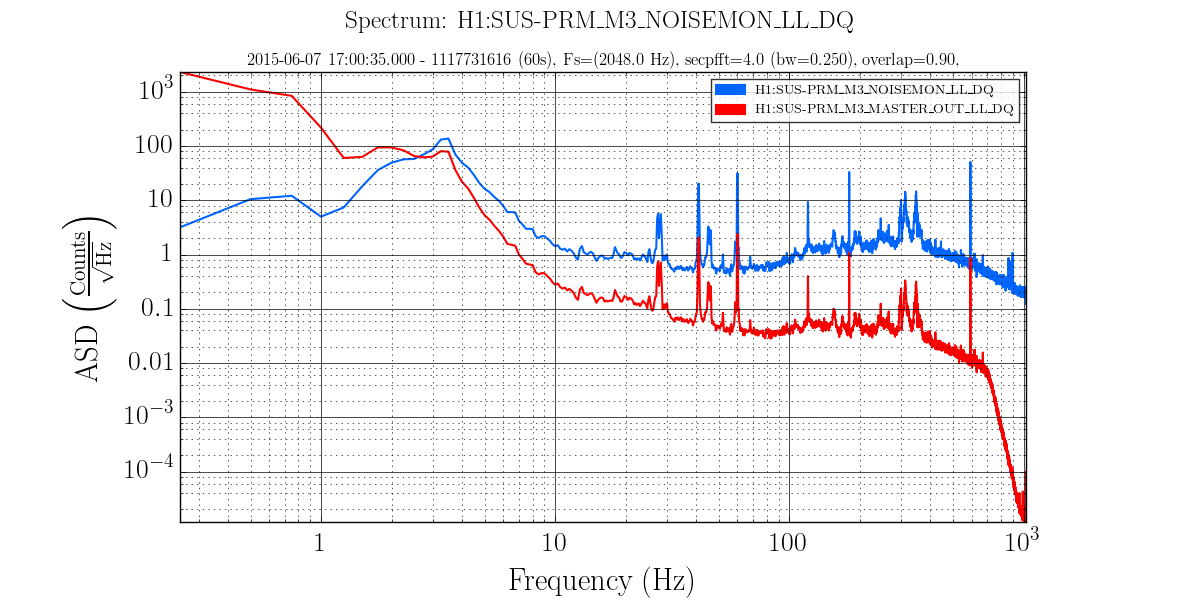
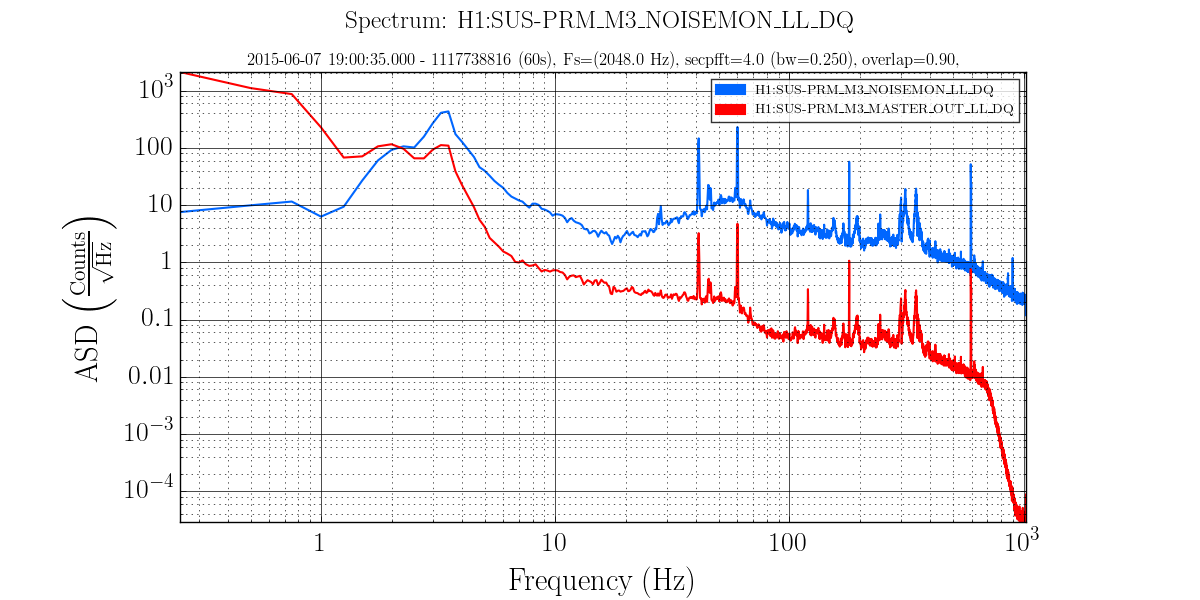
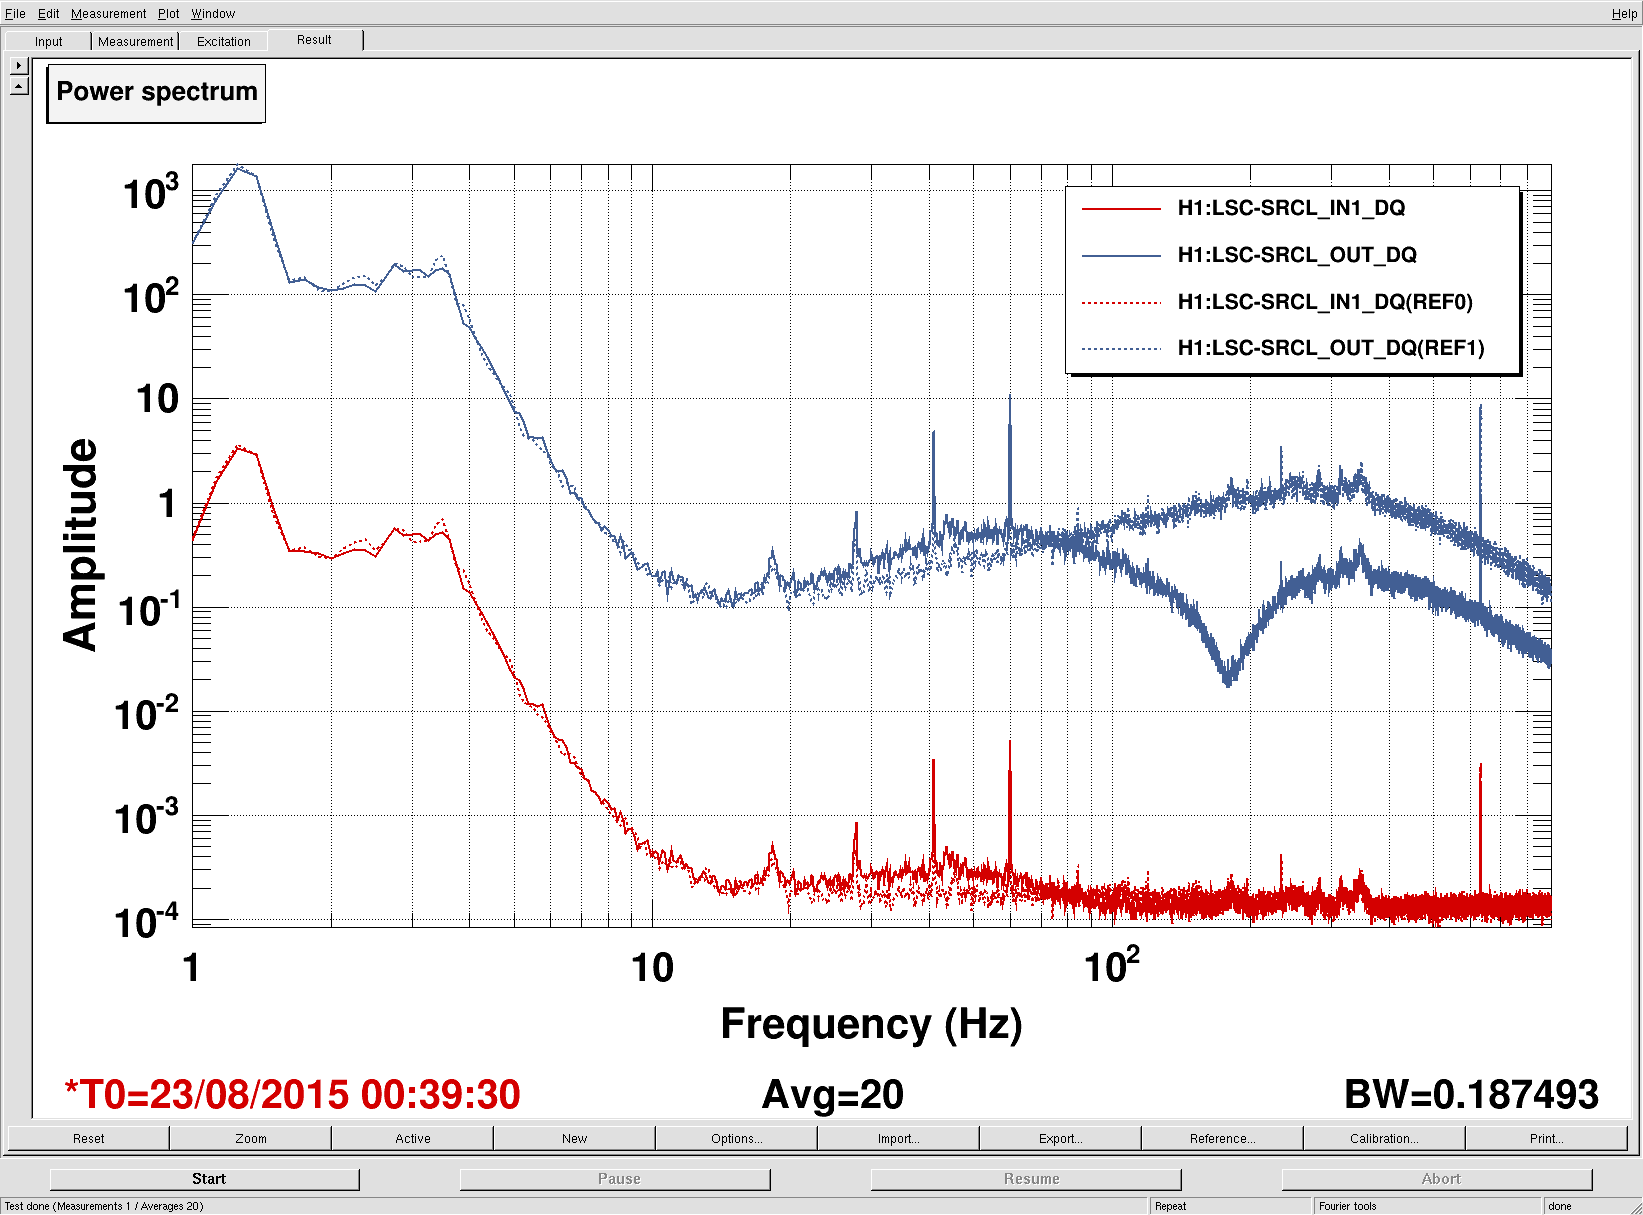
We ran the coherence tool on the first week of ER8 data at Hanford, and calculated the coherence between h(t) and numerous auxiliary channel. For the 1 mHz resolution, the results are here:
https://ldas-jobs.ligo-wa.caltech.edu/~eric.coughlin/ER7/LineSearch/H1_COH_1123891217_1124582417_SHORT_1_webpage/

We are looking into some of the lines that Keith Riles observed and summarized here
https://alog.ligo-wa.caltech.edu/aLOG/index.php?callRep=20790

Specifically, we concentrated on "There is a new 1-Hz comb with a 0.5-Hz offset, that becomes visible at about 16.5 Hz and peters out around 69.5 Hz (for this integration time). This comb seems likely connected to there being strong digital lines at 0.5 Hz and 1 Hz."

Here are the channels where we see this structure in the coherence, and a few observations as well for some of the channels

 H1:SUS-ITMY_L2_NOISEMON_UR_DQ_data
  There is a 16.5 Hz line here, and others off by 0.5 Hz at low frequencies.
 H1:SUS-ITMY_L2_NOISEMON_UL_DQ
 H1:SUS-ITMY_L2_NOISEMON_LR_DQ
 H1:SUS-ITMY_L2_MASTER_OUT_UR_DQ
 H1:SUS-ITMY_L2_MASTER_OUT_UL_DQ
 H1:SUS-ITMY_L2_MASTER_OUT_LR_DQ
 H1:SUS-ITMY_L2_MASTER_OUT_LL_DQ
 H1:SUS-ITMX_L2_NOISEMON_UR_DQ
 H1:SUS-ITMX_L2_NOISEMON_UL_DQ
 H1:SUS-ITMX_L2_NOISEMON_LL_DQ
  Coherence at 10.0, 12.0, 12.5, 14.0, 15.5, 18.0 (big), 21.0, 24.0 30.0 Hz etc
 H1:SUS-ITMX_L2_MASTER_OUT_UR_DQ
 H1:SUS-ITMX_L2_MASTER_OUT_UL_DQ
 H1:SUS-ITMX_L2_MASTER_OUT_LR_DQ
 H1:SUS-ITMX_L2_MASTER_OUT_LL_DQ
 H1:SUS-ETMY_L3_MASTER_OUT_UR_DQ
 H1:SUS-ETMY_L3_MASTER_OUT_UL_DQ
 H1:SUS-ETMY_L3_MASTER_OUT_LR_DQ
 H1:SUS-ETMY_L3_MASTER_OUT_LL_DQ
 H1:SUS-ETMY_L2_NOISEMON_UR_DQ
 H1:SUS-ETMY_L2_NOISEMON_UL_DQ
 H1:SUS-ETMY_L2_MASTER_OUT_UR_DQ
 H1:SUS-ETMY_L2_MASTER_OUT_UL_DQ
 H1:SUS-ETMY_L2_MASTER_OUT_LR_DQ
 H1:SUS-ETMY_L2_MASTER_OUT_LL_DQ
 H1:SUS-ETMX_L3_MASTER_OUT_UR_DQ
 H1:SUS-ETMX_L3_MASTER_OUT_UL_DQ
 H1:SUS-ETMX_L3_MASTER_OUT_LR_DQ
 H1:SUS-ETMX_L3_MASTER_OUT_LL_DQ
 H1:SUS-ETMX_L2_NOISEMON_UR_DQ
 H1:SUS-ETMX_L2_NOISEMON_UL_DQ5
 H1:SUS-ETMX_L2_NOISEMON_LR_DQ
 H1:SUS-ETMX_L2_NOISEMON_LL_DQ
 H1:SUS-ETMX_L2_MASTER_OUT_UR_DQ
 H1:SUS-ETMX_L2_MASTER_OUT_UL_DQ
 H1:SUS-ETMX_L2_MASTER_OUT_LR_DQ
 H1:SUS-ETMX_L2_MASTER_OUT_LL_DQ
 H1:PEM-EY_MAG_EBAY_SUSRACK_Z_DQ
  16.5 Hz is here. And more 0.5 Hz harmonics after. Not super strong, but they are there.
 H1:PEM-CS_TILT_LVEA_VERTEX_Y_DQ
  Not clear for this channel. A real mess of lines at low frequencies. 25.5 Hz is distinct. Also 12.5, 26.5, 30.5, 32.5 Hz too.
 H1:PEM-CS_TILT_LVEA_VERTEX_X_DQ
  Also a mess at 16.5 Hz, but the line is there. There are lines at 12.5, 14.5, 32.0, 40.0 Hz
 H1:PEM-CS_MAG_LVEA_OUTPUTOPTICS_X_DQ
  Starts at 14.5 Hz, and the lines then appear consistently every 0.5Hz.
 H1:PEM-CS_MAG_LVEA_OUTPUTOPTICS_QUAD_SUM_DQ
 H1:PEM-CS_MAG_EBAY_SUSRACK_Z_DQ
  Seems to start at 14.5 Hz, and then this 0.5 Hz harmonic continues to appear noticeably and consistently.
 H1:PEM-CS_MAG_EBAY_SUSRACK_Y_DQ
6.0, 7.0, 7.5, 8.0, 8.5, 12.0 Hz, then some small but observable coherences continue at 15.0, 15.5, 16.0, 16.5 Hz. 18.0 Hz and 21.0, 21.5, 22.5, 23.5, 24.0, 30.0, 35.0  Hz are big again.
 H1:PEM-CS_MAG_EBAY_SUSRACK_X_DQ

Some example coherence plots are given.

Nelson, Michael Coughlin, Eric Coughlin, Pat Meyers
Images attached to this comment