ShivarajK, JeffreyK, DarkhanT,
Overview
To reduce phase systematics in the DARM OLGTF model we've adjusted time delays/advances in the actuation and the sensing functions of the DARM loop Matlab model.
With the included 15 us of time-advance into the actuation function, the phase residuals of each of the actuation stage TFs up to 100 Hz measured on Aug. 26 - 29 are under 2 deg at high frequencies (except for L1 stage which is about 5 deg, which is ok because at high frequencies we rely mostly on L3 stage actuation), and the overall actuation function rediduals at high frequencies to mostly under 3 deg (Fig. 1).
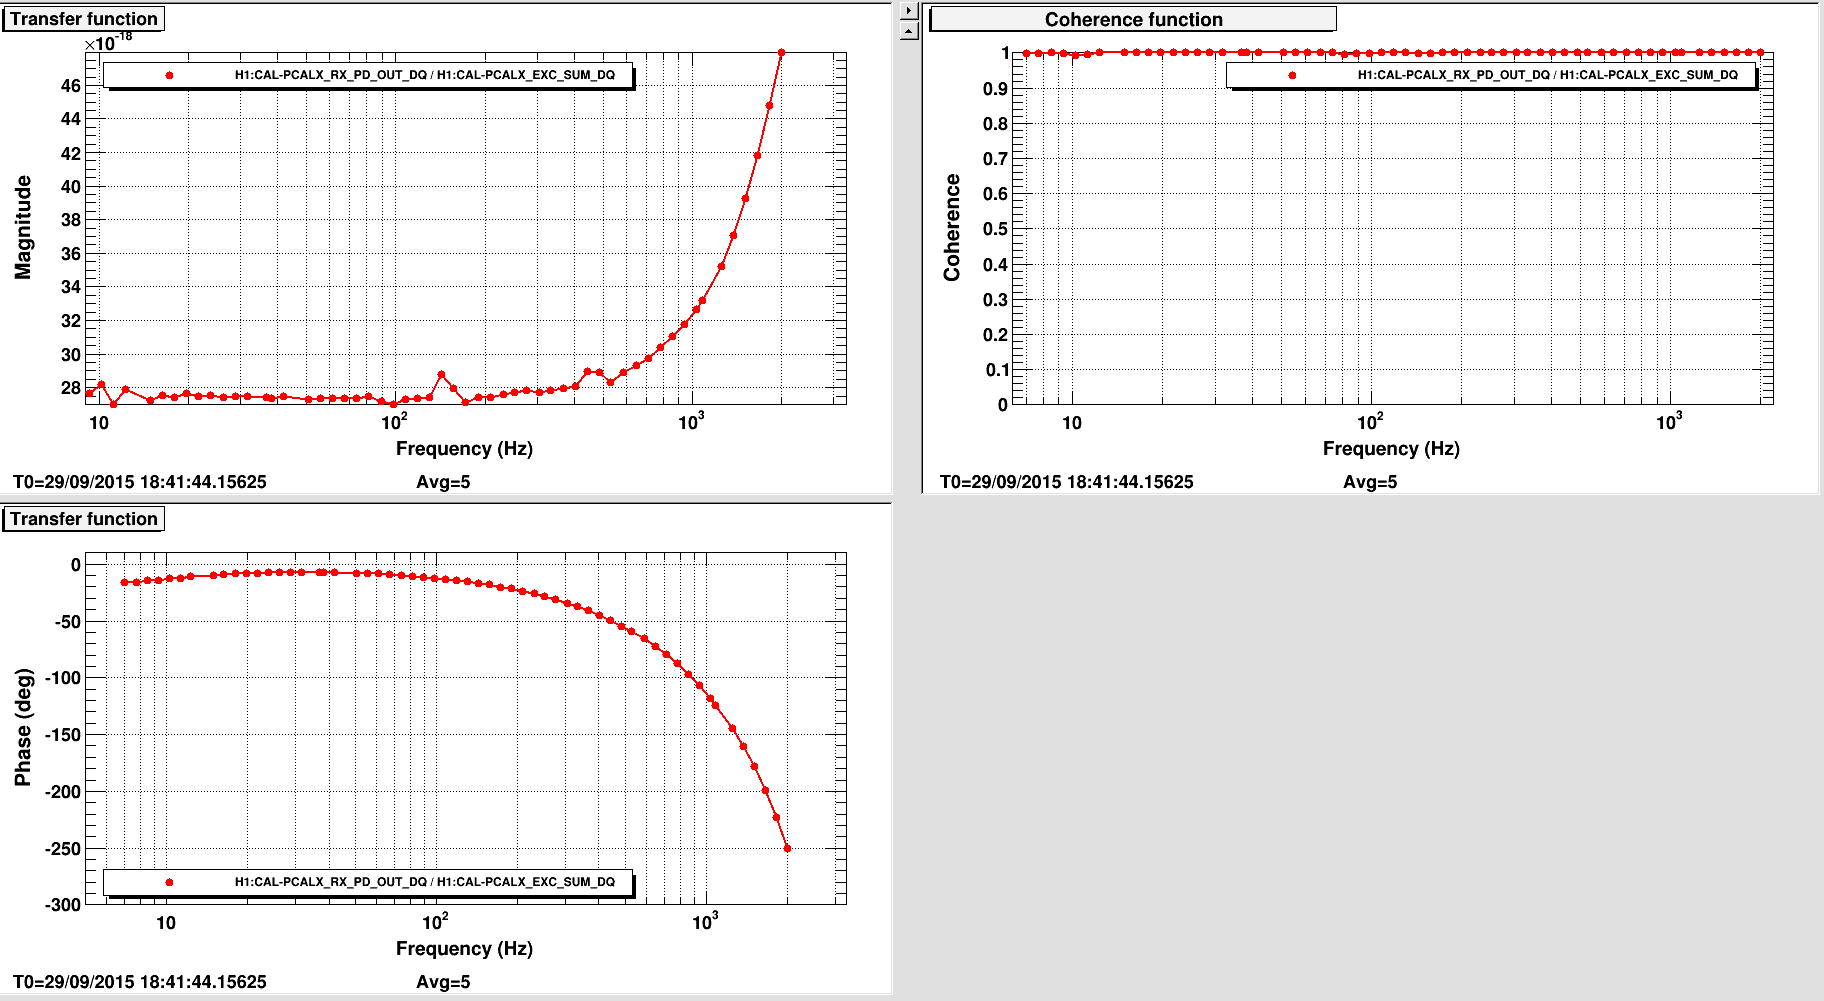
To reduce sensing function phase residuals we have added 14 us of time-advance, which is similar to the correction introduced into LLO DARM model for O1 (see LLO alog 20894); with this additional time-advance the sensing function phase residual is mostly under 2 deg (Fig. 2).
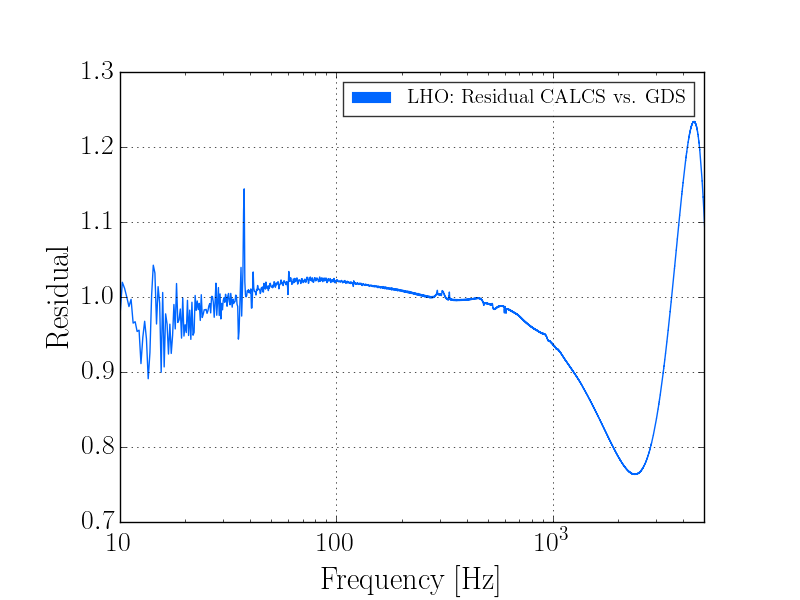
DARM OLGTF model for O1 with included actuation and sensing function time delay/advance corrections have phase redisuals that are mostly under 2 deg (Fig. 4).
For GDS pipeline corrections: time delays in the updated H1 DARM model for O1 are:
-
par.t.actuation = 114.6997 us
-
par.t.sensing + par.t.armDelay = 75.6181 us
Details
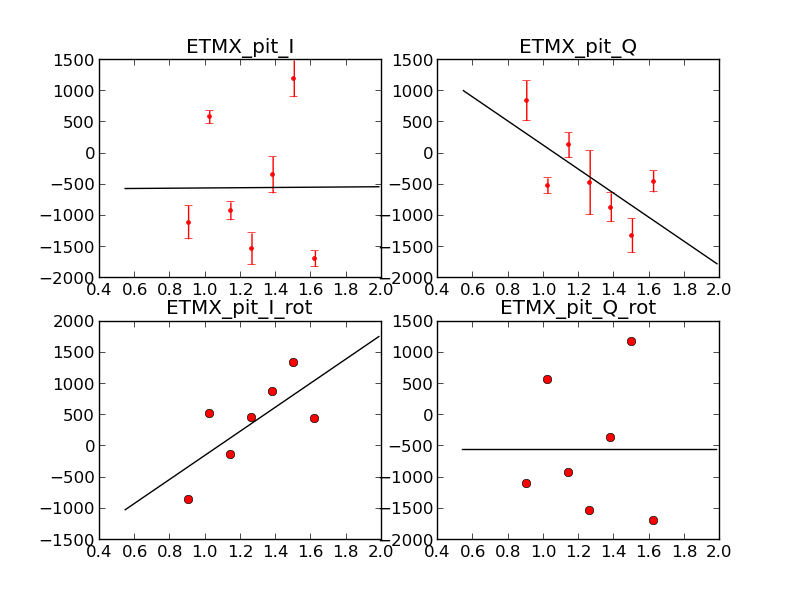
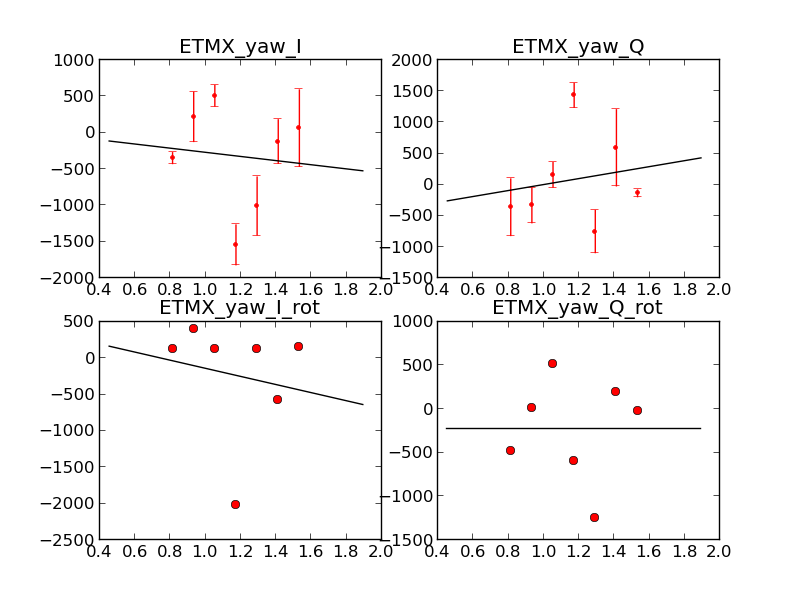
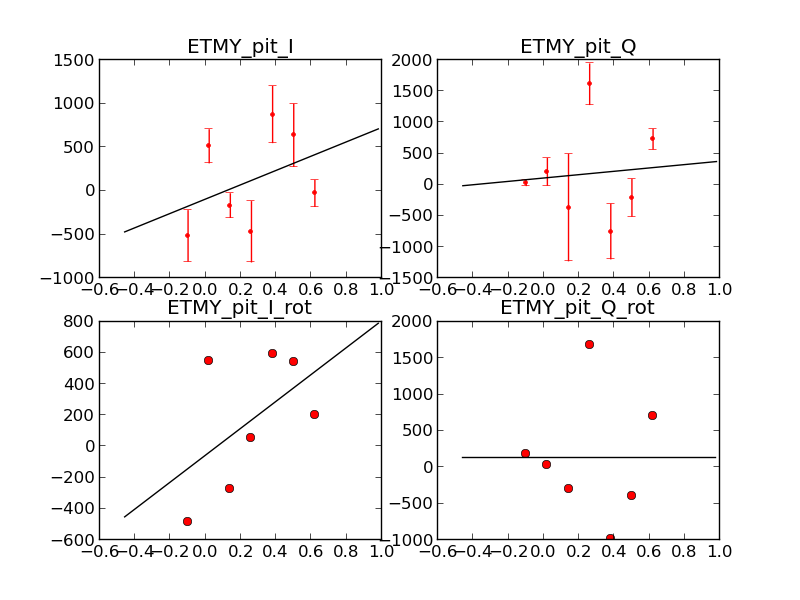
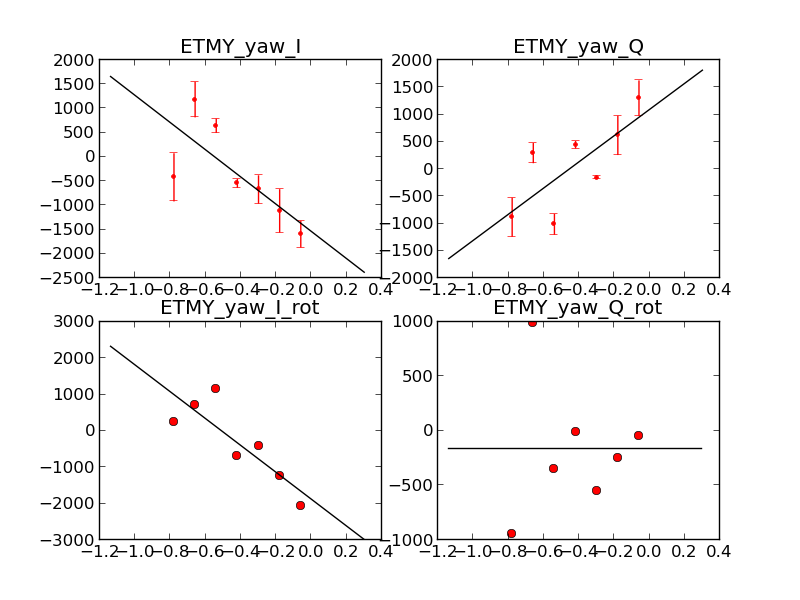
In the DARMOLGTF model for O1 we had systematic phase residuals, which we planned to account for by adding time delay/advances into the actuation and the sensing functions (see LHO alog 21827). In the H1DARM model for O1 we implemented the time delay/advance correction capability via par.t.unknown_actuation and par.t.unknown_sensing parameters. After that we revisited actuation function stages' redisuals by looking at the plots produced using cmpActCoeffs_viaPcal_O1.m and analyze_pcal_20150928.m (this is a modified version of a script used at LLO, analyze_pcal_20150903.m, see LLO alog 20894), and confirmed that actuation stages with the included 15 us time advance correction show <2 deg residuals (under 5 deg for L1), Fig. 5, 6, 7; we still have ~ 2 % systematic residual in actuation magnitudes that we are leaving unchanged in the Matlab DARM model and the CAL-CS front-end filter modules (Fig. 8, 9, 10).
We modified "H1DARMparams_1125963332.m", "H1DARMparams_1127083151.m" and their kappa corrected versions and re-run CompareDARMOLGTFs_01.m.1 Comparison plots show that:
-
κtst and κC corrected actuation function model vs. measurements has residuals of mostly under 2% in magnitude and 3 deg in phase (Fig. 11);
-
κtst and κC corrected sensing function has residuals of mostly ~2% systematic +/-2% in magnitude and under 2 deg in phase (Fig. 12);
-
κtst and κC corrected DARM OLG TF model has residuals of mostly <2% in magnitude and +/-2 deg in phase (Fig. 13); in the frequency range [500 .. 700] Hz residuals are larger (could be due to low measurement coherence, Fig. 4).
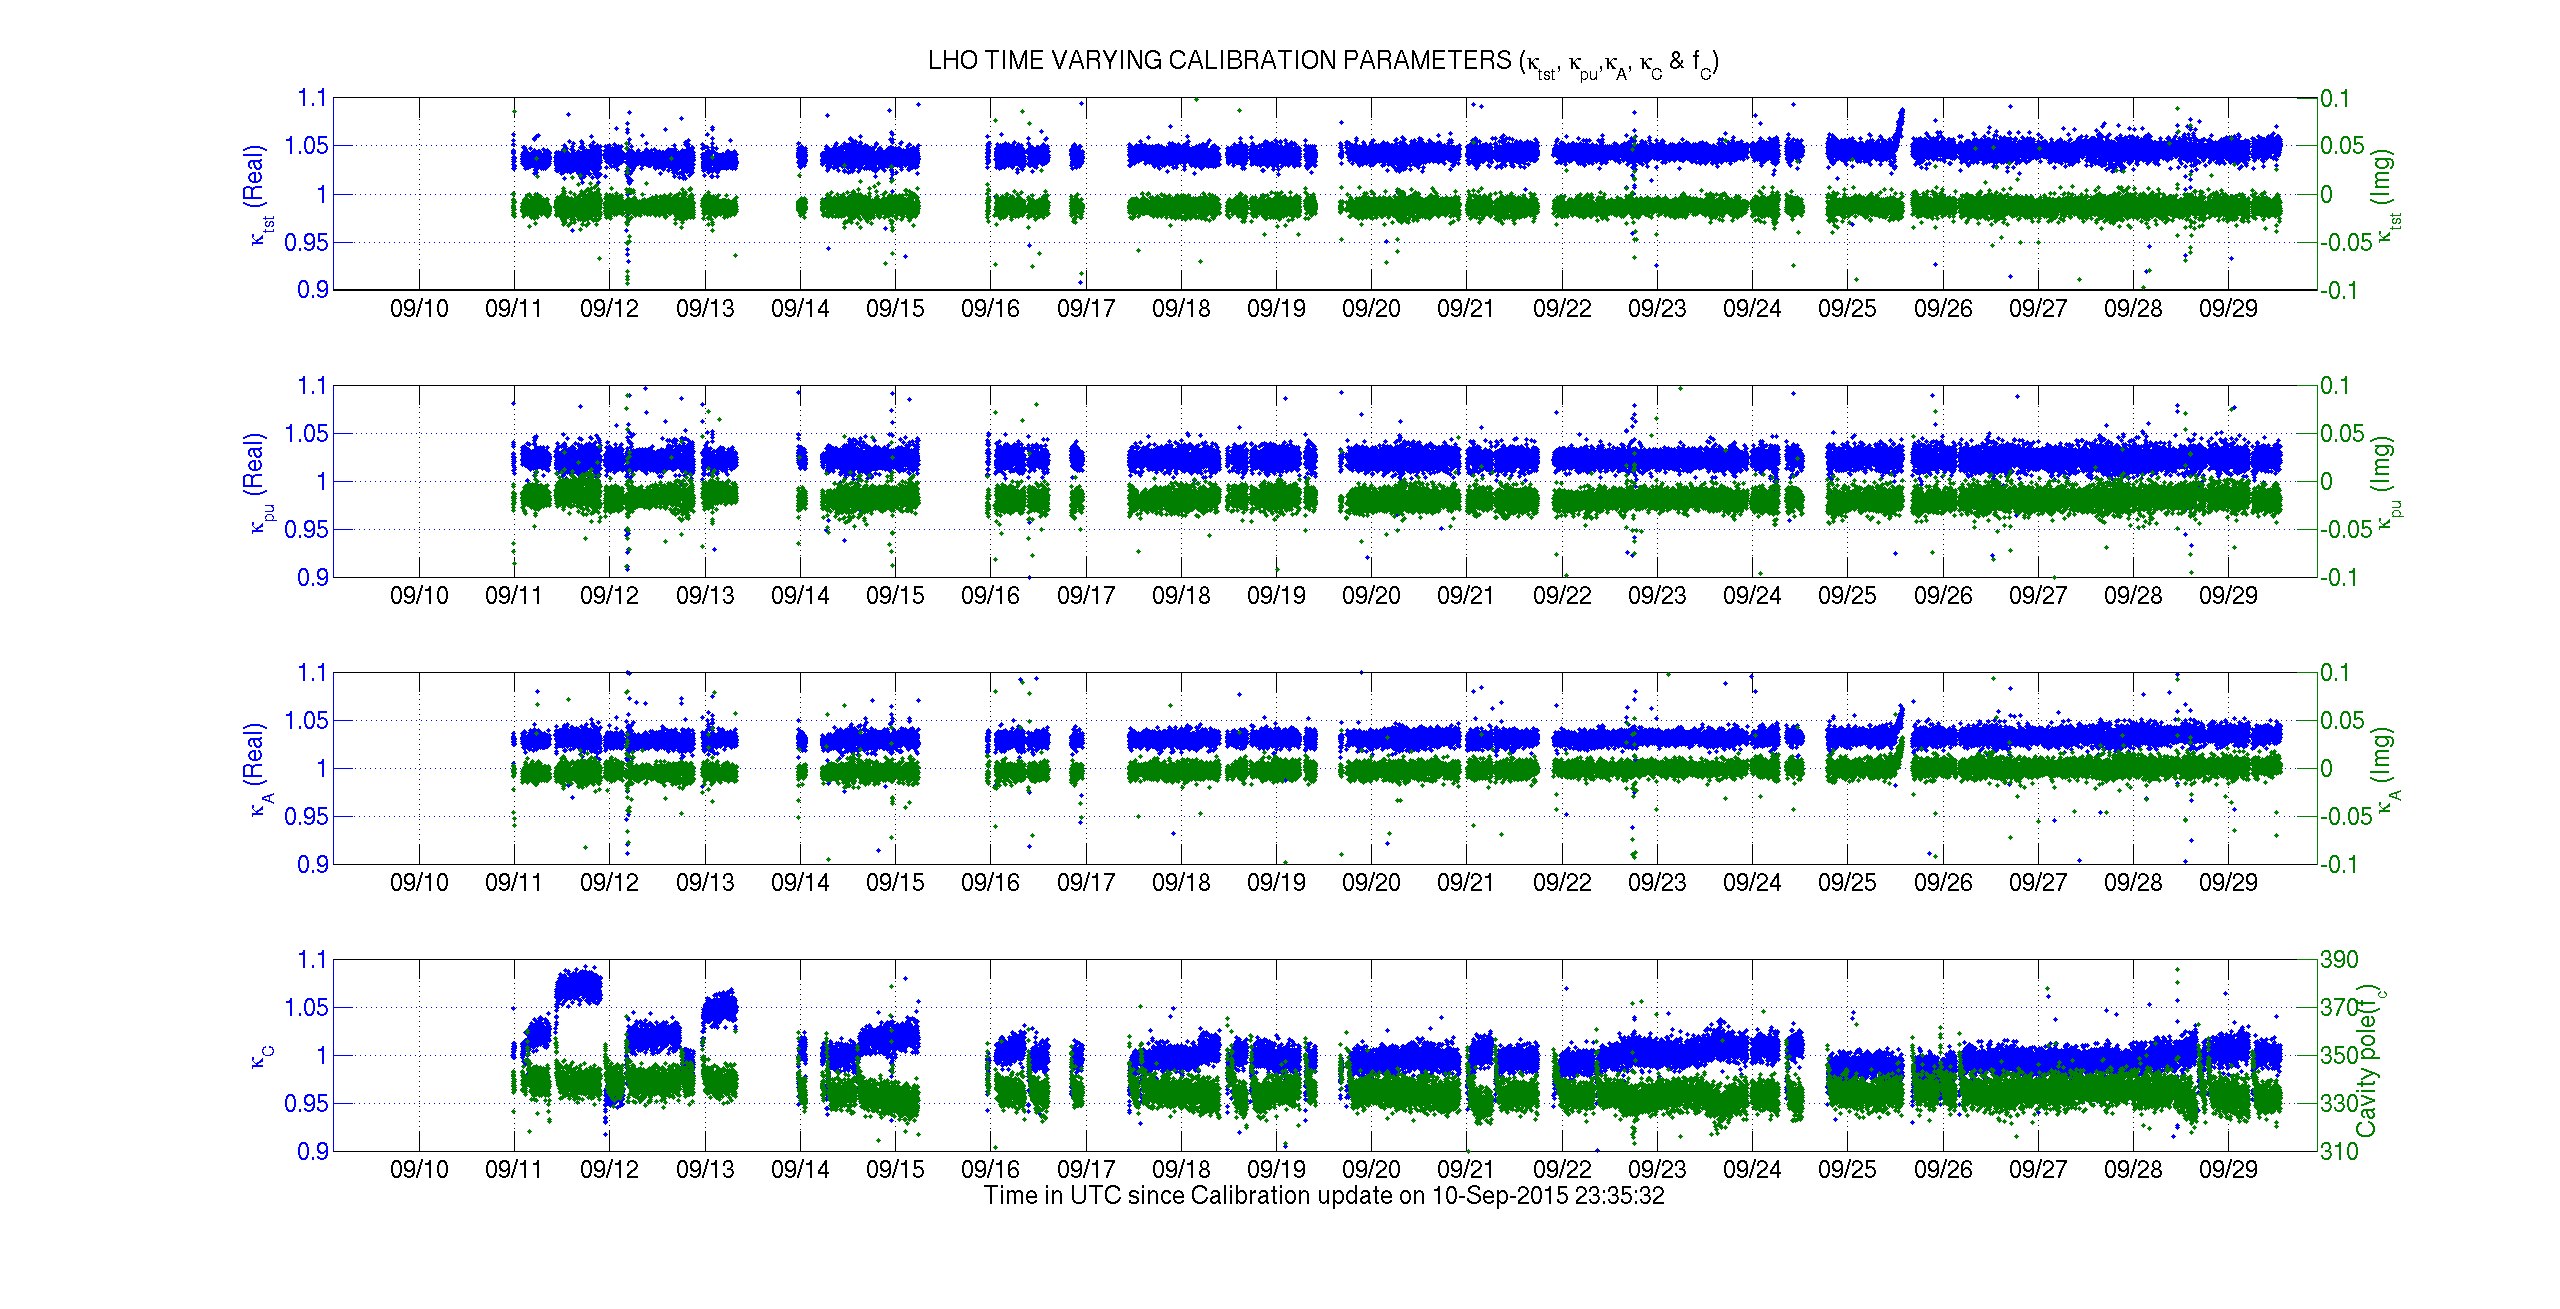
1we used kappa values at the measurement times from previous calculations (see LHO alog 21827); for the ~30 Hz lines these values shouldn't be too much different from the ones calculated using EP1-9 from the updated O1 model.
H1 DARM model for O1 and comparison script were committed to calibration SVN (r1550)
CalSVN/Runs/O1/H1/Scripts/DARMOLGTFs/H1DARMOLGTFmodel_O1.m
CalSVN/Runs/O1/H1/Scripts/DARMOLGTFs/CompareDARMOLGTFs_O1.m
All of the parameter files in the same directory were modified to include time advances noted in this report.
Actuation function analysis scripts were committed to (r1550) (PCAL parameter files, that were copied from ER8 directory have been also committed into the same directory):
CalSVN/Runs/O1/H1/Scripts/PCAL/analyze_pcal_20150928.m
CalSVN/Runs/O1/H1/Scripts/PCAL/cmpActCoeffs_viaPcal_O1.m
Actuation function analysis plots were committed to (r1551)
CalSVN/Runs/O1/H1/Results/PCAL/2015-09-28_cmpActCoeffs_PCAL_*.pdf
Model comparison plots were committed to
CalSVN/Runs/O1/H1/Results/DARMOLGTFs/2015-09-28_H1DARM_ER8O1_cmp_*.pdf


I caused a lockloss by moving TMSX too quickly while doing this test.
I also spent some time earlier in the day (durring maintence recovery) to do some excitations on TMS and the End station ISIs to investigate the noise that seems to come from TMSX. An alog with results will be coming soon.