Sheila, Evan
Since we have recently gotten rid of the excess oscillator AM noise in DARM, we wanted to look at the residual of the DCPD sum and null. This test has been done at LLO several times (most recently here).
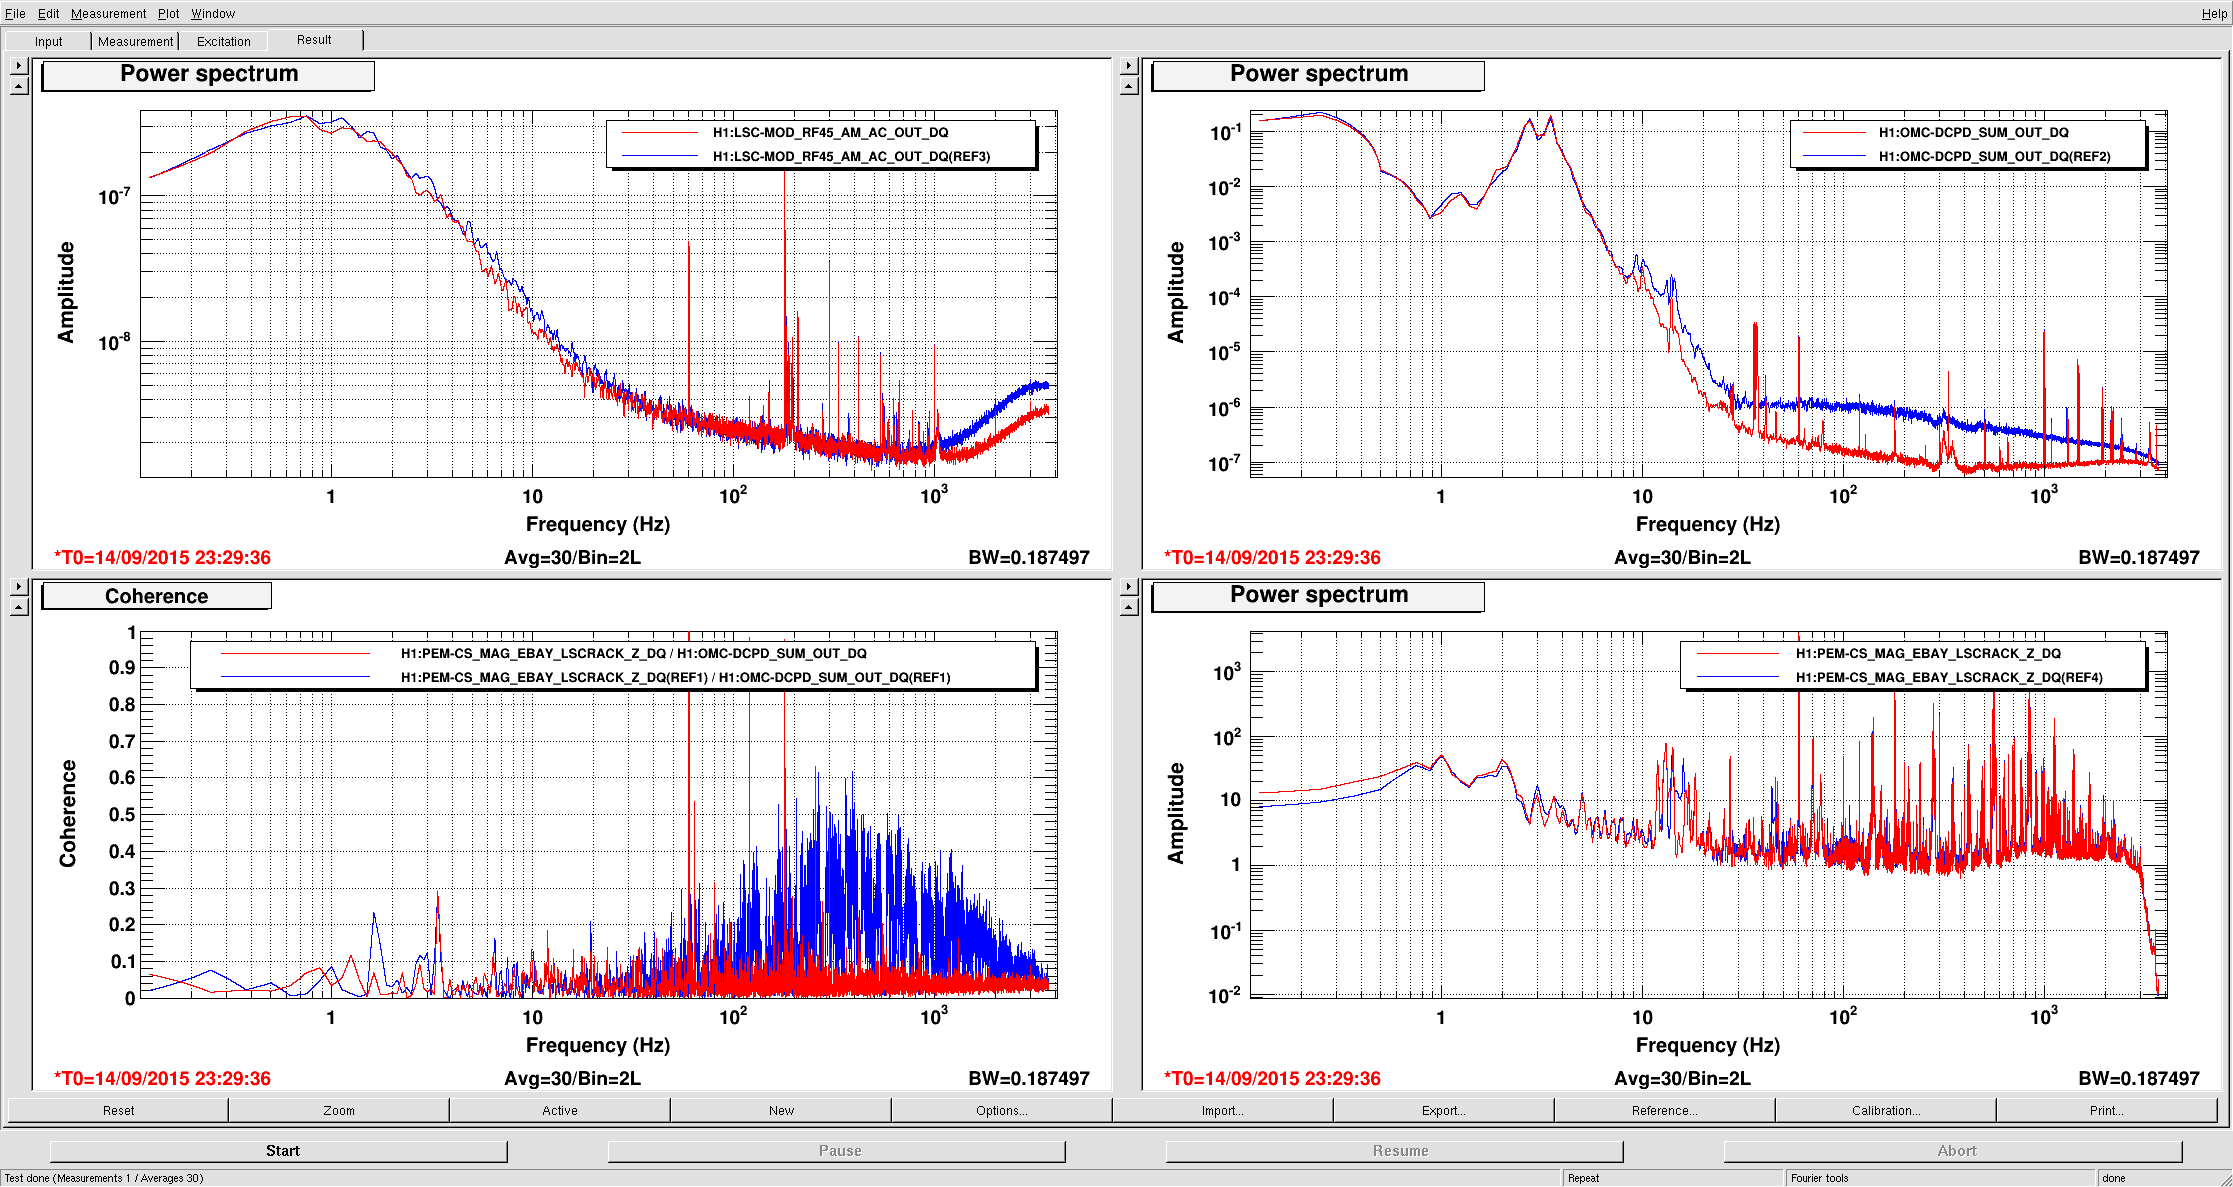
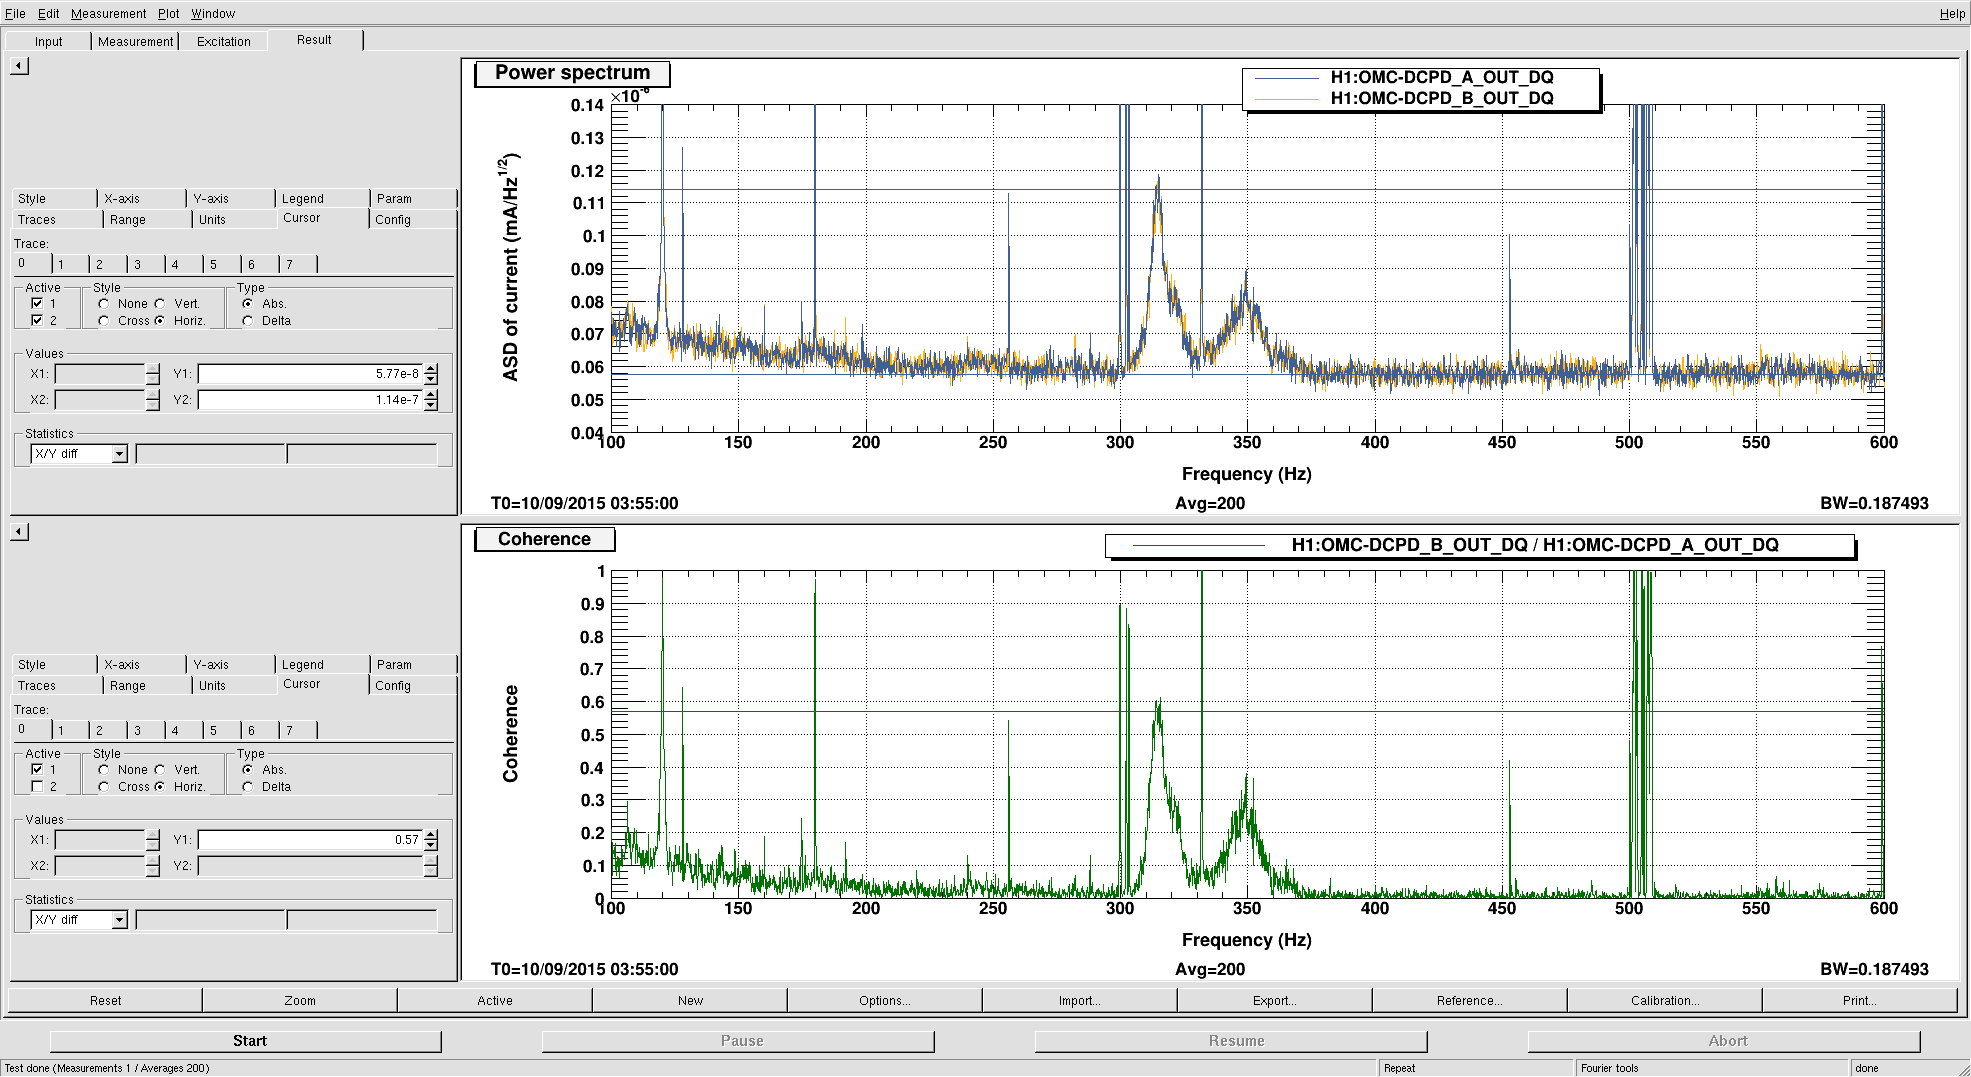
Unlike the previous look at this noise, we decided to follow the LLO technique and notch the DARM loop by 20 dB between 100 Hz and 700 Hz. In order to do this, we had to reduce the DARM ugf to 20 Hz or so. Unfortunately, this rang up the quad bounce modes. Rather than recommission the bounce mode damping, we just turned it off and collected the sum/null data in a few 20-minute intervals, and then applied damping inbetween using the usual DARM loop shape. In total we collected a little over an hour's worth of data, with the usual 20 mA of current on the sum. The attached plot shows the data processed into 1-second ASDs.
The dc current of the sum was 20.0 mA, meaning we expect a shot noise of 8.00×10⁻⁸ mA/Hz1/2. On the other hand, the ratio of sum/shot and null/shot (attached) indicates that we might be too low by a few percent. It's a bit complicated, since it relies on a combination of the frontend calibration (Koji's preamp and whitening compensation filters) and a post facto calibration (Kiwamu's combination of the IOP inversion, the supernyquist preamp poles, the AA response, and the mystery 10.7 kHz pole).

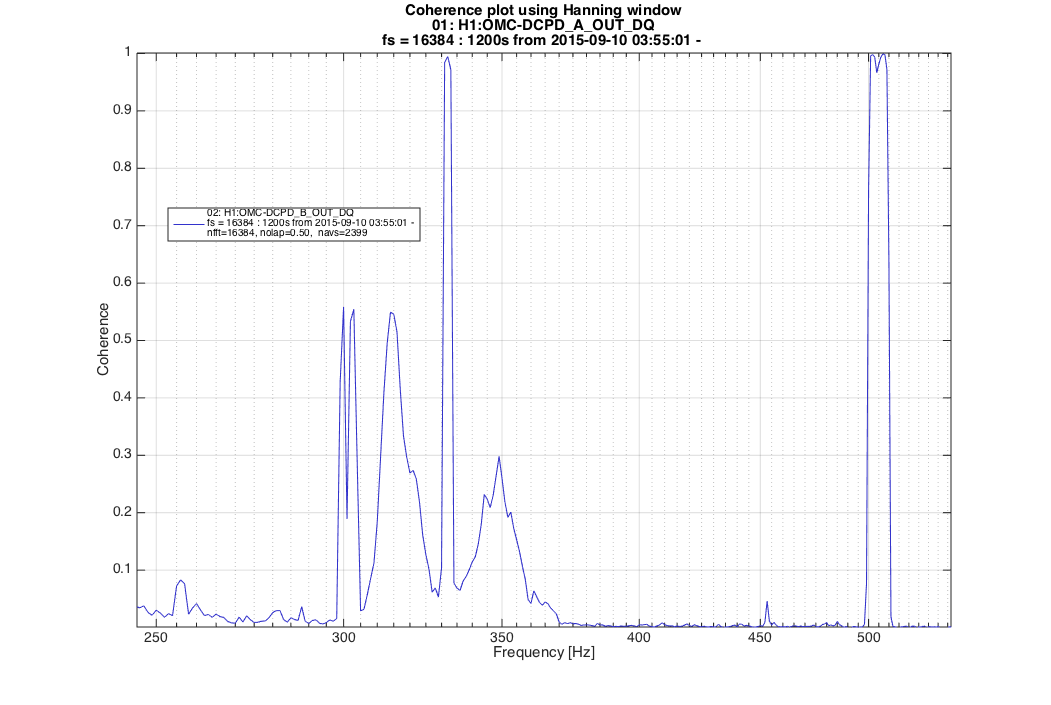
Why is the coherence between A and B not one at the jitter peaks (300-400 Hz)?
You band-stopped the DARM loop in that region, so there should be no correlation induced by DARM. So I would expect that the coherence is one, if the peaks are coming through intensity noise on the laser beam (possibly converted from jitter by the OMC). Instead there is low coherence, which seems to me not compatible with the shot noise level: this is visible in Evan's plot too, since the uncorrelated noise is closer to the value of the sum than to the null...
Two hypothesis
- this is reidual jitter that couples on the diodes due to some non homogeneity
- I'm missing something in this analysis
I think the numbers hang together. Let SAA = S00 + SA'A' and SBB = S00 + SB'B', where S00 is the PSD of the correlated component of the noise between the DCPDs, and SA'A' and SB'B' are the PSDs of the uncorrelated noises on each PD.
From last night's data, at 315 Hz we have SAA = SBB = (1.14×10⁻⁷ mA/Hz1/2)2. Looking nearby at 540 Hz, where the DCPDs seem to be shot-noise dominated, we can estimate SA'A' = SB'B' = (0.577×10⁻⁷ mA/Hz1/2)2, so therefore S00 = (0.983×10⁻⁷ mA/Hz1/2)2.
For the CSD, we have SAB = S00.
Therefore, the coherence we expect is γ2 = |SAB|2/(SAA×SBB) = 0.55.
Or in terms of the PSDs of sum (S++) and null (S−−), the coherence should be γ2 = [(S++ − S−−)/(S++ + S−−)]2.
I agree with your computations. But why is your projection of the residual showing the peaks? it should line up with the shot noise if that's what is limiting the coherence.