jim.warner@LIGO.ORG - posted 20:09, Wednesday 23 September 2015 (21875)
Mid Shift
Everything quiet on site. Environment quiet. The current lock is approaching 40-some odd hours.
Everything quiet on site. Environment quiet. The current lock is approaching 40-some odd hours.
The code the brings up GraceDB alerts on our overviews was somewhat outdated, as it used an FAR of 1e-6 hz (~once every 12 days) instead of 3.8e-7 (~1 a month). Dave wrote up instructions for me to do the update when one of the IFOs dropped out of lock. Just before he left, the opportunity arose, so I updated the code. It's running now.
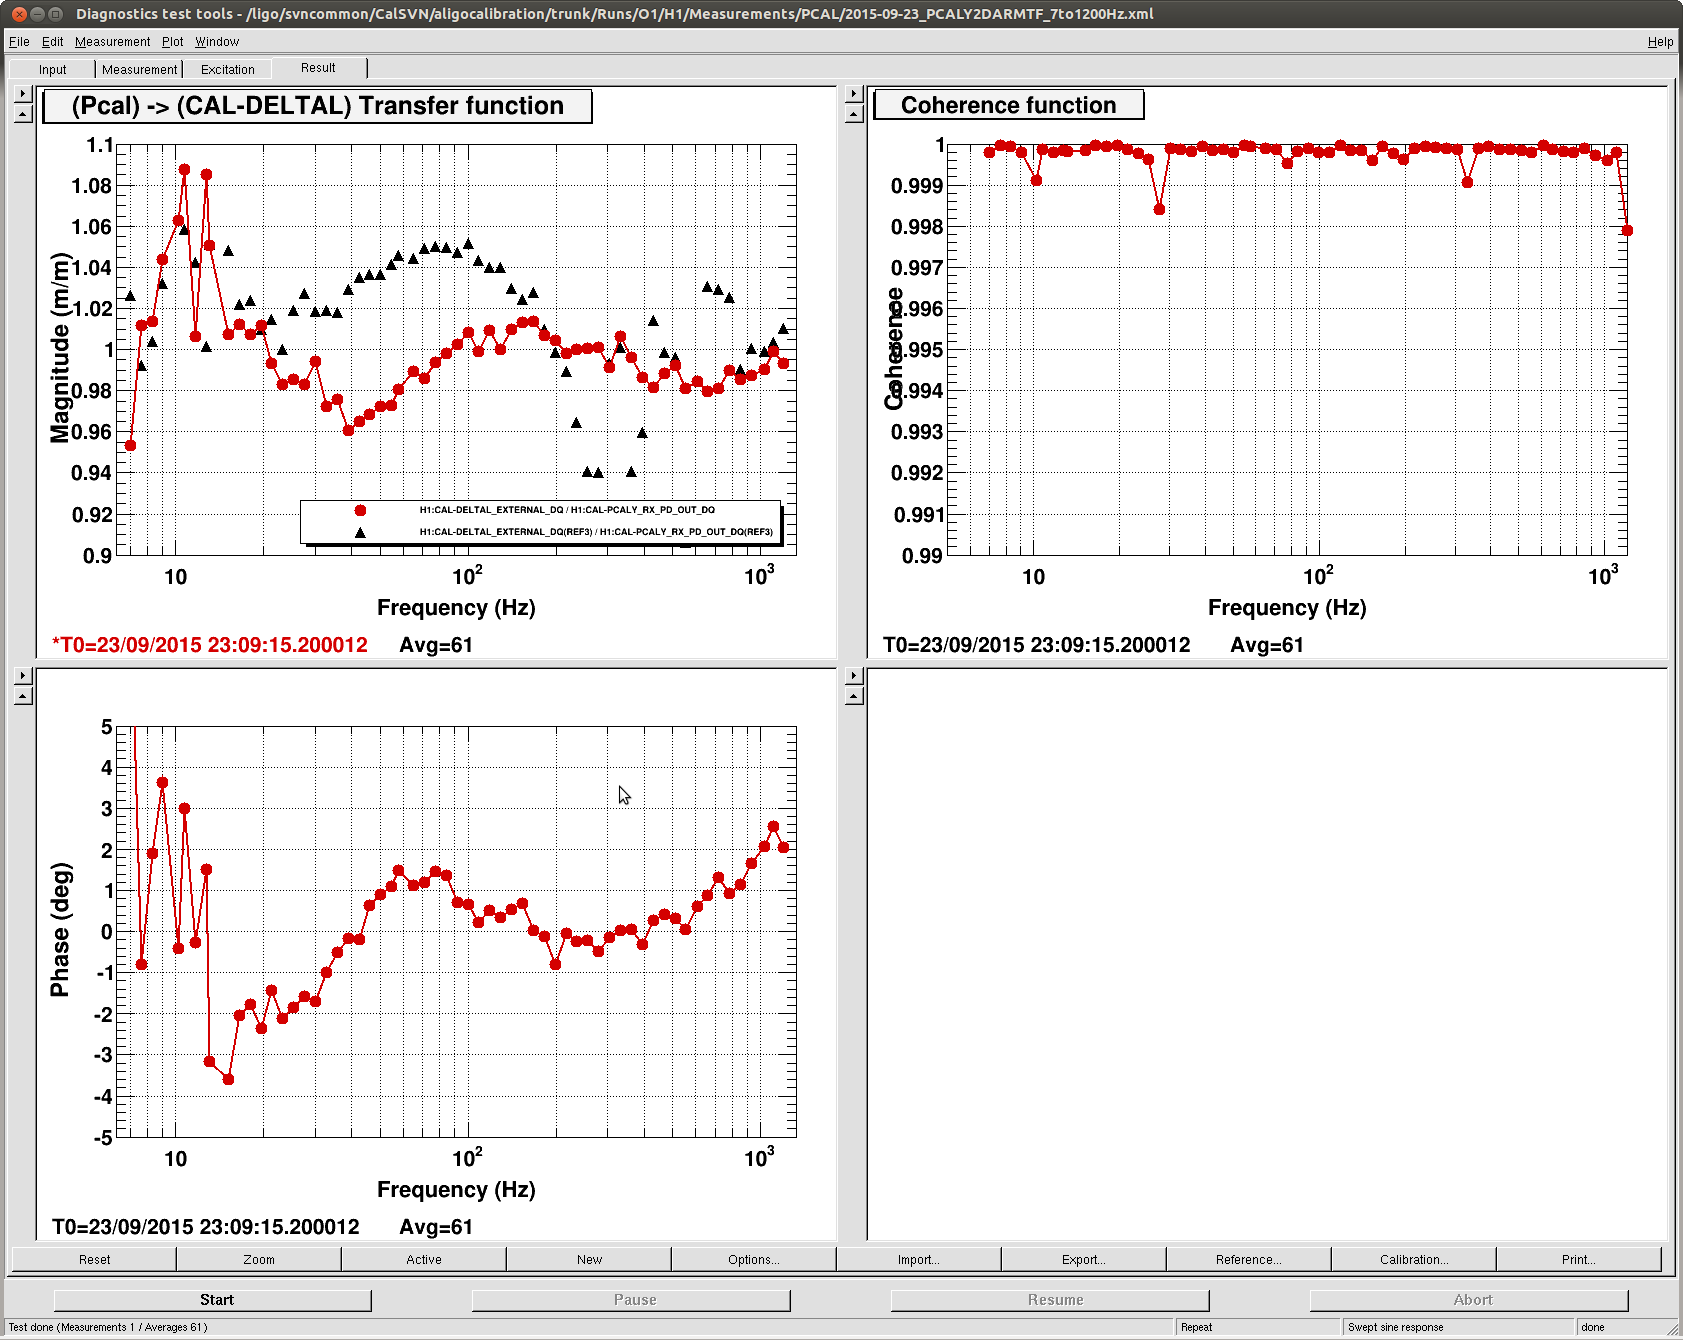
J. Kissel

I've taken new DARM open loop gain and PCALY to DARM transfer functions to validate the current calibration. During the PCALY to DARM transfer function, I take the transfer function from PCALY's RX PD (calibrated into [m] of ETMY motion) and the CAL-CS front-end's DELTAL_EXTERNAL (calibrated into DARM [m], which -- since we're driving ETMY -- is identical to [m] of ETMY motion). These two different methods agree to within 4% and 3 [deg] over the 15 [Hz] to 1.2 [kHz] band. The calibration discrepancy expands to a whopping 9% and 4 [deg] if we look a frequencies between 5 and 15 [Hz] ;-).

I think we're in great shape, boys and girls.

Details
--------------
- CAL-CS does not correct for any slow time depedence (optical gain, test mass actuation strength, etc), so any agreement you see with the current interferometer is agreement with the reference model taken on Sep 10th 2015 (LHO aLOG 21385).

- In the previous measurement, Kiwamu had to fudge the phase by ~90 [us] to get the phase to agree. Now that we've updated the cycle delay between sensing and actuation to 7 [16 kHz clock cycles] to better approximate the high-frequency frequency response of AA, AI, and the OMC DCPD signal chain, we no longer have to fudge the phase -- AND the phase between the two metrics agree. NICE.

- I've made sure to turn OFF calibration lines *during both of these measurements, but there should be ample data just before and just after with calibration lines ON, such that we can compare our results against theirs to help refine our estimates of systematic error.

- The measurements live in
/ligo/svncommon/CalSVN/aligocalibration/trunk/Runs/O1/H1/Measurements/DARMOLGTFs/2015-09-23_H1_DARM_OLGTF_7to1200Hz.xml
/ligo/svncommon/CalSVN/aligocalibration/trunk/Runs/O1/H1/Measurements/PCAL$/2015-09-23_PCALY2DARMTF_7to1200Hz.xml
and have been committed to the CalSVN. We'll process these results shortly, and perform a similar analysis as Darkhan has done in yesterday's aLOG 21827.
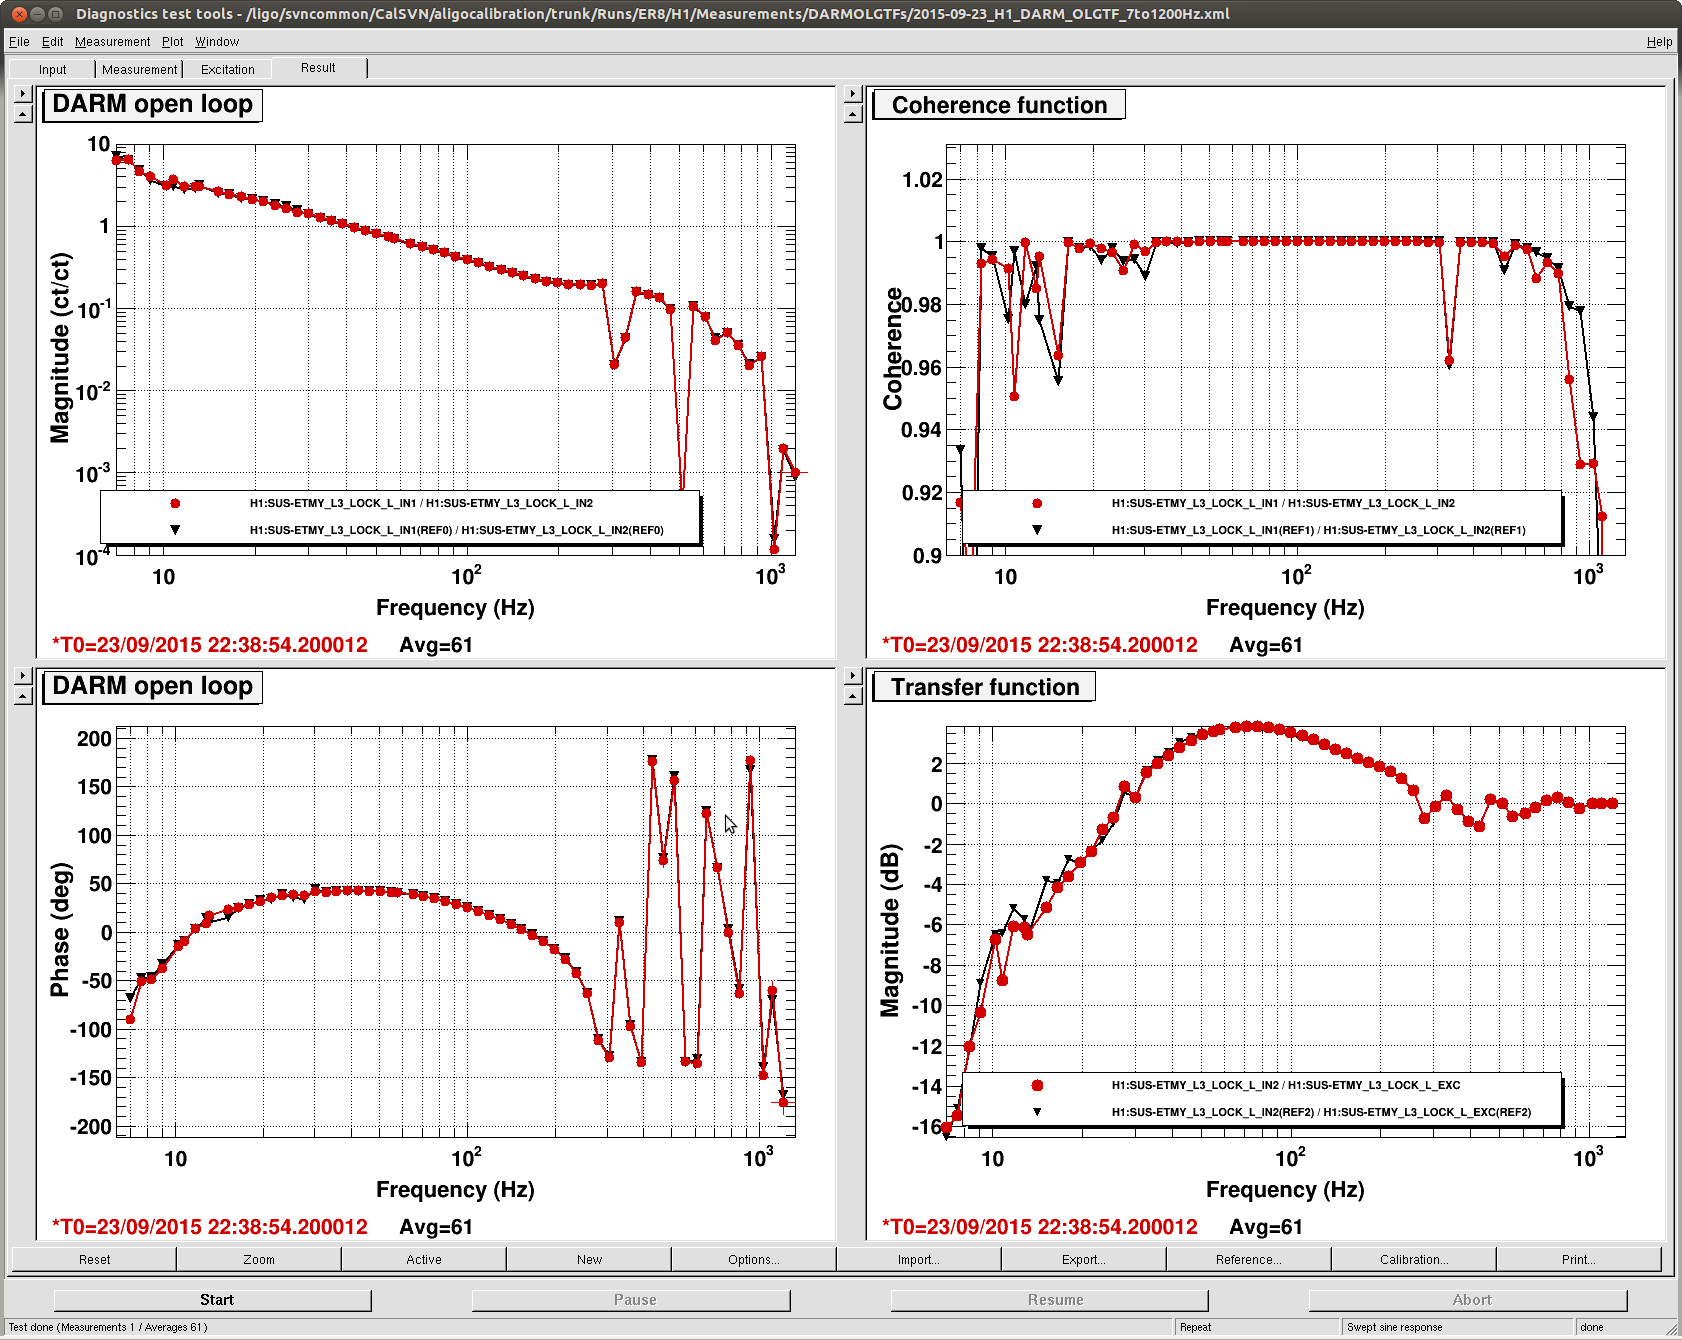
The parameter file for this measurement was committed to calibration SVN:
CalSVN/aligocalibration/trunk/Runs/O1/H1/Scripts/DARMOLGTFs/H1DARMparams_1127083151.m
Attached plots show components of DARM loop TF and their residuals vs. DARM model for O1.
It looks better. Very nice.
By the way, I wanted to measure the open loop without the MICH or SRCL feedforward because I wanted to demonstrate that the unknown shape in the residual in magnitude is not due to these feedforward corrections. Though this may be a crazy thought. Anyway, it would be great if you can run an open-loop measurement without the feedforwards at some point, just once.
TITLE: Sept 23 Day shift, 15:00-23:00UTC, 08:00-16:00PT
STATE Of H1: Commissioning, Range = 78Mpc, lock is 30+ hours long!
SUPPORT: MikeL, Sheila, Chris Biwer, JeffK
SHIFT SUMMARY: In Observe most of shift, currently in Commissioning. Commissioning includes injections, filter change, and others in progress.
INCOMING OPERATOR: Jim
ACTIVITY LOG:
15:58:43UTC - DMT glitch, Range = -1, no effect on IFO
16:00:43UTC - DMT glitch, Range = -1, no effect on IFO
20:16:27UTC - Commissioning, injections
20:35UTC - Chris Biwer injections end
20:45:20UTC - cleared the ETMX timing error bit that was stuck
20:45:40UTC - GRB notice
20:47:16UTC - put IFO back into Observe
22:21:53UTC - Commissioning
22:22:06UTC - engaged Sheila's DHARD_Y filter
22:22:16UTC - put IFO back into Observe
22:22:18UTC - with the new filter, SDF kicked the IFO out of Observe
Currently JeffK has the IFO.
J. Kissel, C. Biwer

As the title says. Nothing exciting, just updating a status checking bit in the ONC. SAFE and OBSERVE.snaps have been updated and committed to the userapps repo.
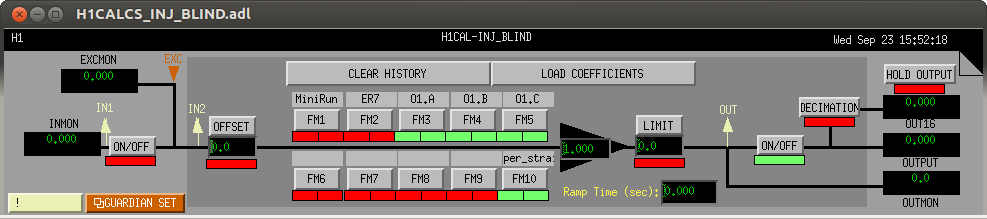
J. Kissel

Similar to what was done for the HARDWARE injection filter (LHO aLOG 21703), I've added a minus sign to the identical BLIND injection filter bank. This facilitates testing this bank, which we hope to do soon.

I've also turned on FM5 where this minus sign lives, and accepted the the new configuration in the SDF system (both in OBSERVE and SAFE.snaps), and committed the new filter bank to the repo.
Test of Sheila's filter. GRB standown time is complete. Returning to Commissioning while LLO is down due to temperature transient in their LVEA.
The FOM for H1 Range was modified at some point in the last 24 hours, and at Vern and Mike's request I backed out the 20Mpc horizontal line, and saved the template with a y-axis range of 0-101Mpc.
The FOM for H1 Range is posted on the website and so considered to be under version control, though not in SVN, and changes need to be approved before implemented.
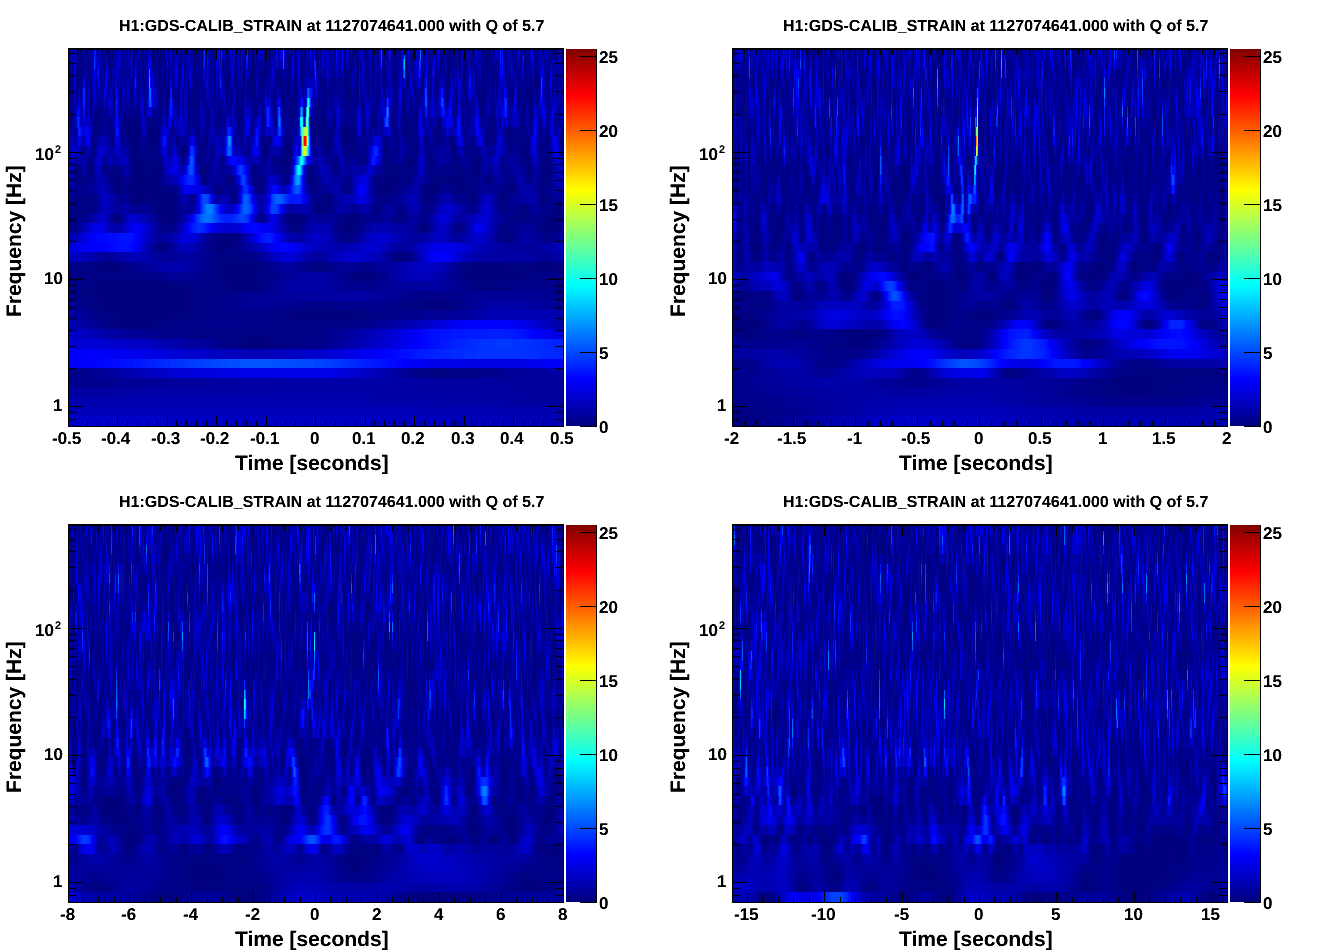
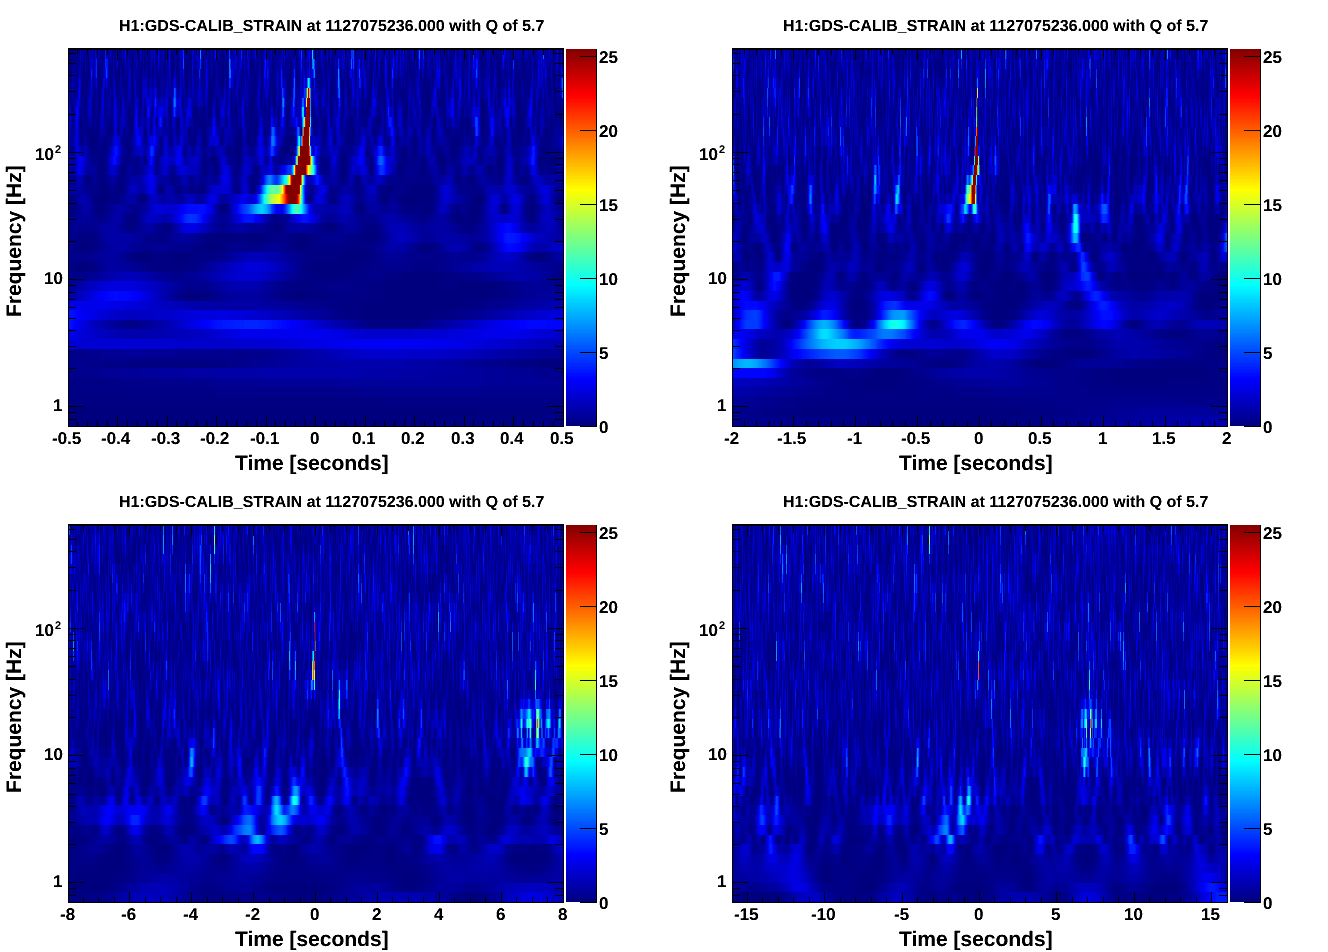
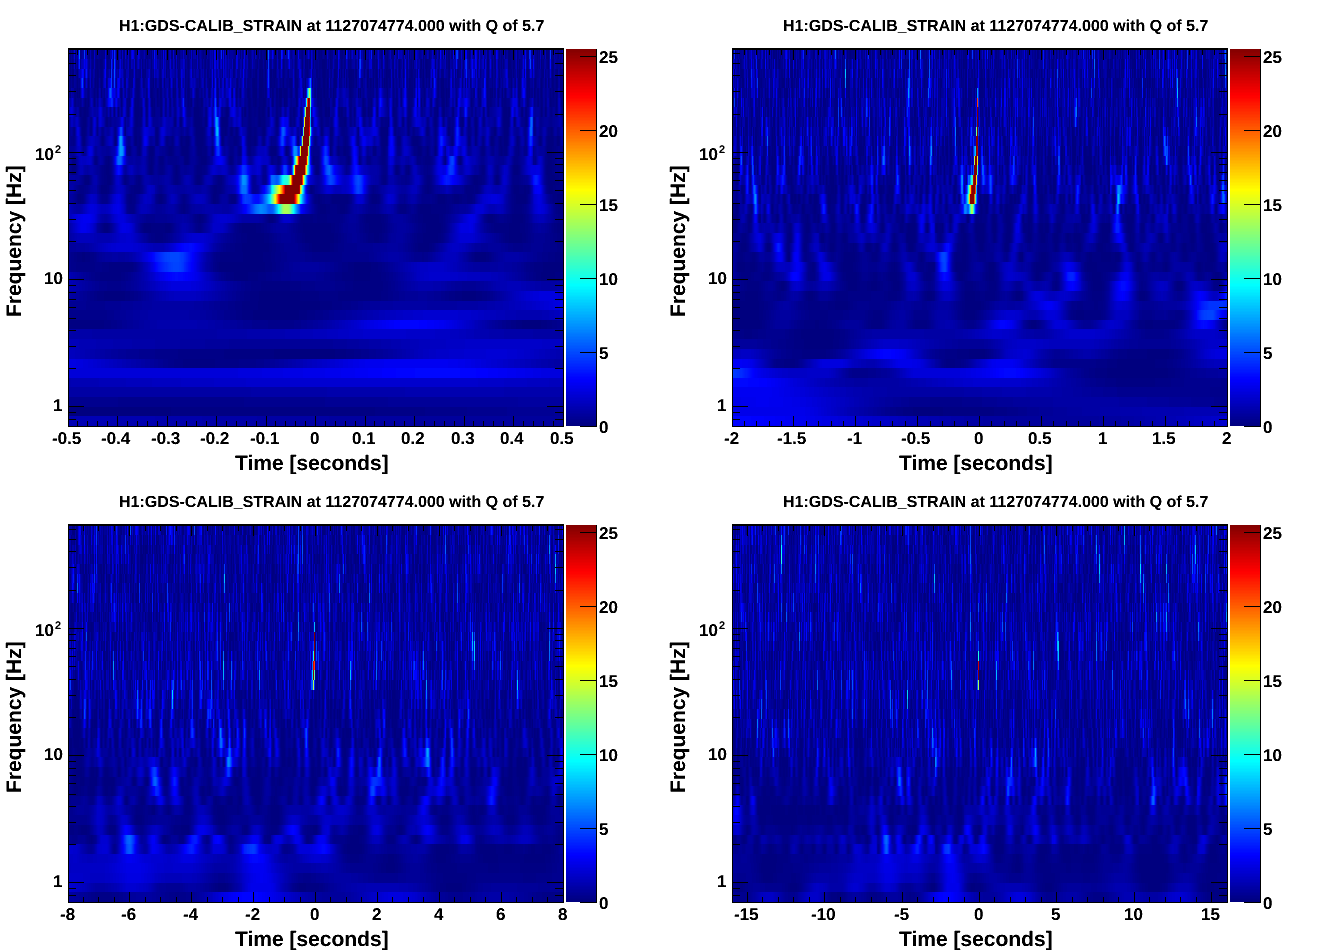
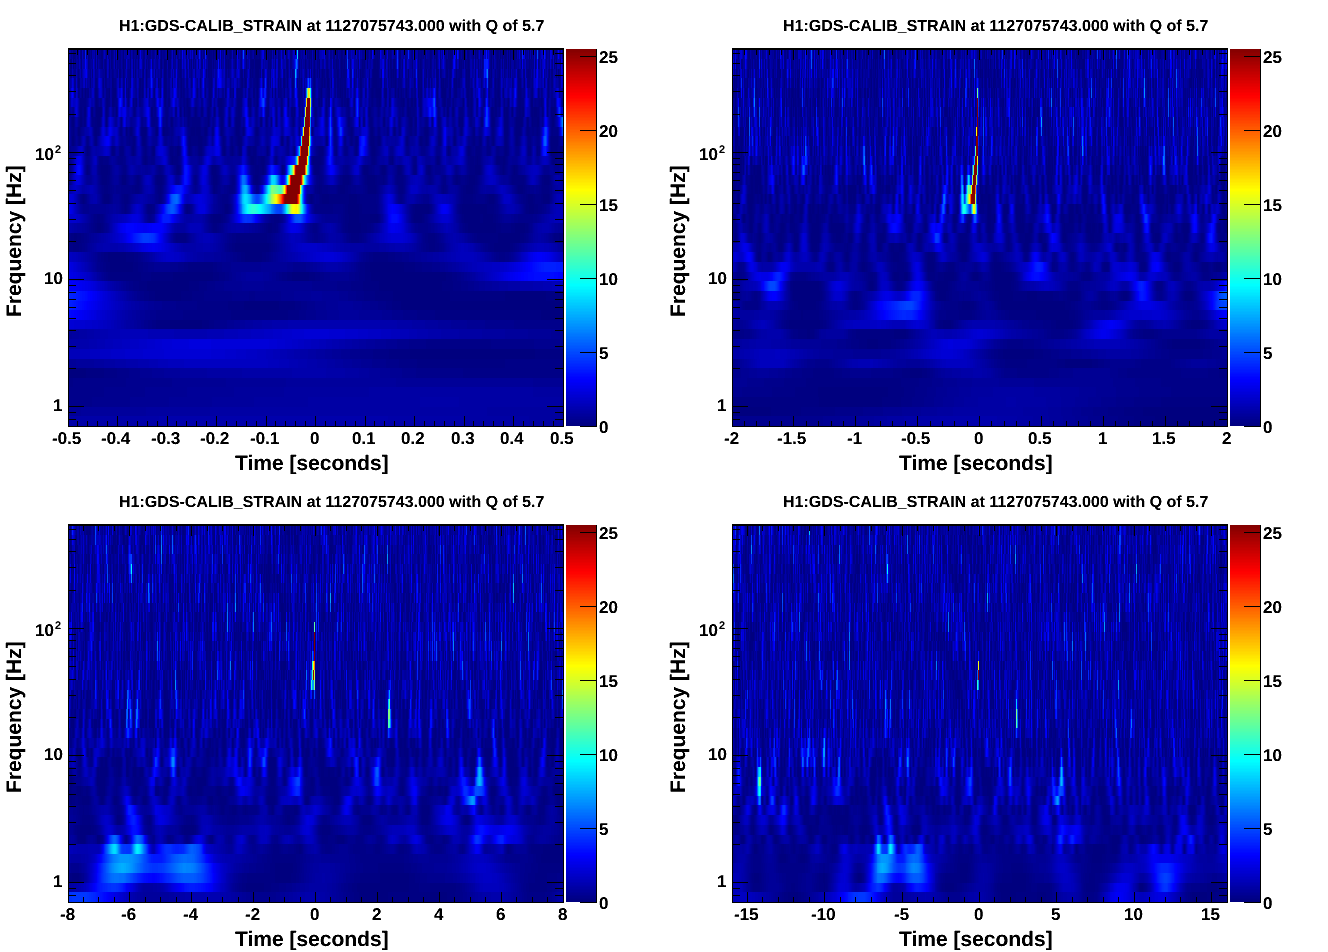
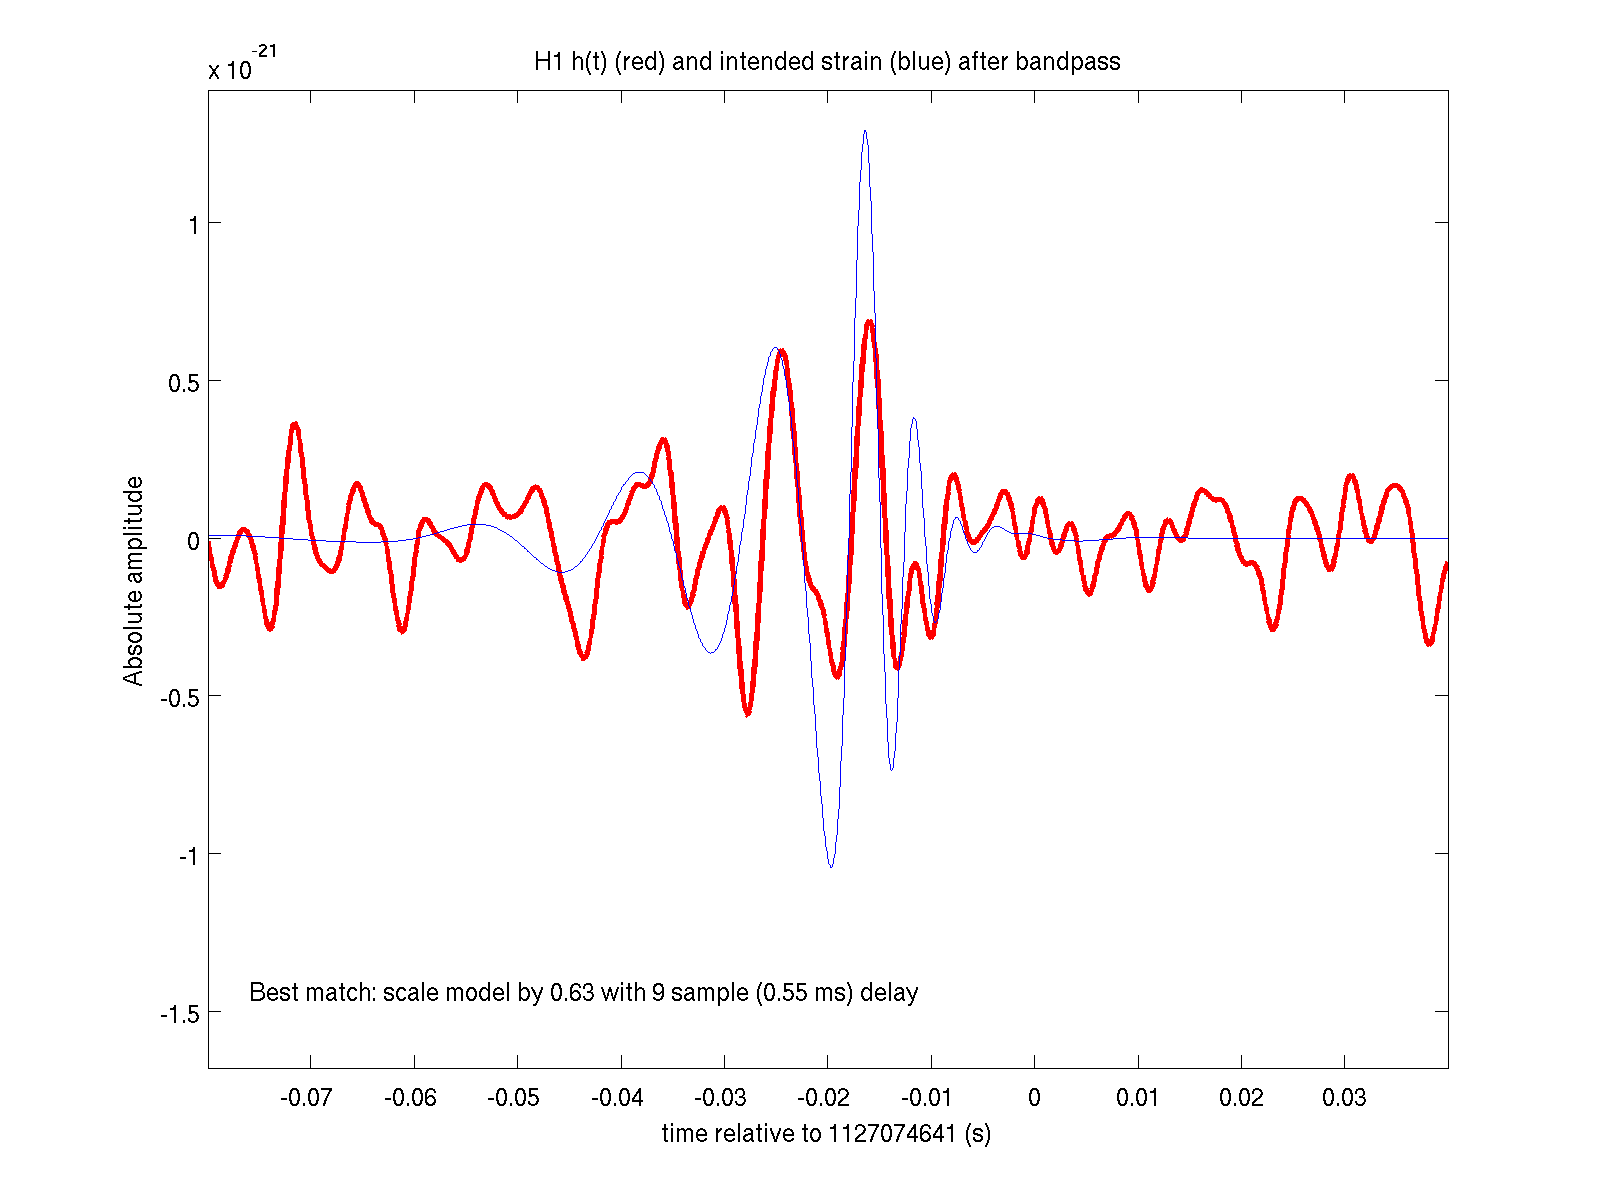
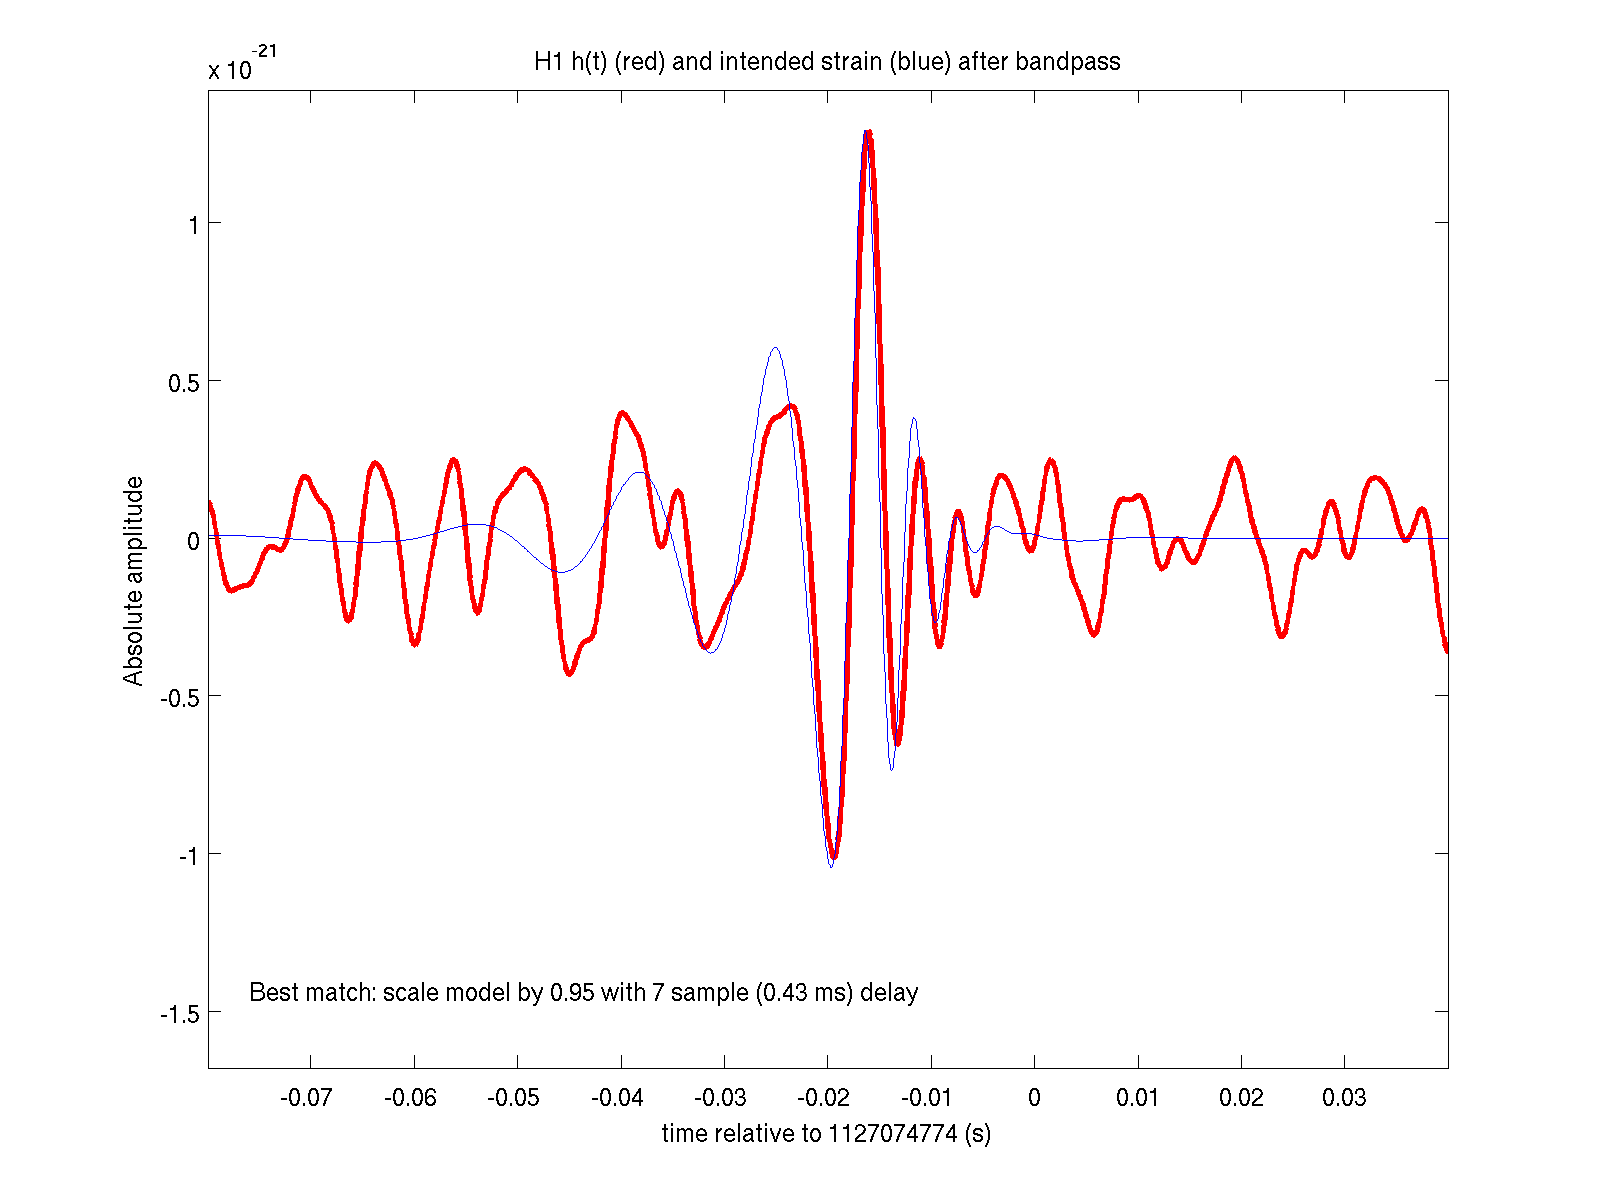
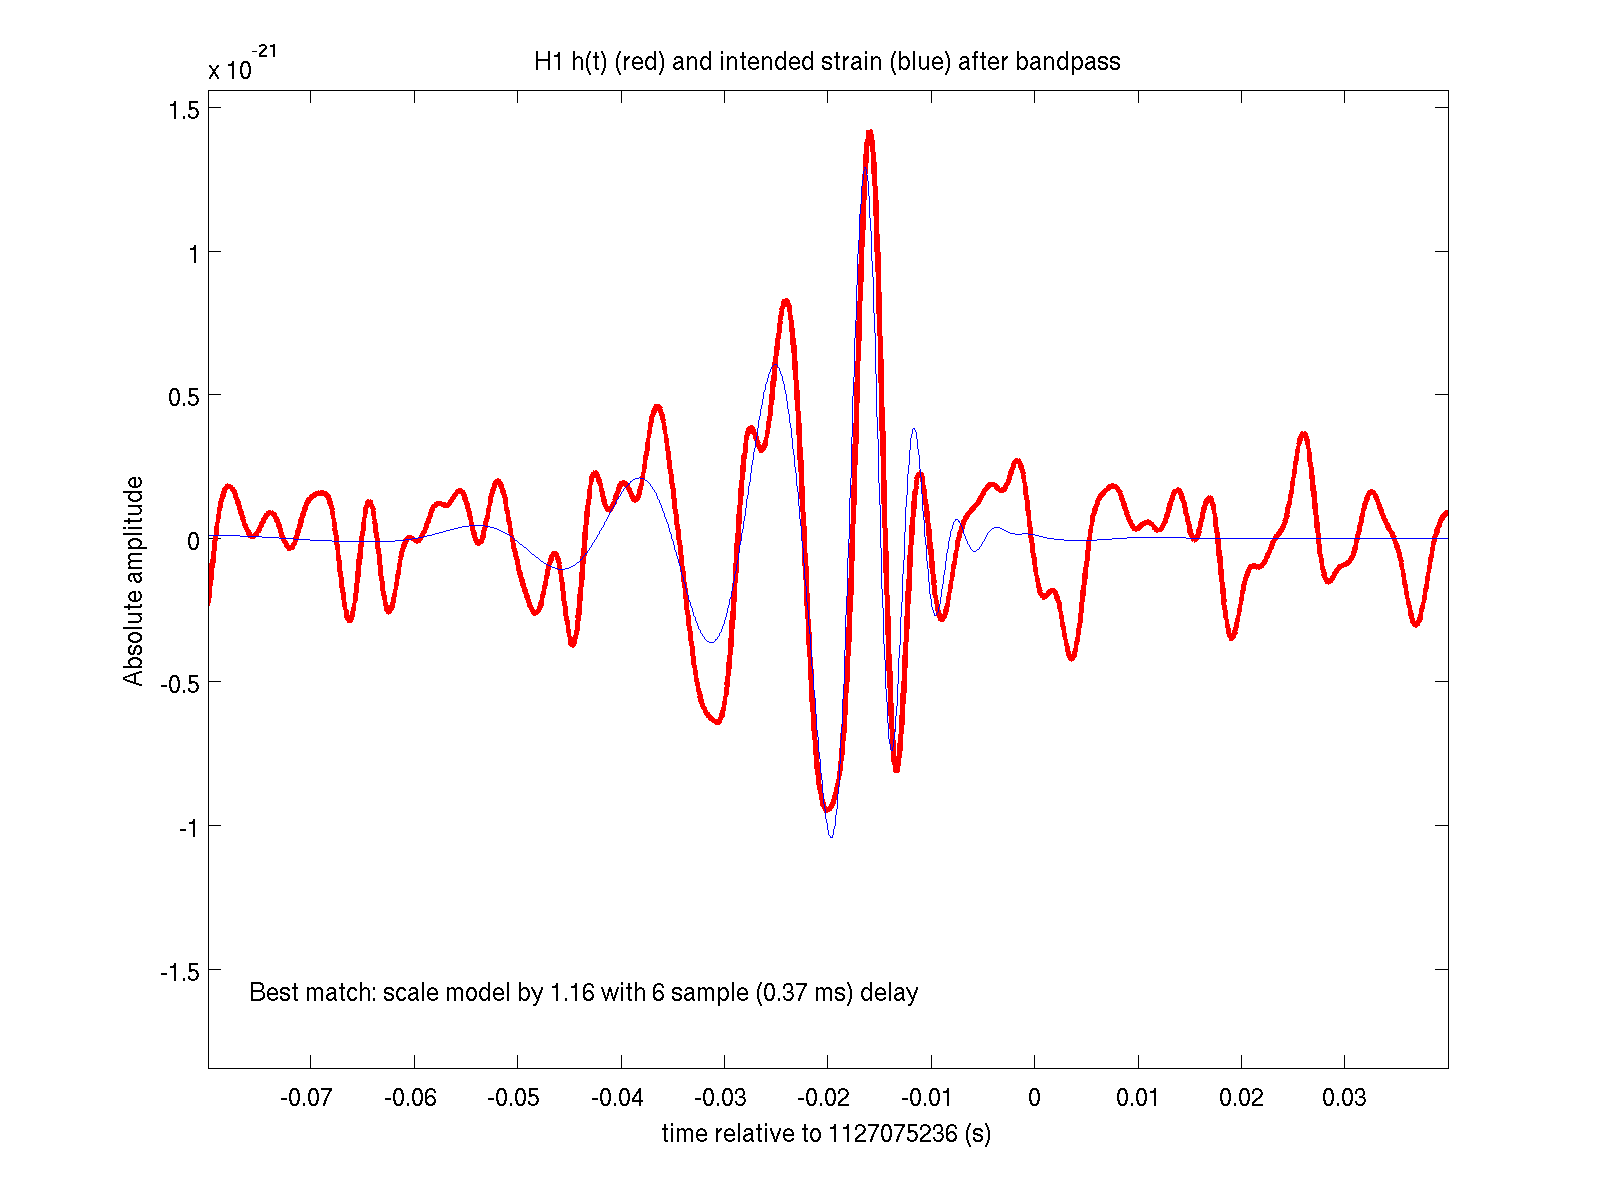
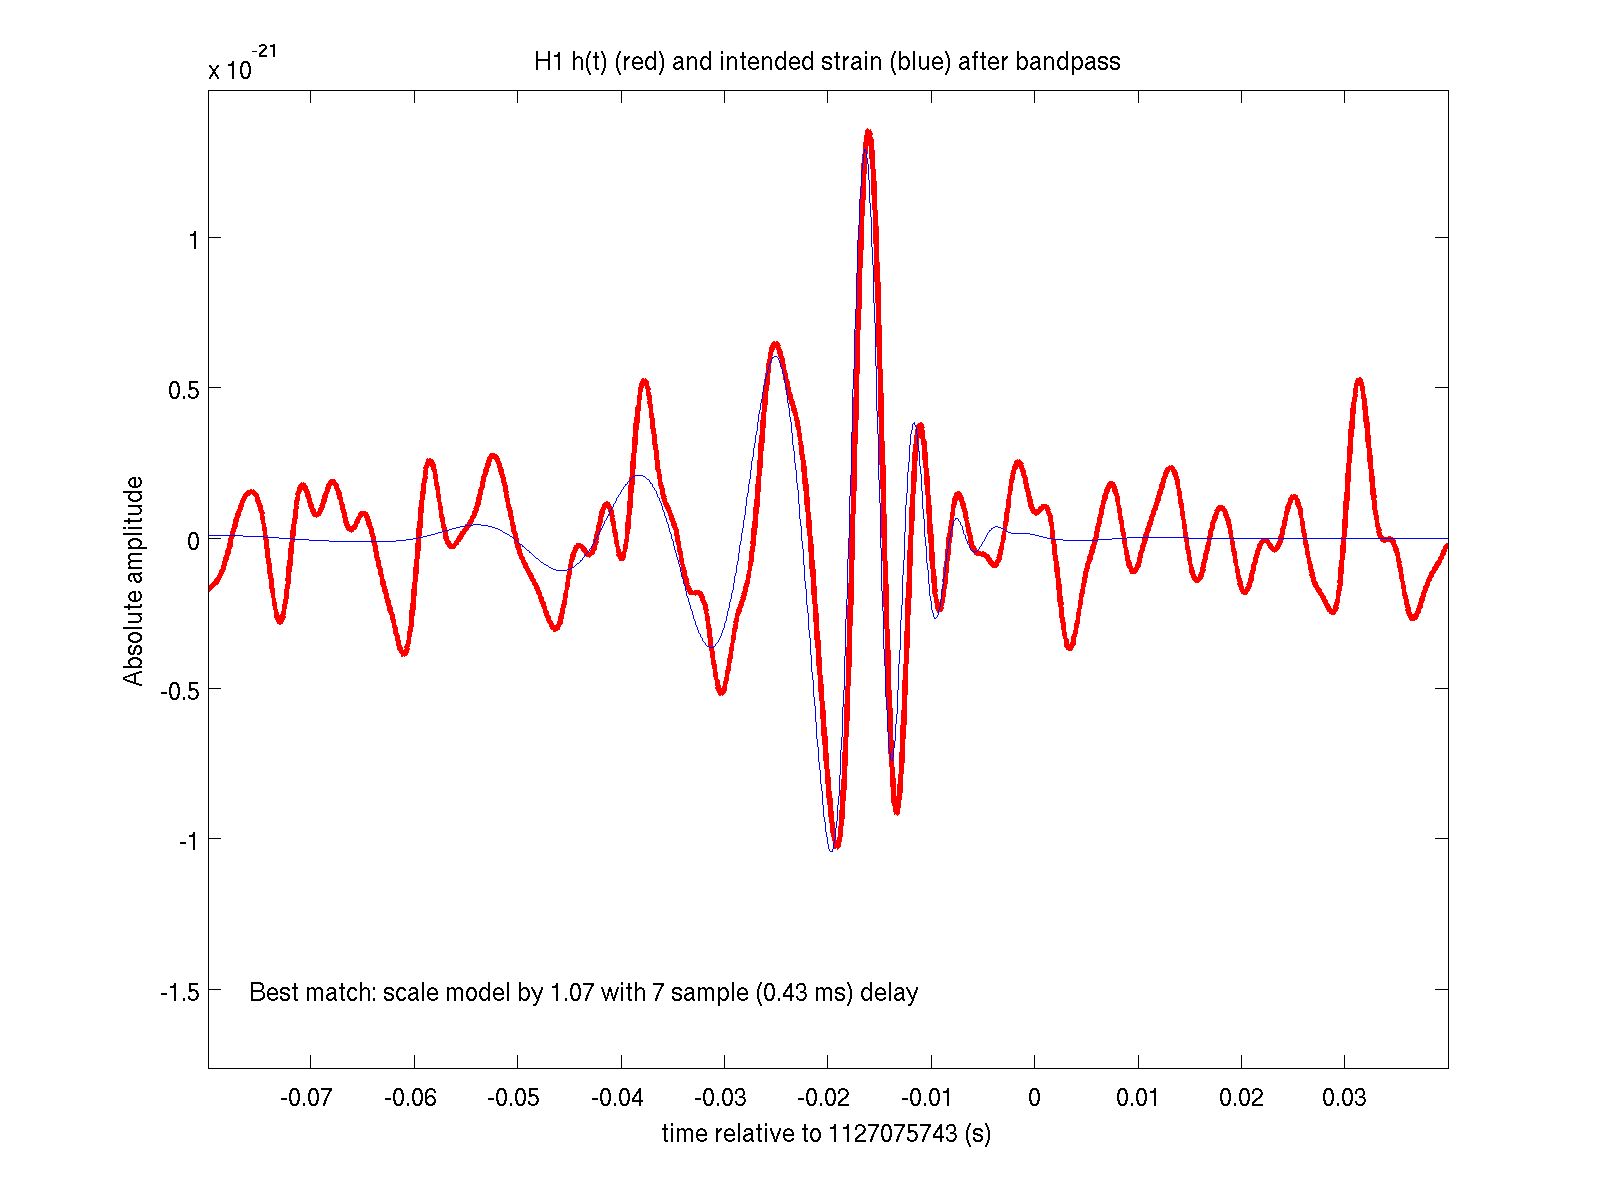
L1 went out of lock. At H1 we turned off the intent bit and injected some hardware injections.

The hardware injections were the same waveform that was injected on September 21. For more information about those injections see aLog entry 21759

For information about the waveform see aLog entry 21774.

tinj was not used to do the injections.The commands to do the injections were:
awgstream H1:CAL-INJ_TRANSIENT_EXC 16384 H1-HWINJ_CBC-1126257410-12.txt 0.5 -d -d >> log2.txt
awgstream H1:CAL-INJ_TRANSIENT_EXC 16384 H1-HWINJ_CBC-1126257410-12.txt 1.0 -d -d >> log2.txt
ezcawrite H1:CAL-INJ_TINJ_TYPE 1
awgstream H1:CAL-INJ_TRANSIENT_EXC 16384 H1-HWINJ_CBC-1126257410-12.txt 1.0 -d -d >> log2.txt
awgstream H1:CAL-INJ_TRANSIENT_EXC 16384 H1-HWINJ_CBC-1126257410-12.txt 1.0 -d -d >> log2.txt

To my chagrin the first two injections were labeled as burst injections.

Taken from the awgstream log the corresponding times are approximates of the injection time:

1127074640.002463000
1127074773.002417000
1127075235.002141000
1127075742.002100000

The expected SNR of the injection is ~18 without any scaling factor.

I've attached omegascans of the injections. There is no sign of the "pre-glitch" that was seen on September 21.
Attached stdout of command line.
Neat! looks good.
Hi Chris,
It looks like there is a 1s offset between the times you report and the rough coalescence time of the signal. Do you know if it is exactly 1s difference?
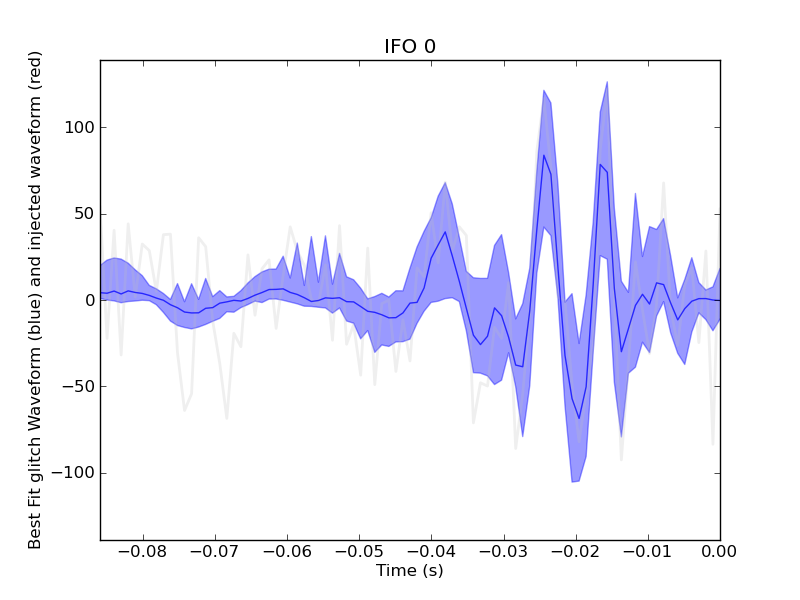
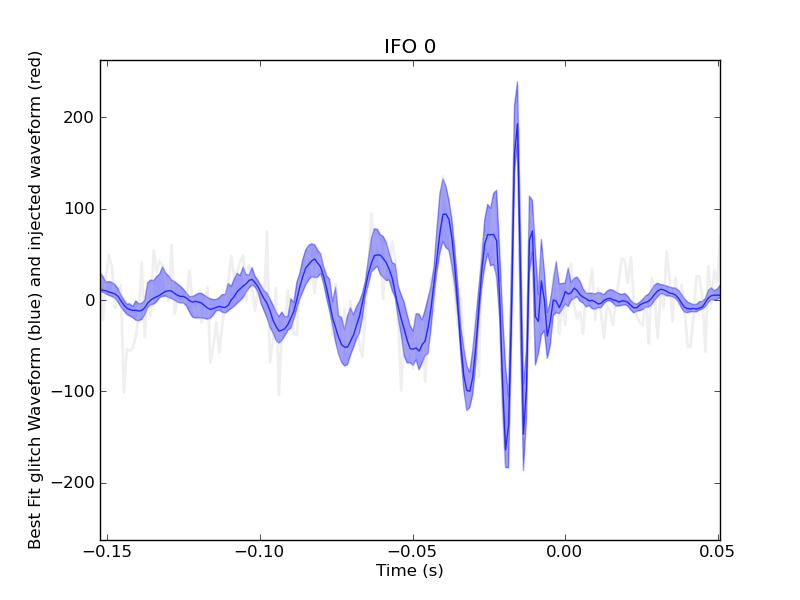
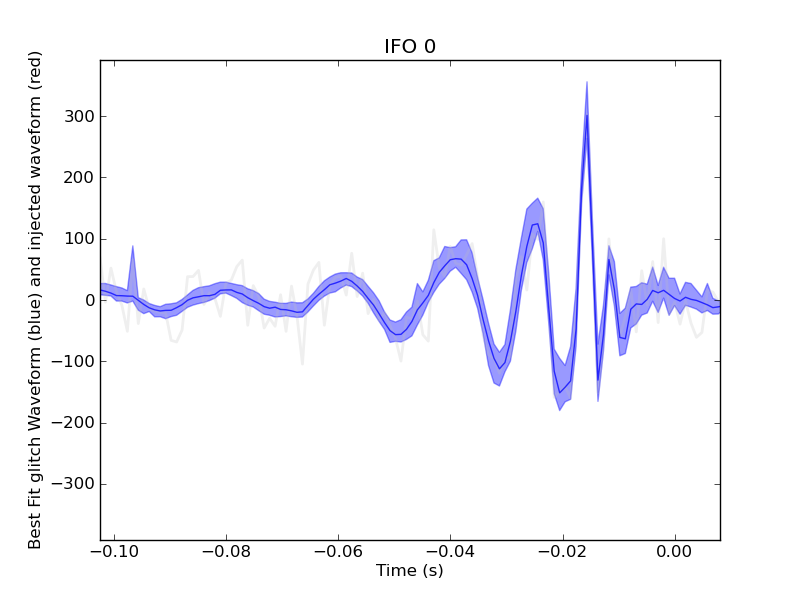
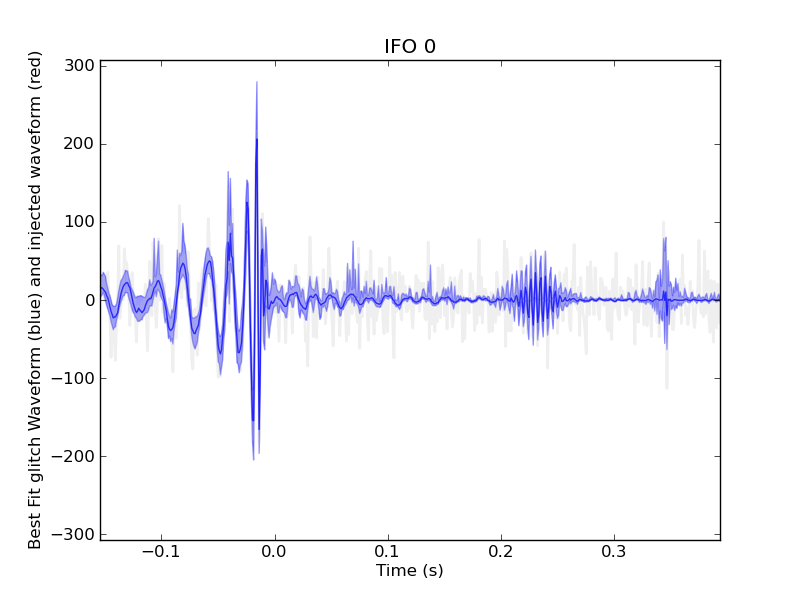
Yes, as John said, all of the end times of the waveforms are just about 1 second later that what's in the original post.

I ran a version my simple bandpass-filtered overlay script for these waveforms.  Filtering both the model (strain waveform injected into the system) and the data from 70-260 Hz, it overlays them, and also does a crude (non-optimal) matched filter to estimate the relative amplitude and time offset.  The four plots attached are for the four injected signals; note that the first one was injected with a scale factor of 0.5 and is not "reconstructed" by my code very accurately.  The others actually look rather good, with reasonably consistent amplitudes and time delays.  Note that the sign of the signal came out correctly!
I ran the daily BBH search with the injected template on the last two injections (1127075235 and 1127075742).

For 1127075235; the recovered end time was 1127075235.986, the SNR was 20.42, the chi-squared was 29.17, and the newSNR was 19.19.
For 1127075242; the recovered end time was 1127075242.986, the SNR was 20.04, the chi-squared was 35.07, and the newSNR was 19.19.
KW sees all the injections with the +1 sec delay, some of them in multiple frequency bands.
From
  /gds-h1/dmt/triggers/H-KW_RHOFT/H-KW_RHOFT-11270/H-KW_RHOFT-1127074624-64.trg
  /gds-h1/dmt/triggers/H-KW_RHOFT/H-KW_RHOFT-11270/H-KW_RHOFT-1127074752-64.trg
  /gds-h1/dmt/triggers/H-KW_RHOFT/H-KW_RHOFT-11270/H-KW_RHOFT-1127075200-64.trg
  /gds-h1/dmt/triggers/H-KW_RHOFT/H-KW_RHOFT-11270/H-KW_RHOFT-1127075712-64.trg

    tcent         fcent significance channel
1127074640.979948   146    26.34      H1_GDS-CALIB_STRAIN_32_2048
1127074774.015977   119    41.17      H1_GDS-CALIB_STRAIN_8_128
1127074773.978134   165   104.42      H1_GDS-CALIB_STRAIN_32_2048
1127075235.980545   199   136.82      H1_GDS-CALIB_STRAIN_32_2048
1127075743.018279   102    74.87      H1_GDS-CALIB_STRAIN_8_128
1127075742.982020   162   113.65      H1_GDS-CALIB_STRAIN_32_2048

Omicron also sees them with the same delay
From :
  /home/reed.essick/Omicron/test/triggers/H-11270/H1:GDS-CALIB_STRAIN/H1-GDS_CALIB_STRAIN_Omicron-1127074621-30.xml
  /home/reed.essick/Omicron/test/triggers/H-11270/H1:GDS-CALIB_STRAIN/H1-GDS_CALIB_STRAIN_Omicron-1127074771-30.xml
  /home/reed.essick/Omicron/test/triggers/H-11270/H1:GDS-CALIB_STRAIN/H1-GDS_CALIB_STRAIN_Omicron-1127075221-30.xml
  /home/reed.essick/Omicron/test/triggers/H-11270/H1:GDS-CALIB_STRAIN/H1-GDS_CALIB_STRAIN_Omicron-1127075731-30.xml

    peak time          fcent      snr
1127074640.977539062  88.77163  6.3716
1127074773.983397960 648.78342 11.41002  <- surprisingly high fcent, could be due to clustering
1127075235.981445074 181.39816 13.09279
1127075742.983397960 181.39816 12.39437

LIB single-IFO jobs also found all the events. Post-proc pages can be found here:

 https://ldas-jobs.ligo.caltech.edu/~reed.essick/O1/2015_09_23-HWINJ/1127074640.98-0/H1L1/H1/posplots.html
 https://ldas-jobs.ligo.caltech.edu/~reed.essick/O1/2015_09_23-HWINJ/1127074773.98-1/H1L1/H1/posplots.html
 https://ldas-jobs.ligo.caltech.edu/~reed.essick/O1/2015_09_23-HWINJ/1127075235.98-2/H1L1/H1/posplots.html
 https://ldas-jobs.ligo.caltech.edu/~reed.essick/O1/2015_09_23-HWINJ/1127075742.98-3/H1L1/H1/posplots.html

all runs appear to have reasonable posteriors.
Here is how Omicron detects these injections:

https://ldas-jobs.ligo-wa.caltech.edu/~frobinet/scans/hd/1127074641/
https://ldas-jobs.ligo-wa.caltech.edu/~frobinet/scans/hd/1127074774/
https://ldas-jobs.ligo-wa.caltech.edu/~frobinet/scans/hd/1127075236/
https://ldas-jobs.ligo-wa.caltech.edu/~frobinet/scans/hd/1127075743/

Here are the parameters measured by Omicron (loudest tile):
1127074640: t=1127074640.981, f=119.9 Hz, SNR=6.7
1127074773: t=1127074773.981, f=135.3 Hz, SNR=11.8
1127075235: t=1127075235.981, f=114.9 Hz, SNR=12.8
1127075742: t=1127075742.981, f=135.3 Hz, SNR=12.4
The BayesWave single IFO (glitch only) analysis recovers these injections with the following SNRs:
4640: 8.65535
4773: 19.2185
5253: 20.5258
5742: 20.1666
The results are posted here:
https://ldas-jobs.ligo.caltech.edu/~meg.millhouse/O1/CBC_hwinj/
General Question: Does this knock us out of Observation Mode? Could I have reset this this morning?
IFO was in Commissioniing.
No, the DIAG_MAIN guardian node is NOT under the OBSERVATION READY check. It can be changed/reset/etc. without affecting OBSERVATION MODE.
I think Cheryl was talking about the diag reset button on the GDS overview screen for the front end, not the DIAG_MAIN guardian.
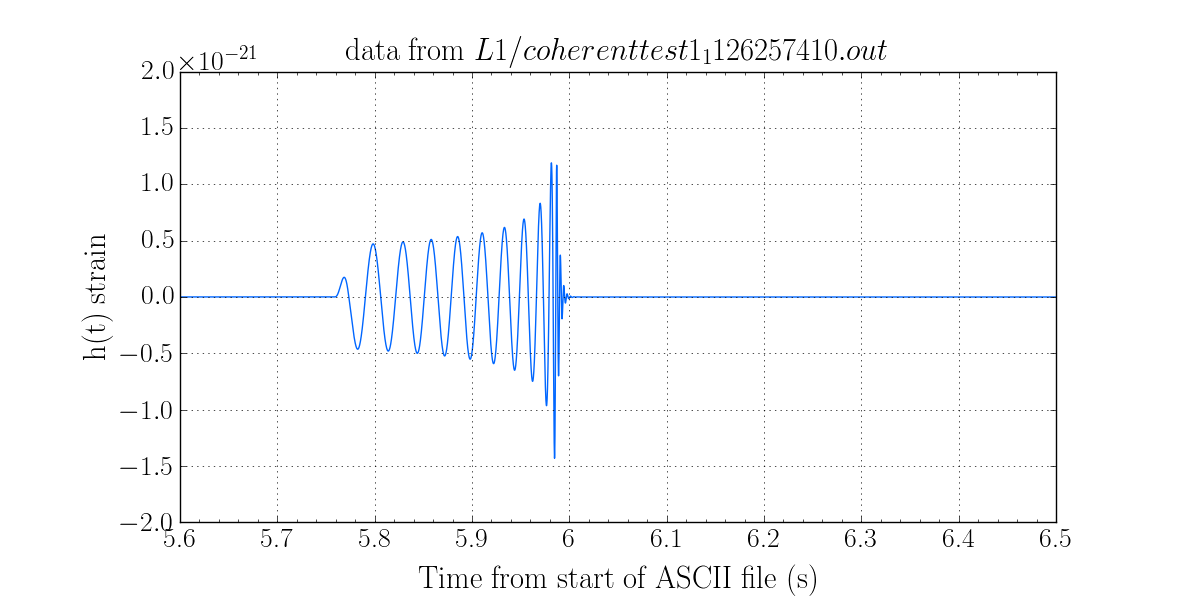
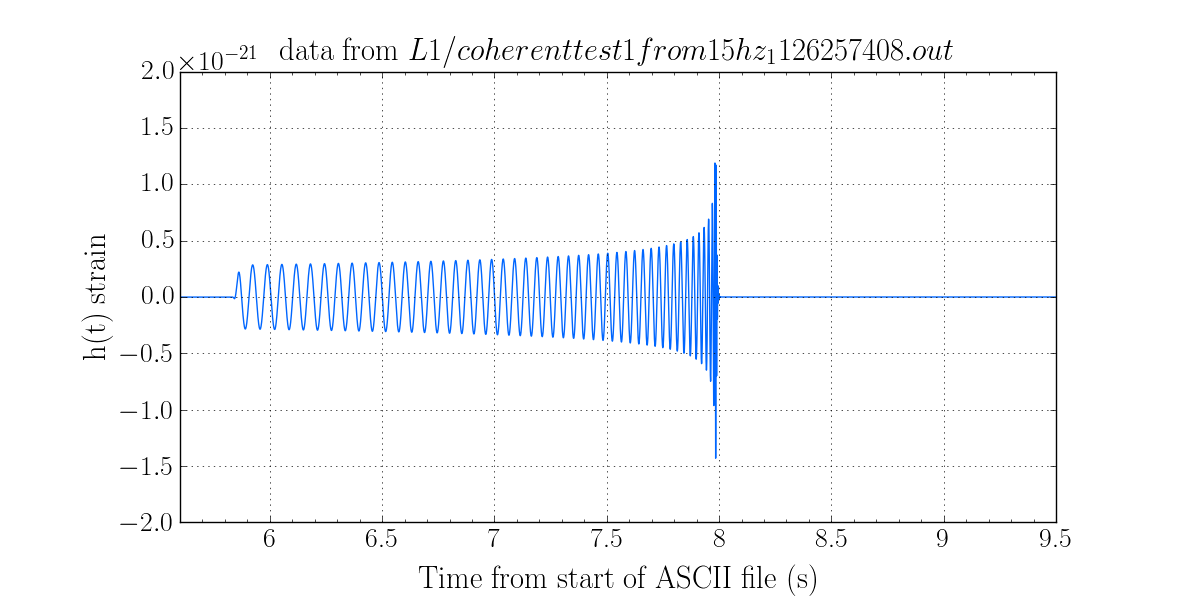
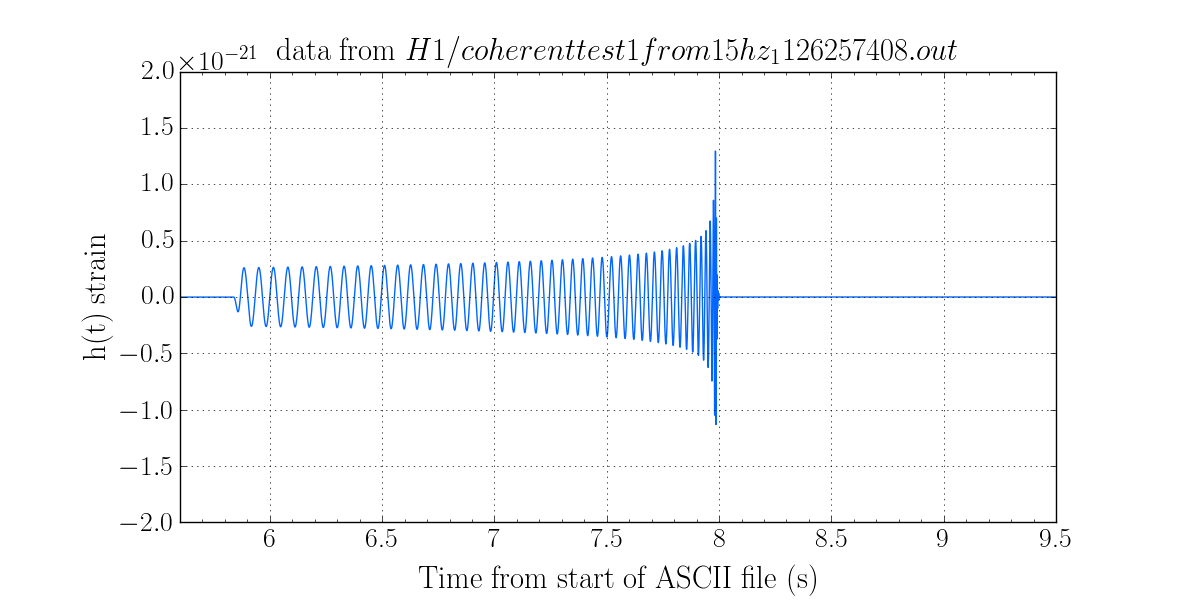
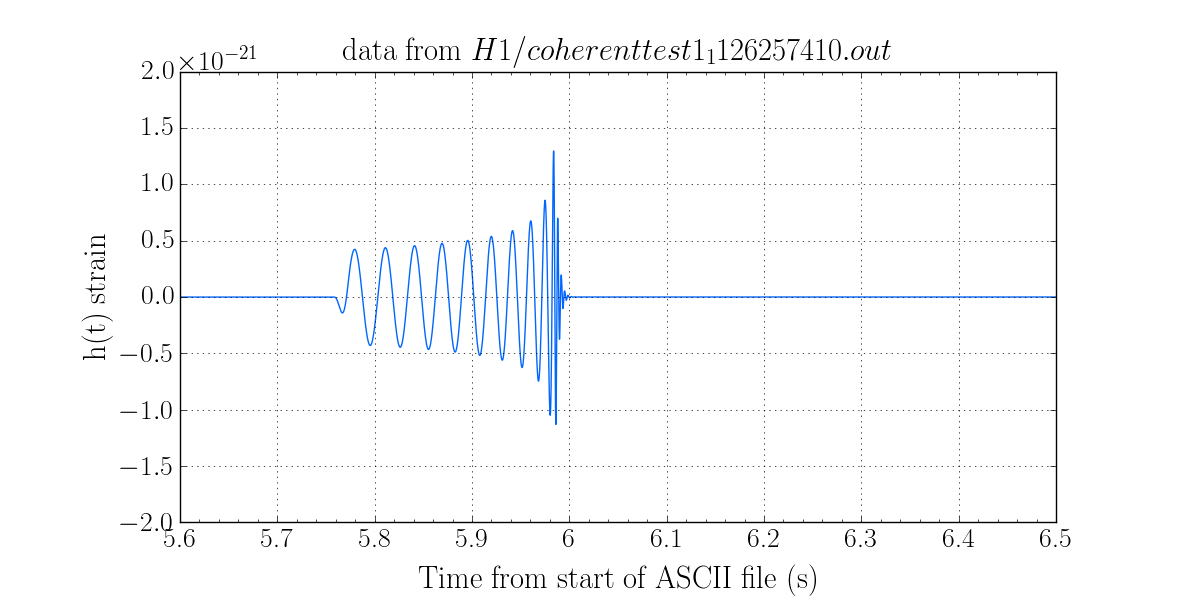
I've uploaded new and approved coherent waveforms for hardware injection testing. SVN is at revision number 5097.

There is a H1L1 coherent version of the September 21 test injection that was done at LHO. It can be found here:
  * H1 waveform
  * L1 waveform
  * XML parameter file

There is a H1L1 coherent version of the September 21 test injection that was done at LHO and the waveform begins at 15Hz. This waveform should be tested after the previous waveform has been tested. It can be found here:
  * H1 waveform
  * L1 waveform
  * XML parameter file
I've attached time series of the four waveforms. Y-axis is h(t) in strain.

EDIT: Re-uploaded image files with title and proper y and x labels.
Chris, I think the links to the XML parameter files are broken, could you please add corrected ones?   Error message:

The requested URL /svn/injection/hwinj/Details/Inspiral/coherenttest1_1126257410.xml.gz was not found on this server.

Cheers, Bruce
Hi sorry forgot the h1l1 at the beginning. https://daqsvn.ligo-la.caltech.edu/svn/injection/hwinj/Details/Inspiral/h1l1coherenttest1_1126257410.xml.gz

and https://daqsvn.ligo-la.caltech.edu/svn/injection/hwinj/Details/Inspiral/h1l1coherenttest1from15hz_1126257410.xml.gz
Cheryl and Jeff brought to my attention that GWIstat was reporting incorrect information today. It turns out that the ~gstlalcbc home directory at Caltech was moved to a new filesystem today; GWIstat gets its information from a process running under that account, and apparently got into a funny state. I have now restarted it. For the rest of the current observing segment it will report the duration only from the time I restarted it, about 3:32 UTC. I apologize for the problem!
I see this morning that GWIstat is not showing the correct duration for the current observing segment. The log file on ldas-grid.ligo.caltech.edu, where it is now running, shows that it was restarted twice during the night for no obvious reason, and it is reporting the duration only since it was restarted. I'll ask the Caltech computing folks to look into this. New hardware for ldas-grid was put into use yesterday, and maybe they were still shaking it down last night.
Stuart Anderson told me this is a known problem that seems to have arisen from a condor configuration change. They know how to fix it but will need to restart condor. Until they do that, gwistat should indicate status correctly (except for momentary outages) but may sometimes display the wrong duration for the current state.
Durring the maintence window we left the DHARD yaw boost on (21768 and 21708). There was no evidence that it caused any problems, but I was putting excitations onto transmon at the time and there were other maintence activities going on. We'd like to check that it doesn't impact the glitch rate, so if LLO drops out of lock or if you see an earthquake on the way ( 0.1um/sec or larger predicted by terramon), it would be great if you can turn it on. You can find it under ASC overview> ASC arm cavities, DHARD YAW FM3 (labled boost). (screenshot)
It would be good to get more than an hour of data, so if you see that LLO has dropped it would be awesome if you could turn this on util they are back up.
This is just a temporary request, only for tonight or the next few days.
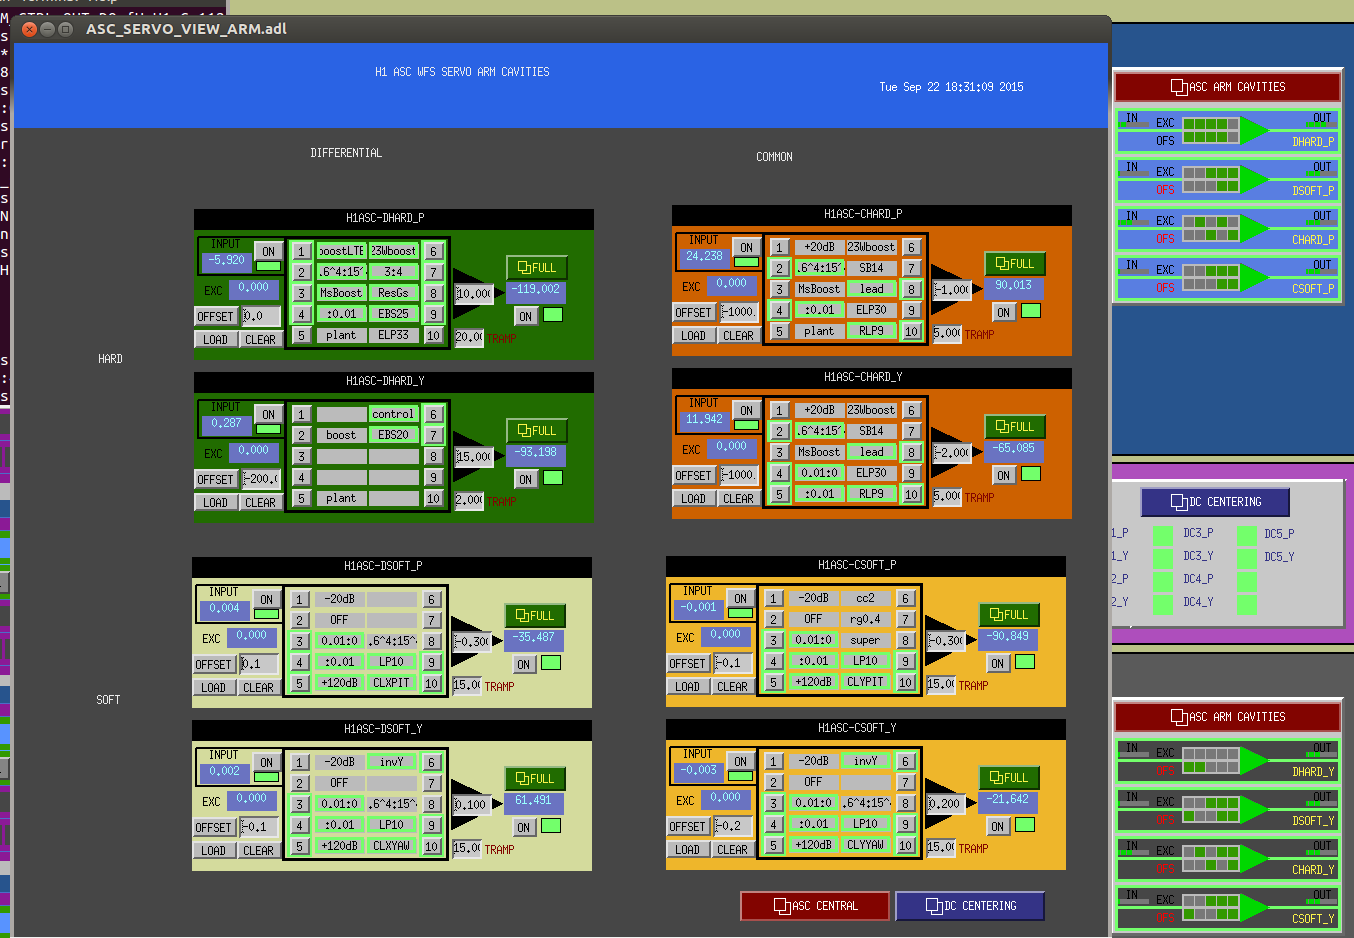
This is actually FM2.
I was texting with Mike to see if taking H1 out of Observation Mode (when L1 is down) for this test was OK by him, and he concurred. This work is referenced by Work Permit #5505. In the work permit, I see a time of 9/21-25 for Period of Activity. So Operators can allow this activity during this time since Mike has signed off on the work permit. (perhaps in the future, we can reference the work permit in alog entries so Operators will know this is an acceptable activity.)
I'm not totally sure about when to make the decision to preemptively turn ON this filter if we get a warning of an impending EQ. It's not totally clear to know which types of EQ will knock us out and which won't. I guess I can look to see if (1) Terramon gives us a RED warning, and also (2) watch 0.03-0.1um/s seismic signal for an order of magnitude increase. Perhaps in that case I could then end Observation Mode and turn ON the filter and stay out of Observation Mode until L1 comes back. (sorry, just trying to come up with a plan of attack in case L1 drops out)
As it stands, L1 has been locked for 10hrs, so we'll keep an eye on them. I asked William to contact me if they drop out (but I'll also watch the FOM & GWI.stat.
I believe that by switching this, while in 'Undisturbed', it will show as an SDF diff thereby automatically taking us to 'Commissioning' mode until the diff is accepted, the ODC Intent ready bit is Green(again) and we can once again click the intent bit to 'Undisturbed'. I asked this at the JRPC meeting yesterday.
Apologies for the wrong FM number, and in the future I'll try to rememver to put the WP number in the alog. Operators can probably stop toggling this filter for now. We will put this on the list of minor changes that we will make on maintence day, so that next tuesday it can be added to the guardian and the observe.snap, along with some HSTS bounce and roll notches.
SudarshanK, DarkhanT
We were using 137 degree of correction factor on kappa_tst on our time varying parameters calculation. (alog 21594). Darkhan found a negative sign that was placed at a wrong position in the DARM model which gave us back 180 degrees of phase. Additionally, Shivaraj found that we were not accounting for DAQ downsampling filter used in ESD Calibration line. These two factors gave us back almost all the phase we were missing. There was also an analog antialiasing filter missing in the actuation TF that was applied in the new model. After these corrections, Darkhan created the new upated epics variable. These epics variable are committed at:
CalSVN/Runs/O1/Scripts/CAL_EPICS
Using these new epics variable, kaapas were recalculated for LHO. For, LLO these epics variable doesnot exist yet. The new plot is attached below. The imaginary parts of all the kappa's are now close to their nominal values of 0 and real part are few percent (2-3%) from their nominal values of 1, which is within the uncertainity of the model. Cavity pole is still off from its nominal value of 341 Hz but has stayed constant over time.
The script to calculate these time varying factors is committed to SVN:
LHO: CalSVN/aligocalibration/trunk/Runs/ER8/H1/Scripts/CAL_PARAM/
LLO: CalSVN/aligocalibration/trunk/Runs/ER8/L1/Scripts/CAL_PARAM/
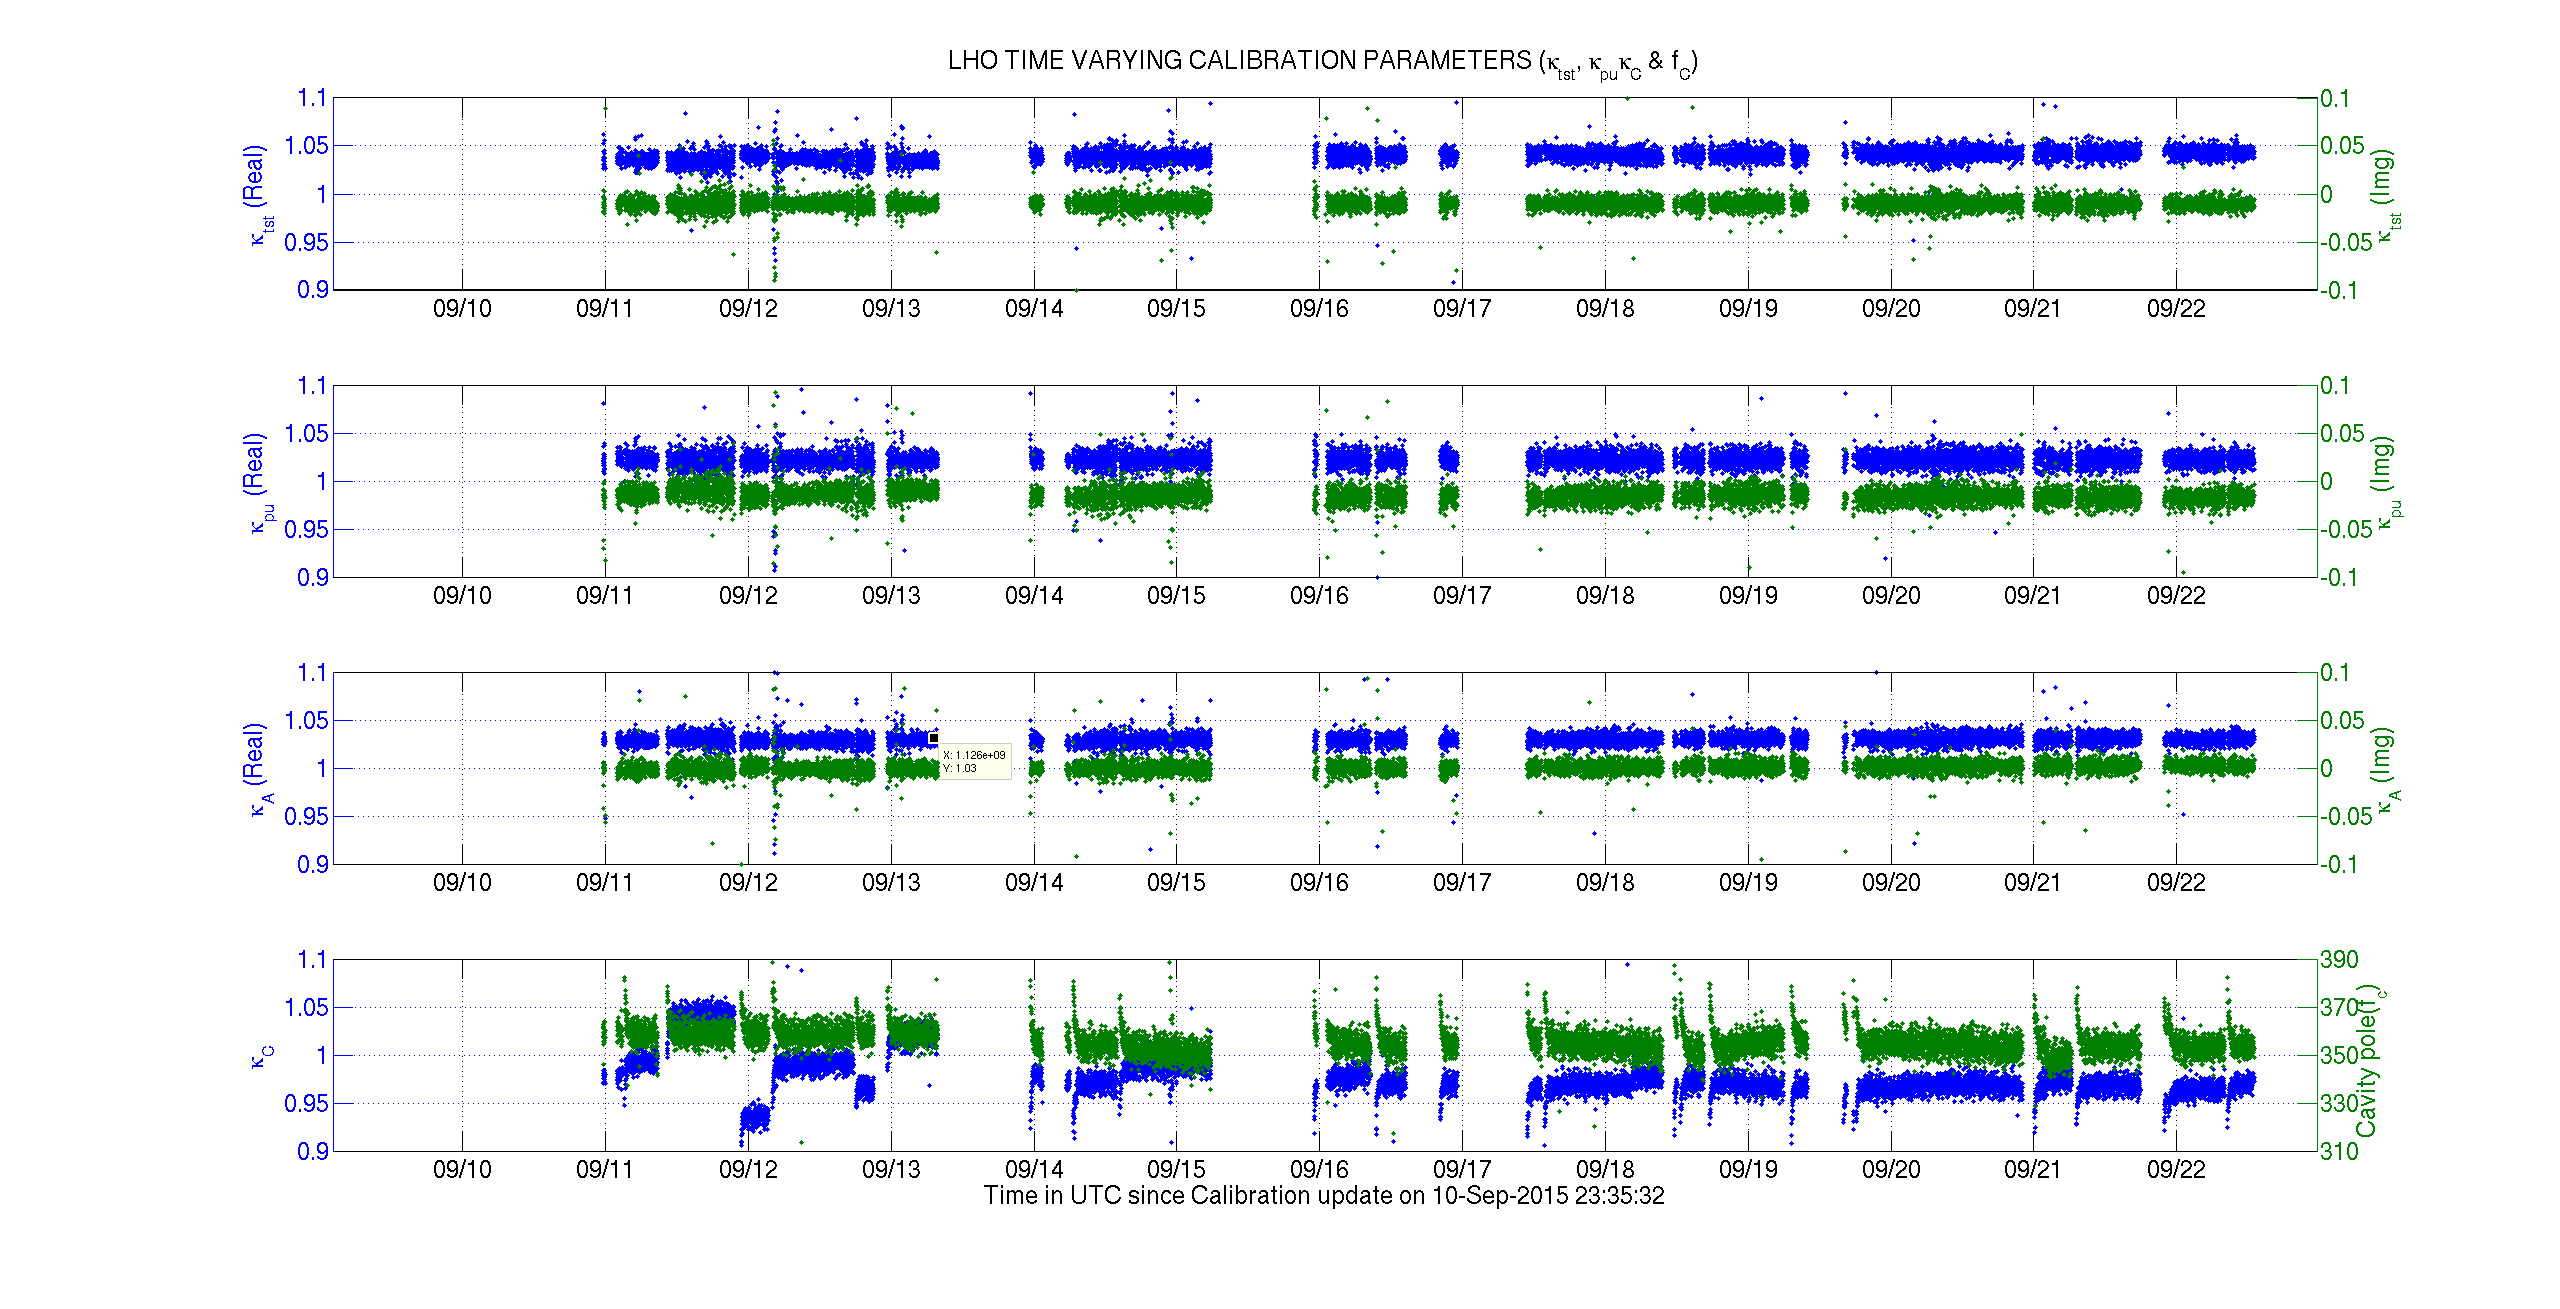
Recall that Stefan made changes to the OMC Power Scaling on Sunday 13 September 2015 (in the late evening PDT, which means Sept 14th UTC). One can see the difference in character (i.e. the subsequent consistency) of kappa_C after this change on Sudarshan's attached plot.

Once can also see that, for a given lock stretch, that the change in optical gain is now more that ~2-3%. That means that ~5 [Mpc] trends we see on our 75 [Mpc] the in-spiral range, which we've seen evolve over long, 6+ hour long lock stretches, cannot be entirely attributed to optical gain fluctuations as we've been flippantly sure of, and claiming.

However, now that we've started calculating these values in the GDS pipeline (LHO aLOGs 21795 and 21812), it will be straight-forward to make comparative plots between the calculated time dependent parameters and every other IFO metric we have. And we will! You can too! Stay tuned!
Just to drive the point home, I took 15 hours' worth of range and optical gain data from our ongoing 41+ hour lock. The optical gain fluctuates by a few percent, but the range fluctuates by more like 10 %.
These are the channels in the DMT (GDS) hoft frames, which include the calibrated strain channel (H1:GDS-CALIB_STRAIN) and the calibration factors (the kappas):
H1:GDS-CALIB_STATE_VECTOR 16
H1:ODC-MASTER_CHANNEL_OUT_DQ 16384
H1:GDS-CALIB_STRAIN 16384
H1:GDS-CALIB_KAPPA_A_REAL 16
H1:GDS-CALIB_KAPPA_A_IMAGINARY 16
H1:GDS-CALIB_KAPPA_TST_REAL 16
H1:GDS-CALIB_KAPPA_TST_IMAGINARY 16
H1:GDS-CALIB_KAPPA_PU_REAL 16
H1:GDS-CALIB_KAPPA_PU_IMAGINARY 16
H1:GDS-CALIB_KAPPA_C 16
H1:GDS-CALIB_F_CC 16
These channels should be available using NDS2.
(For LLO the channels are the same with: H1-> L1.)
I strongly suggest we add EPICS mirrors of these channels (similar to what was done for the sensemon range). This will ensure that (1) they are available in dataviewer, and (2) we have trend data of these channels. We want to be able to look at long-term (week- or month-long) fluctuations of these parameters during O1.
VerbalAlarms reports that DIAG_MAIN guardin node is in error.
Appears to be a standard NDS2 burp:
2015-09-21T22:57:59.11305 File "/ligo/apps/linux-x86_64/guardian-1485/lib/python2.7/site-packages/guardian/worker.py", line 459, in run
2015-09-21T22:57:59.11306 retval = statefunc()
2015-09-21T22:57:59.11306 File "/opt/rtcds/userapps/release/sys/common/guardian/SYS_DIAG.py", line 178, in run
2015-09-21T22:57:59.11307 return SYSDIAG.run_all()
2015-09-21T22:57:59.11307 File "/opt/rtcds/userapps/release/sys/common/guardian/SYS_DIAG.py", line 151, in run_all
2015-09-21T22:57:59.11308 ret &= self.run(name)
2015-09-21T22:57:59.11308 File "/opt/rtcds/userapps/release/sys/common/guardian/SYS_DIAG.py", line 136, in run
2015-09-21T22:57:59.11310 for msg in self[name](**kwargs):
2015-09-21T22:57:59.11311 File "/opt/rtcds/userapps/release/sys/h1/guardian/DIAG_MAIN.py", line 66, in PSL_ISS
2015-09-21T22:57:59.11311 diff_pwr = avg(-10, 'PSL-ISS_DIFFRACTION_AVG')
2015-09-21T22:57:59.11312 File "/ligo/apps/linux-x86_64/cdsutils-497/lib/python2.7/site-packages/cdsutils/avg.py", line 67, in avg
2015-09-21T22:57:59.11312 for buf in conn.iterate(*args):
2015-09-21T22:57:59.11313 RuntimeError: Requested data were not found.
Reloaded.
Having the guardian go into error because of an NDS2 hiccough is kind of irritating.
Based on this StackExchange answer, I added the following handler function to the DIAG MAIN guardian:
def try_avg(*args):
while True:
try:
q = avg(*args)
except RuntimeError:
log('Encountered runtime error while trying to average {}'.format(args[1]))
continue
break
return q
where avg is the cdsutils.avg function.
This is now used for the ISS diffraction and the ESD railing diag tests. If we like it, we should consider propagating it to the rest of the guardian.
This is a fine hack solution for this one case, but please don't propogate this around to all guardian NDS calls. Let me come up with a way to better handle it within the guardian infrastructure, so we don't end up with a lot of cruft in the guardian user code.


