cheryl.vorvick@LIGO.ORG - posted 13:46, Wednesday 23 September 2015 - last comment - 19:18, Wednesday 23 September 2015(21853)
ETMX Diag Reset at 20:45:20UTC
Finished hardware injection tests. More details in upcoming aLog. Last injection went in at approximately 20:35 UTC.
LLO is down - H1 in commissioning for injections and a filter test, starting at 20:16:27UTC.
At times 1127059140GPS (15:58:43UTC), and 1127059260GPS (16:00:43UTC), the H1 Range DMT montor did not get data, so put in the dafult which is -1.
There was no glitch or change to the H1 IFO.
Will notify when done.
Intent mode was turned off before tests.
TITLE: 9/23 OWL Shift: 7:00-15:00UTC (00:00-8:00PDT), all times posted in UTC
STATE OF H1: Continues to be locked from yesterday (that's 30+hrs!).
SUPPORT: None (& not needed)
SHIFT SUMMARY:
H1 continues to hum along.
Toward the end of the shift (starting at 11:00-13:00utc), H1 started to trend down from 77Mpc down to 64Mpc; only thing I could see correlated to this were the 1-30Hz seismic channels. They actually all peaked around 12:30utc and came down & H1 mirrored this. I reckon this seismic bump is Hanford traffic, but that would be only a guess, because I don't see a bump like this for my shift yesterday morning during this same lock.
No opportunity to engage Sheila's new DHARD Yaw Boost filter due to double coincidence the entire shift.
There is a Timing error on ETMx which should be cleared, but I held off doing this because I didn't want to bump H1 out of Observation Mode.
Incoming DAY Operator: Cheryl V.
SHIFT'S ACTIVITIES:
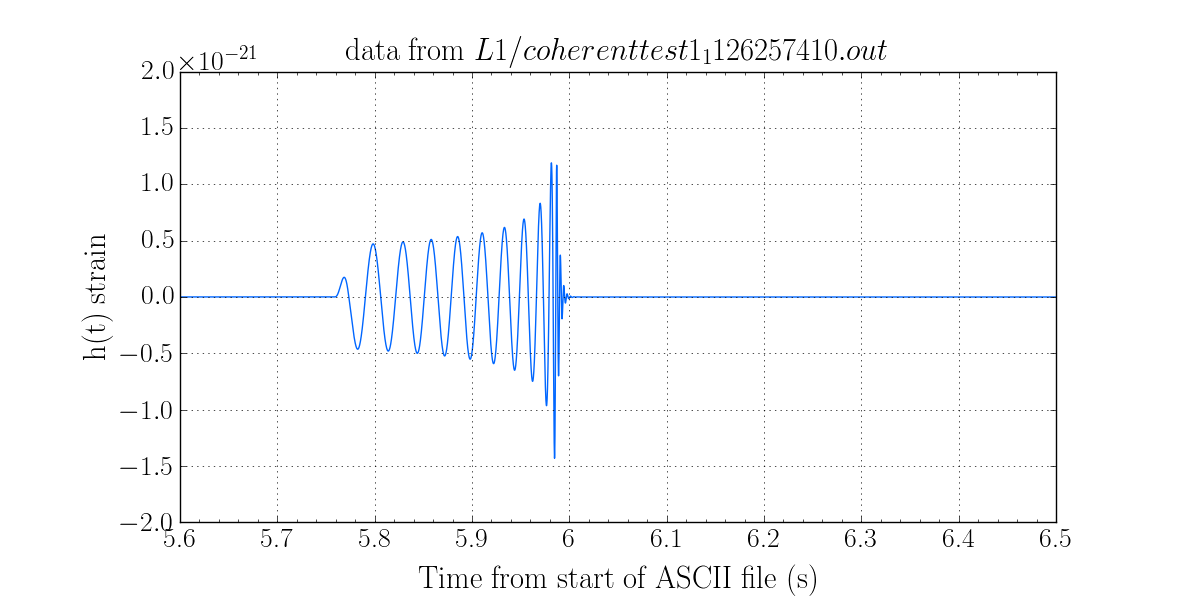
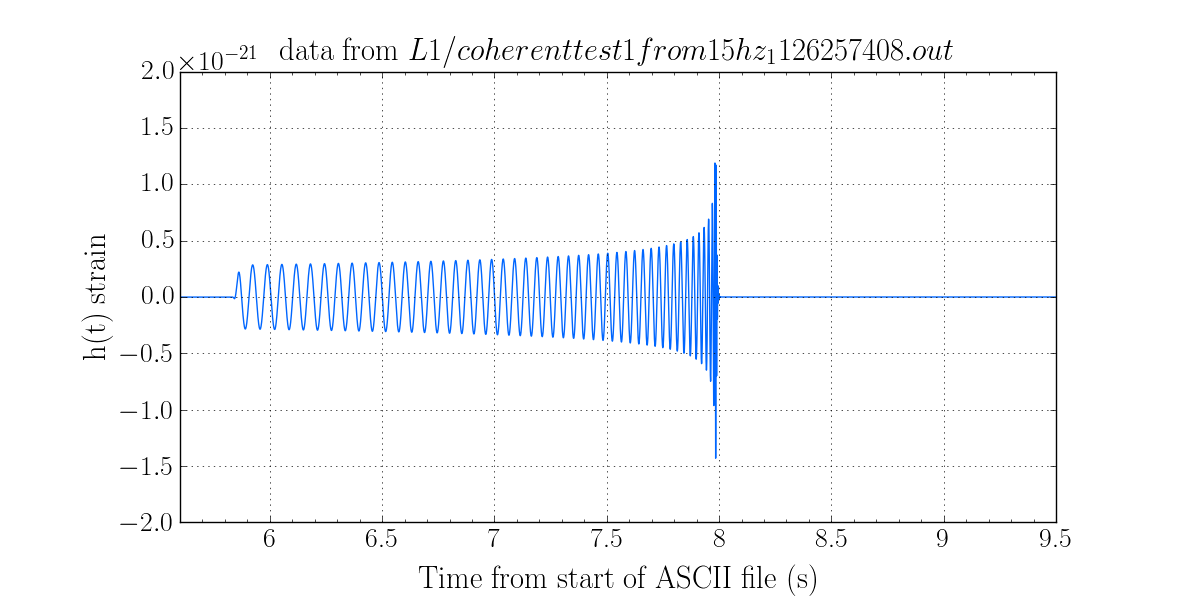
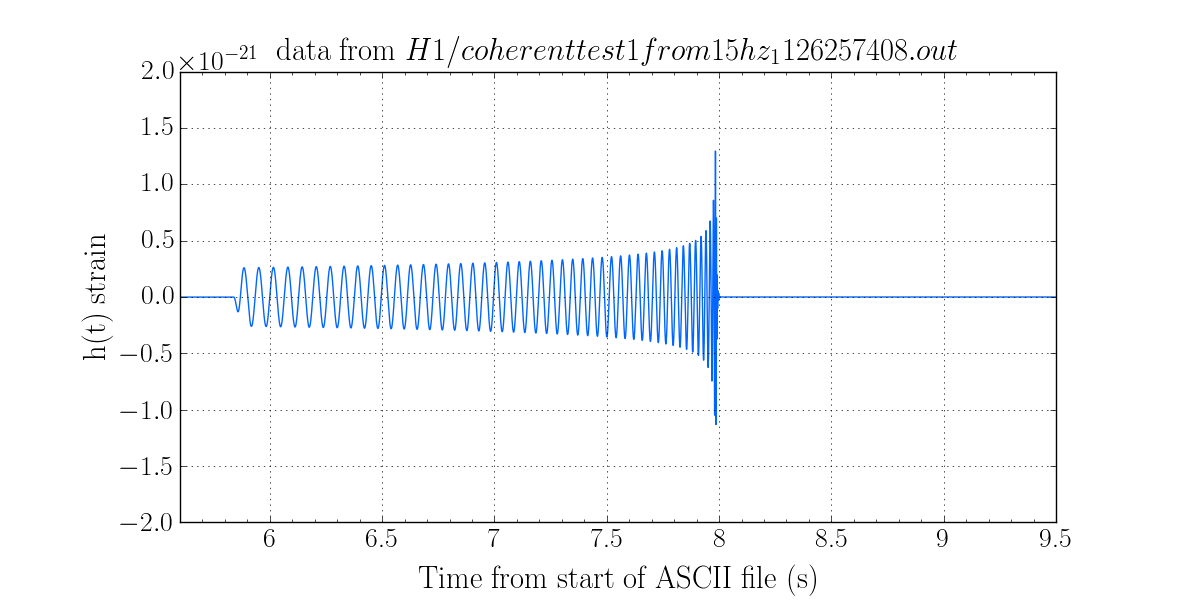
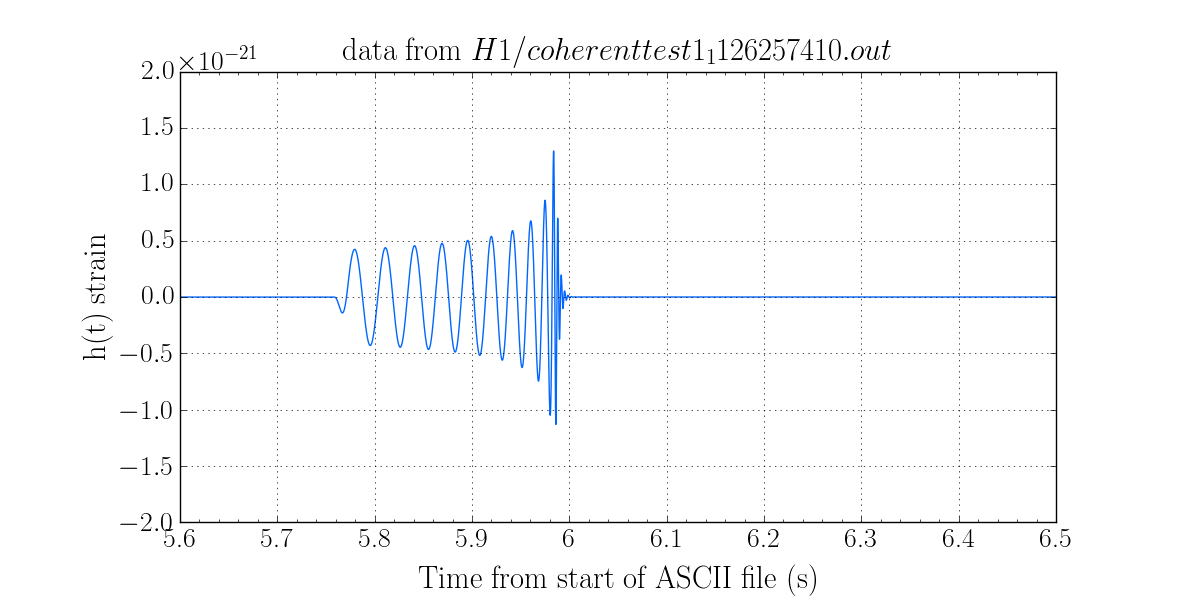
I've uploaded new and approved coherent waveforms for hardware injection testing. SVN is at revision number 5097.

There is a H1L1 coherent version of the September 21 test injection that was done at LHO. It can be found here:
  * H1 waveform
  * L1 waveform
  * XML parameter file

There is a H1L1 coherent version of the September 21 test injection that was done at LHO and the waveform begins at 15Hz. This waveform should be tested after the previous waveform has been tested. It can be found here:
  * H1 waveform
  * L1 waveform
  * XML parameter file
I've attached time series of the four waveforms. Y-axis is h(t) in strain.

EDIT: Re-uploaded image files with title and proper y and x labels.
Chris, I think the links to the XML parameter files are broken, could you please add corrected ones?   Error message:

The requested URL /svn/injection/hwinj/Details/Inspiral/coherenttest1_1126257410.xml.gz was not found on this server.

Cheers, Bruce
Hi sorry forgot the h1l1 at the beginning. https://daqsvn.ligo-la.caltech.edu/svn/injection/hwinj/Details/Inspiral/h1l1coherenttest1_1126257410.xml.gz

and https://daqsvn.ligo-la.caltech.edu/svn/injection/hwinj/Details/Inspiral/h1l1coherenttest1from15hz_1126257410.xml.gz
After completing a number of tests with operator and advocate sign-offs and log entry tagging, we THINK that Approval Processor and the automated programs which annotate an event are working properly.  We have now set the FAR threshold used by Approval Processor to 3.8e-7 Hz, i.e. ~1 per month, for each pipeline.  Therefore, please now take GW trigger alerts seriously, since they will represent apparently significant events found by the low-latency analyses.  Operators (along with remote "EM follow-up Advocates") should review and sign off (OKAY or NOT OKAY) each alert, and the Run Coordinators should seriously consider activating the Rapid Response Teams.  (We will need to see, though, whether the low-latency data analysis pipelines really generate event candidates at the intended rate.)

In truth, we are still in a testing mode now; any alerts generated still will not go out to astronomers for follow up without deliberate manual intervention.  However, in this phase we want to test the software and procedures end-to-end, so please try to follow all procedures as closely as possible if you are on shift.  There should be some hardware signal injections in the near future which, hopefully, will be identified by the low-latency pipelines and trigger this whole process (because, for now, Approval Processor is configured to treat hardware injections like real events).  Seeing this in action should help assure us and the Data Analysis Council that the system is ready to go live.
Received GRB at 10:19:20 UTC via Verbal Alarms.
JeffreyK, SudarshanK, DarkhanT,
Overview
We made comparison plots of a DARM OLG TF and PCAL to DARM TF measurements taken at LHO with H1DARMmodel_ER8 and H1DARMmodel_O1 (uncorrected and corrected with kappa factors).
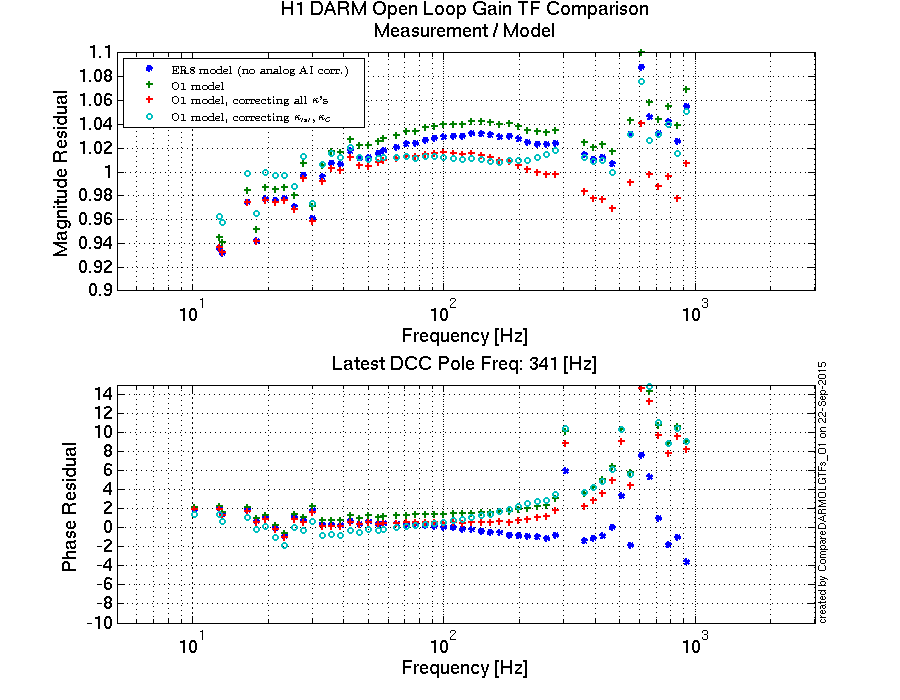
One of the main changes in the DARM model update for O1 compared to ER8 was that in the actuation function for ER8 model we did not account for an analog anti-imaging filter. We included that filter into the O1 model. Adding previously missing analog AI filter into the actuation function model increased the (measurement / model) residual to about 1% in magnitude and to ~6 deg around 500 Hz (~10 deg around 900 Hz). Initally some of the ER8 model parameter estimations (ESD/CD gains) were done to best fit the measurments for actuation function that does not include an analog AI.
We also took kappas calculated from calibration lines within about 20 minutes from DARM OLG TF measurement and plotted DARM model for O1 corrected with kappas in two different ways against the measurement to see how kappa corrections will take care of systematics in the model. At this point we don't have comparison results of the DARM OLG TF and PCAL2DARM TF measurements and kappa estimations to make a distinct statement. For this particular measurement from Sep 10, the DARM model that was corrected with κtst and κC produced smaller DARM OLG TF residual and actuation function residual compared to uncorrected model, but the sensing function residual was did not improve by the correction (see attached pdf's for actuation and sensing residuals).
Details
Some of the known issues / systematics in our DARM OLG TF model include:
- inverse actuation filters need to accout for an extra -1 sign (was fixed, see LHO alog 21703);
- CAL-CS reproduction should have a sign that's opposite from DARM output matrix (at LHO we had this correct, but it needed to be fixed at LLO).
This issue affects EP1 value that's written into Epics record and used for estimation of DARM time-dependent parameters (T1500377). At LHO in the DARM model for ER8 we manually rotated phase of EP1 to +44.4 degrees to account for this discrepancy; we modified both the paramter file and the DARM model script to account for the DAQ downsampling filter TF calculated at the xtst line frequency.
- residuals of actuation function and total DARM OLG TF (systemaic error);
- EP1-9 that are used for estimation of DARM temporal variations.
This variable might have been used in GDS calibration, we need to verify with MaddieW to make sure that this extra time delay is not included into GDS code.
One of the possible sources of systematic error in the sensing function model is using a single-pole TF to approximate IFO response.
Some of the parameters of the actuation functions were estimated without taking into account an analog AI filter (one of the issues listed above). We need to revisit ER8/O1 actuation function analysis results.
A comparison script, an updated DARM model script and DARM paramter files were committed calibration SVN:
CalSVN/aligocalibration/trunk/Runs/O1/H1/Scripts/DARMOLGTFs/
Plots were committed to:
CalSVN/aligocalibration/trunk/Runs/O1/H1/Results/DARMOLGTFs/
P.S. I'll add references later.
Maddie has confirmed that she has used the matlab model parameter par.t.actuation to inform the high-frequency and time-delay corrections to the output of the CAL-CS pipeline.

This confirms that there is a systematic error in the output of the GDS pipeline output at both observatories -- an extra IOP (65 [kHz]) clock cycle, 15 [us] delay on the actuation path, which results in a ~0.5 [deg] phase mismatch between the reconstructed and true actuation and sensing paths at 100 [Hz]. This is small effect, but given our dwindling person-power, and continued pressure to have been done yesterday, we will not quantitatively assess the impact this has on systematic errors. We will instead, merely update the GDS pipeline to use the correct actuation delay (hopefully next Tuesday), and use that as our stopping point for when we stop re-calibrating prior data.
TITLE: 9/23 OWL Shift: 7:00-15:00UTC (00:00-8:00PDT), all times posted in UTC
STATE OF H1: OBSERVATION @ 76Mpc
OUTGOING OPERATOR: Jim W.
SUPPORT: Darkhan still here (Sheila is on-call, if needed)
QUICK SUMMARY:
Noticed there is a RED Timing error for H1SUSETMX. Would like to hit Diag_Reset to see if this clears this error, but I'm not sure if this knocks us out of Observation Mode. Will hold off.
I brought up this question on my last shift and I believe the answer was that it's inconsequential to reset this bit while Observing except that subsequential errors may be happening during the period that it's RED and we won't know about them/be able to see them in the trend. I took a trend last week at the beginning of one of my shifts and found this error had only happened ~ 1/week. So as far as I can tell you, it's ok to reset this error, but it would be nice to get this blessing from the CDS crew.
Cheryl and Jeff brought to my attention that GWIstat was reporting incorrect information today. It turns out that the ~gstlalcbc home directory at Caltech was moved to a new filesystem today; GWIstat gets its information from a process running under that account, and apparently got into a funny state. I have now restarted it. For the rest of the current observing segment it will report the duration only from the time I restarted it, about 3:32 UTC. I apologize for the problem!
I see this morning that GWIstat is not showing the correct duration for the current observing segment. The log file on ldas-grid.ligo.caltech.edu, where it is now running, shows that it was restarted twice during the night for no obvious reason, and it is reporting the duration only since it was restarted. I'll ask the Caltech computing folks to look into this. New hardware for ldas-grid was put into use yesterday, and maybe they were still shaking it down last night.
Stuart Anderson told me this is a known problem that seems to have arisen from a condor configuration change. They know how to fix it but will need to restart condor. Until they do that, gwistat should indicate status correctly (except for momentary outages) but may sometimes display the wrong duration for the current state.
Durring the maintence window we left the DHARD yaw boost on (21768 and 21708). There was no evidence that it caused any problems, but I was putting excitations onto transmon at the time and there were other maintence activities going on. We'd like to check that it doesn't impact the glitch rate, so if LLO drops out of lock or if you see an earthquake on the way ( 0.1um/sec or larger predicted by terramon), it would be great if you can turn it on. You can find it under ASC overview> ASC arm cavities, DHARD YAW FM3 (labled boost). (screenshot)
It would be good to get more than an hour of data, so if you see that LLO has dropped it would be awesome if you could turn this on util they are back up.
This is just a temporary request, only for tonight or the next few days.
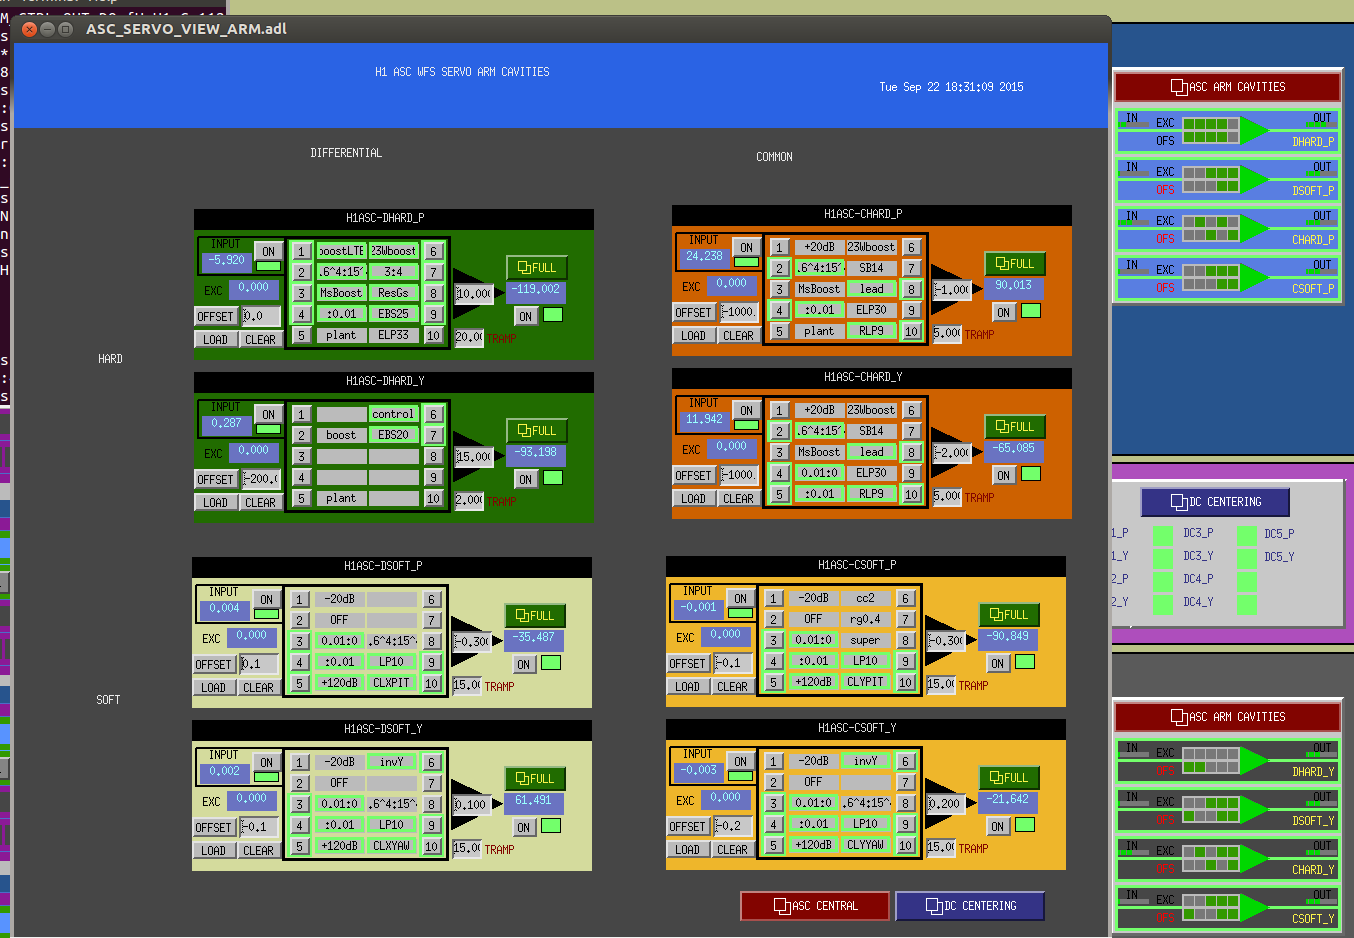
This is actually FM2.
I was texting with Mike to see if taking H1 out of Observation Mode (when L1 is down) for this test was OK by him, and he concurred. This work is referenced by Work Permit #5505. In the work permit, I see a time of 9/21-25 for Period of Activity. So Operators can allow this activity during this time since Mike has signed off on the work permit. (perhaps in the future, we can reference the work permit in alog entries so Operators will know this is an acceptable activity.)
I'm not totally sure about when to make the decision to preemptively turn ON this filter if we get a warning of an impending EQ. It's not totally clear to know which types of EQ will knock us out and which won't. I guess I can look to see if (1) Terramon gives us a RED warning, and also (2) watch 0.03-0.1um/s seismic signal for an order of magnitude increase. Perhaps in that case I could then end Observation Mode and turn ON the filter and stay out of Observation Mode until L1 comes back. (sorry, just trying to come up with a plan of attack in case L1 drops out)
As it stands, L1 has been locked for 10hrs, so we'll keep an eye on them. I asked William to contact me if they drop out (but I'll also watch the FOM & GWI.stat.
I believe that by switching this, while in 'Undisturbed', it will show as an SDF diff thereby automatically taking us to 'Commissioning' mode until the diff is accepted, the ODC Intent ready bit is Green(again) and we can once again click the intent bit to 'Undisturbed'. I asked this at the JRPC meeting yesterday.
Apologies for the wrong FM number, and in the future I'll try to rememver to put the WP number in the alog. Operators can probably stop toggling this filter for now. We will put this on the list of minor changes that we will make on maintence day, so that next tuesday it can be added to the guardian and the observe.snap, along with some HSTS bounce and roll notches.
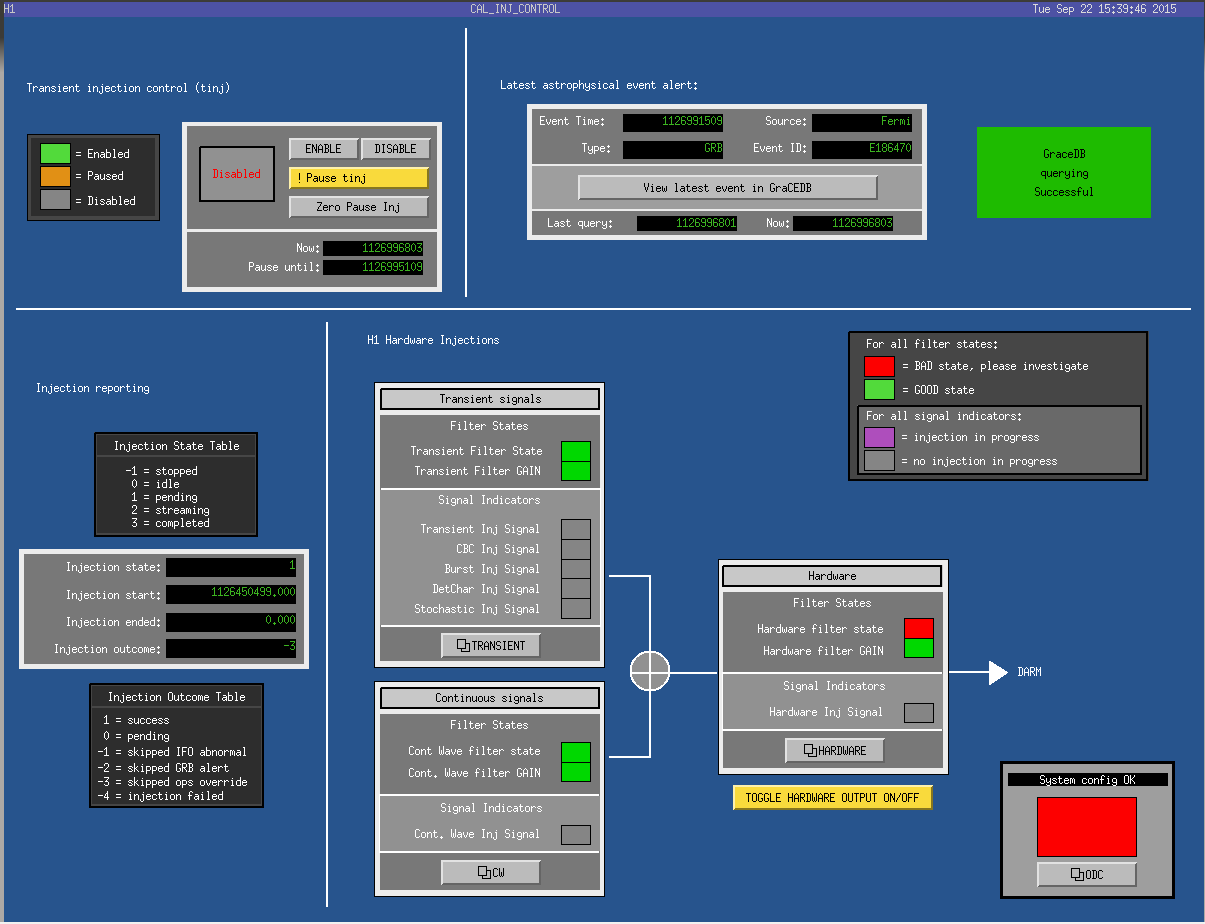
Updated CAL_INJ_CONTROL medm. It is organized a bit differently, labels have changes slightly, and even has a new button! Duncan Macleod supplied us with an updated ext_alert.py that polls GraceDB for new events (both "E" and "G" types), places the new info in some EPICS records, and then will automatically pause injections for either 3600s or 10800s depending on the event.
The Transient Injection Control now has the ability to zero out the pause inj channel. Why is this necessary? The script running in the background of this screen will automatically PAUSE the injections when a new external event alert is detected. If we are down when we get a GRB alert, the script should still pause the injections. The Operator will then need to enable the injections and zero the pause time.
One other thing for Operators to look out for is if we want the injections to stop for longer than the automatic pause time. If we disable the injections by clicking the "Disable" button, and then a new event comes in, it will automatically switch from Disabled --> Paused (this happened to us a few minutes after we started up the script). I am not 100% positive on this, but it seems that when the pause time is up the injections will continue. If this is so, it's definitely something Operators need to watch for.
We will see how this goes and make changes if necessary.
New screen shot attached.
There was apparently some confusion about pausing mechanisms; see alog 21822. If the scheme referred to there is restored, the PAUSE and ENABLE features will be fully under the control of the operators. Independently, injections will automatically be paused by the action of the GRB alert code setting the CAL-INJ_EXTTRIG_ALERT_TIME channel. I have emailed Duncan to try to sort this out.
Last night there were two GRB alerts that paused the injections, and they DID NOT enable Tinj. The Tinj Control went back to Disabled as we had it set to previously. This is good and works as outlined in the HWInjBookkeeping wiki (Thank you Peter Shawhan!). This was my main worry and seems that has already taken care of. It is a bit misleading when the Tinj control goes from Disabled --> Paused and begins to count up to the "Pause Until" time, but after trending the channels it shows that will not enable the Tinj after the times meet.
Elli and Stefan showed in aLOG 20827 that the signals measured by AS 36 WFS for SRM and BS alignment appeared to be strongly dependent on the power circulating in the interferometer. This was apparently not seen to be the case in L1. As a result, I've been looking at the AS 36 sensing with a Finesse model (L1300231), to see if this variability is reproducible in simulation, and also to see what other IFO variables can affect this variability.
In the past when looking for differences between L1 and H1 length sensing (for the SRC in particular), the mode matching of the SRC has come up as a likely candidate. This is mainly because of the relatively large uncertainties in the SR3 mirror RoC combined with the strong dependence of the SRC mode on the SR3 RoC. I thought this would therefore be a good place to start when looking at the alignment sensors at the AS port. I don't expect the SR3 RoC to be very dependent on IFO power, but having a larger SR3 RoC offset (or one in a particular direction) may increase the dependence of the AS WFS signals on the ITM thermal lenses (which are the main IFO variables we typically expect to change with IFO power). This might therefore explain why H1 sees a bigger change in the ASC signals than L1 as the IFOs heat up.
My first step was to observe the change in AS 36 WFS signals as a function of SR3 RoC. The results for the two DOFs shown in aLOG 20827 (MICH = BS, SRC2 = SRM) are shown in the attached plots. I did not spend much time adjusting Gouy phases or demod phases at the WFS in order to match the experiment, but I did make sure that the Gouy phase difference between WFSA and WFSB was 90deg at the nominal SR3 RoC. In the attached plots we can see that the AS 36 WFS signals are definitely changing with SR3 RoC, in some cases even changing sign (e.g. SRM Yaw to ASA36I/Q and SRM Pitch to ASA36I/Q). It's difficult at this stage to compare very closely with the experimental data shown in aLOG 20827, but at least we can say that from model it's not unexpected that these ASC sensing matrix elements are changing with some IFO mode mismatches. The same plots are available for all alignment DOFs, but that's 22 in total so I'm sparing you all the ones which weren't measured during IFO warm up.
The next step will be to look at the dependence of the same ASC matrix elements on common ITM thermal lens values, for a few different SR3 RoC offsets. This is where we might be able to see something that explains the difference between L1 and H1 in this respect. (Of course, there may be other effects which contribute here, such as differential ITM lensing, spot position offsets on the WFS, drifting of uncontrolled DOFs when the IFO heats up... but we have to start somewhere).
Can you add a plot of the amplitude and phase of 36MHz signal that is common to all four quadrants when there's no misalignment?
As requested, here are plots of the 36MHz signal that is common to all quadrants at the ASWFSA and ASWFSB locations in the simulation. I also checked whether the "sidebands on sidebands" from the series modulation at the EOM had any influence on the signal that shows up here: apparently it does not make a difference beyond the ~100ppm level.
At Daniel's suggestion, I adjusted the overall WFS phases so that the 36MHz bias signal shows up only in the I-phase channels. This was done just by adding the phase shown in the plots in the previous comment to both I and Q detectors in the simulation. I've attached the ASWFS sensing matrix elements for MICH (BS) and SRC2 (SRM) again here with the new demod phase basis.
**EDIT** When I reran the code to output the sensitivities to WFS spot position (see below) I also output the MICH (BS) and SRC2 (SRM) DOFs again, as well as all the other ASC DOFs. Motivated by some discussion with Keita about why PIT and YAW looked so different, I checked again how different they were. In the outputs from the re-run, PIT and YAW don't look so different now (see attached files with "phased" suffix, now also including SRC1 (SR2) actuation). The PIT plots are the same as previously, but the YAW plots are different to previous and now agree better with PIT plots.
I suspect that the reason for the earlier difference had something to do with the demod phases not having been adjusted from default for YAW signals, but I wasn't yet able to recreate the error. Another possibility is that I just uploaded old plots with the same names by mistake.
To clarify the point of adjusting the WFS demod phases like this, I also added four new alignment DOFs corresponding to spot position on WFSA and WFSB, in ptich and yaw directions. This was done by dithering a steering mirror in the path just before each WFS, and double demodulating at the 36MHz frequency (in I and Q) and then at the dither frequency. The attached plots show what you would expect to see: In each DOF the sensitivity to spot position is all in the I quadrature (first-order sensitivity to spot position due to the 36MHz bias). Naturally, WFSA spot position doesn't show up at WFSB and vice versa, and yaw position doesn't show up in the WFS pitch signal and vice versa.
For completeness, the yaxis is in units of W/rad tilt of the steering mirror that is being dithered. For WFSA the steering mirror is 0.1m from the WFSA location, and for WFSB the steering mirror is 0.2878m from the WFSB location. We can convert the axes to W/mm spot position or similar from this information, or into W/beam_radius using the fact that the beam spot sizes are at 567µm at WFSA and 146µm at WFSB.
As shown above the 36MHz WFS are sensitive in one quadrature to spot position, due to the constant presence of a 36MHz signal at the WFS. This fact, combined with the possibility of poor spot centering on the WFS due to the effects of "junk" carrier light, is a potential cause of badness in the 36MHz AS WFS loops. Daniel and Keita were interested to know if the spot centering could be improved by using some kind of RF QPD that balances either the 18MHz (or 90MHz) RF signals between quadrants to effectively center the 9MHz (or 45MHz) sideband field, instead of the time averaged sum of all fields (DC centering) that is sensitive to junk carrier light. In Daniel's words, you can think of this as kind of an "RF optical lever".
This brought up the question of which sideband field's spot postion at the WFS changes most when either the BS, SR2 or SRM are actuated.
To answer that question, I:
Some observations from the plots:
I looked again at some of the 2f WFS signals, this time with a linear sweep over alignment offsets rather than a dither transfer function. I attached the results here, with detectors being phased to have the constant signal always in I quadrature. As noted before by Daniel, AS18Q looks like a good signal for MICH sensing, as it is pretty insensitive to beam spot position on the WFS. Since I was looking at larger alignment offsets, I included higher-order modes up to order 6 in the calculation, and all length DOFs were locked. This was for zero SR3 RoC offset, so mode matching is optimal.
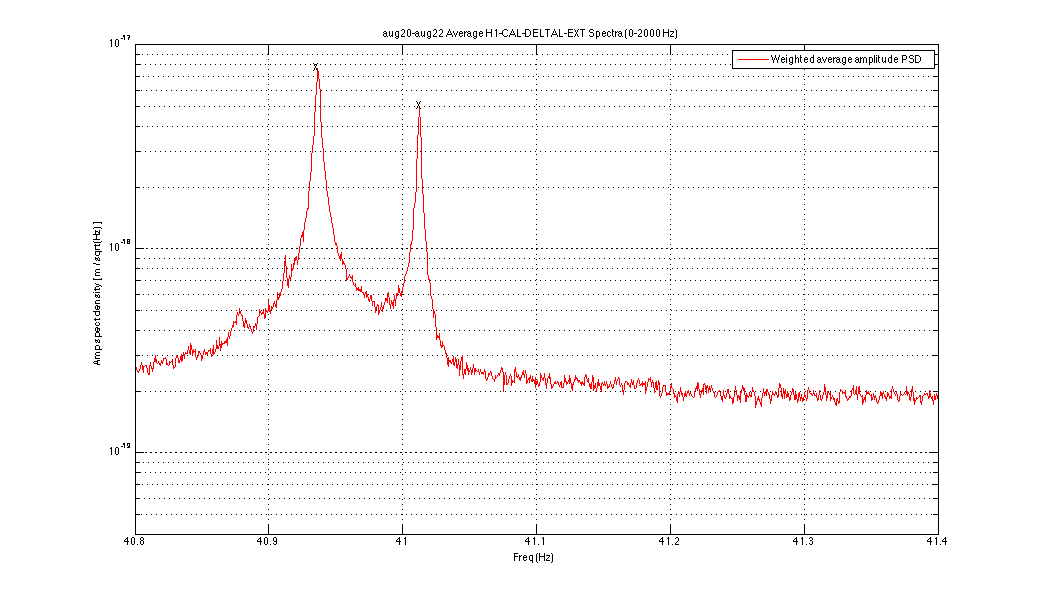
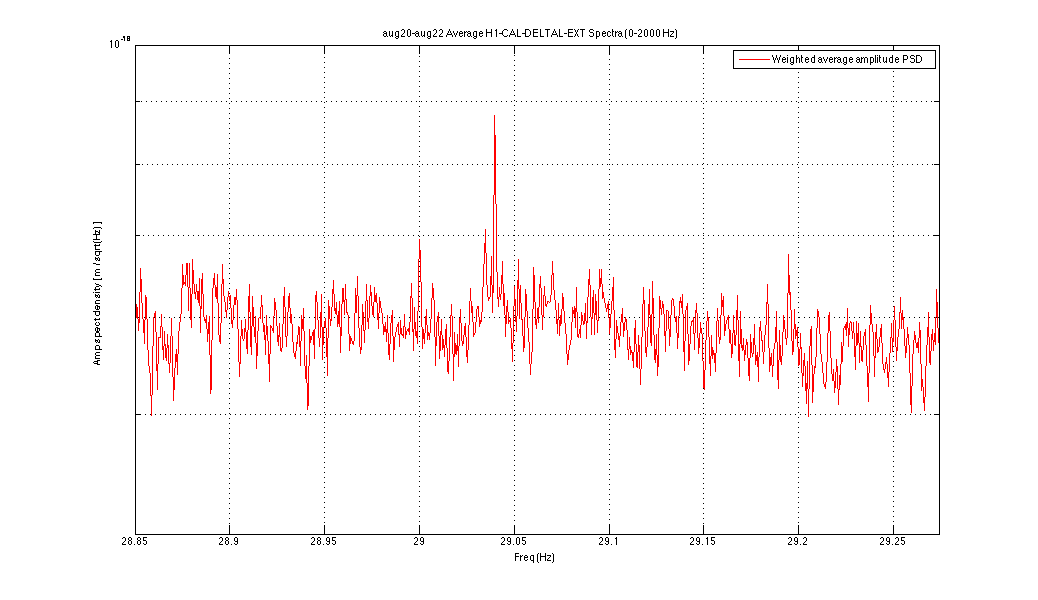
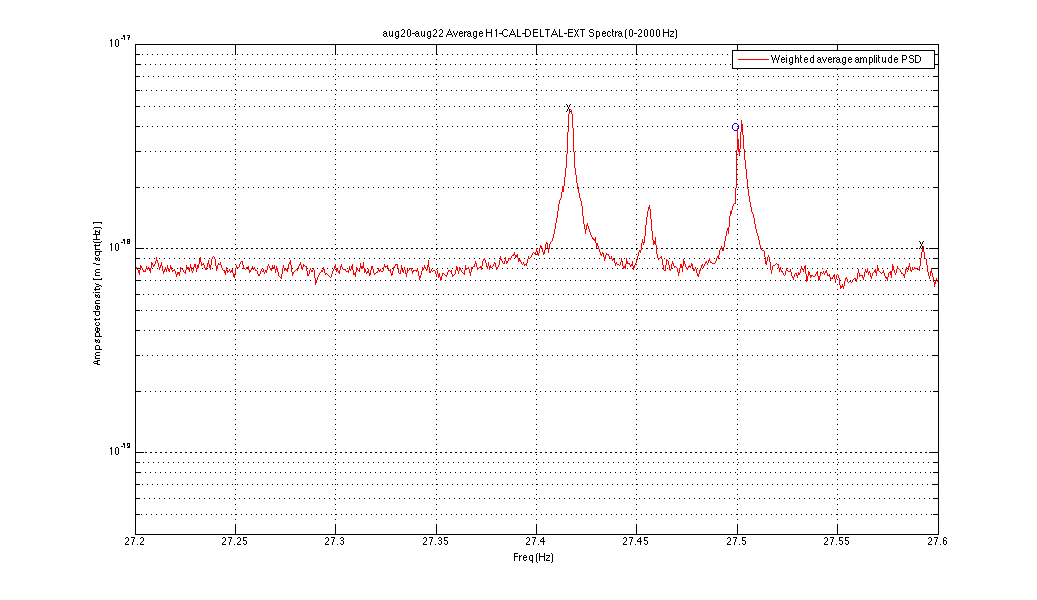
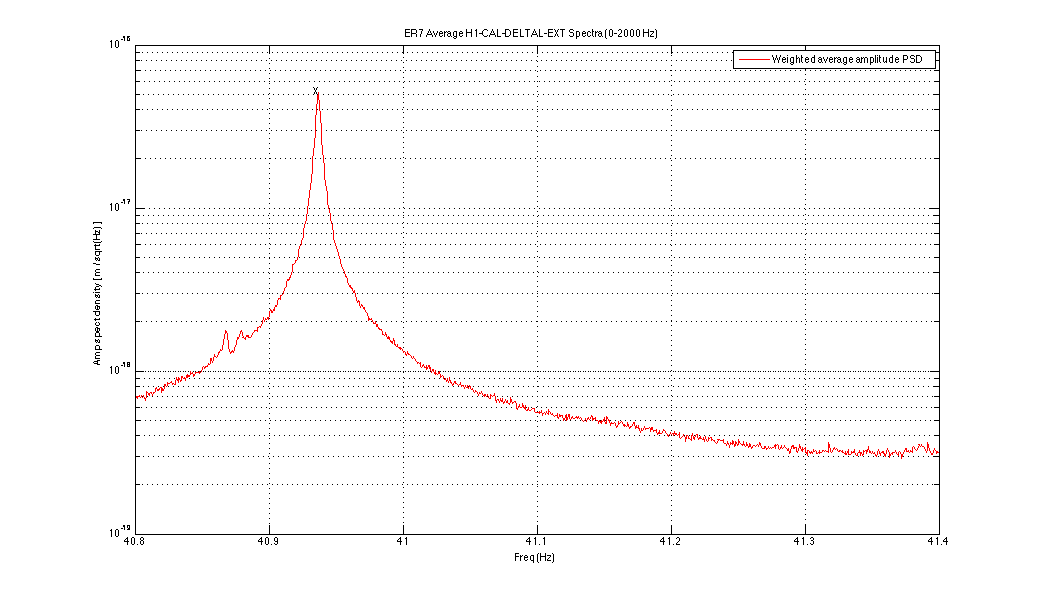
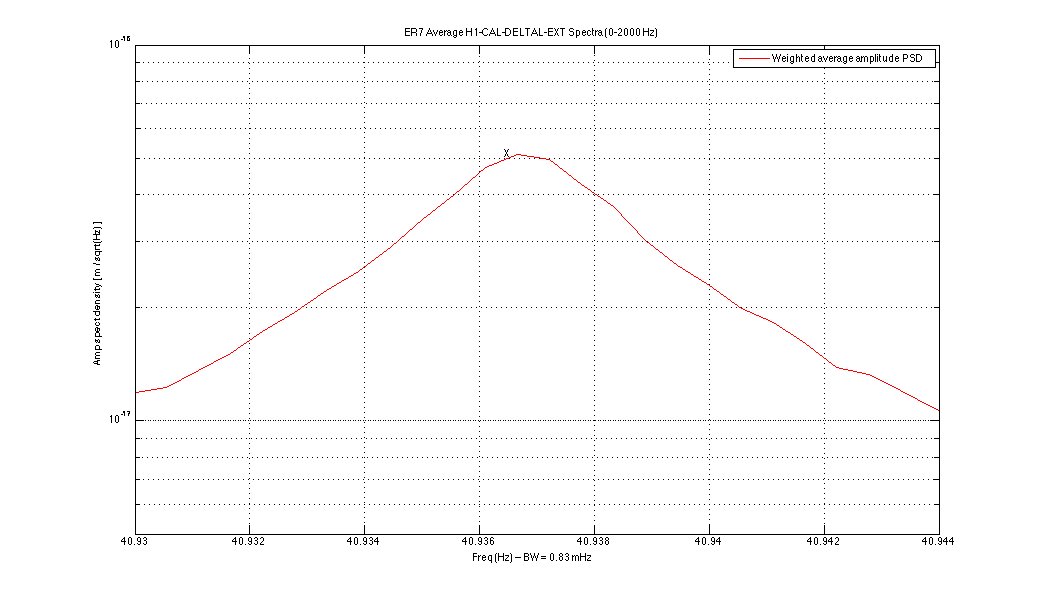
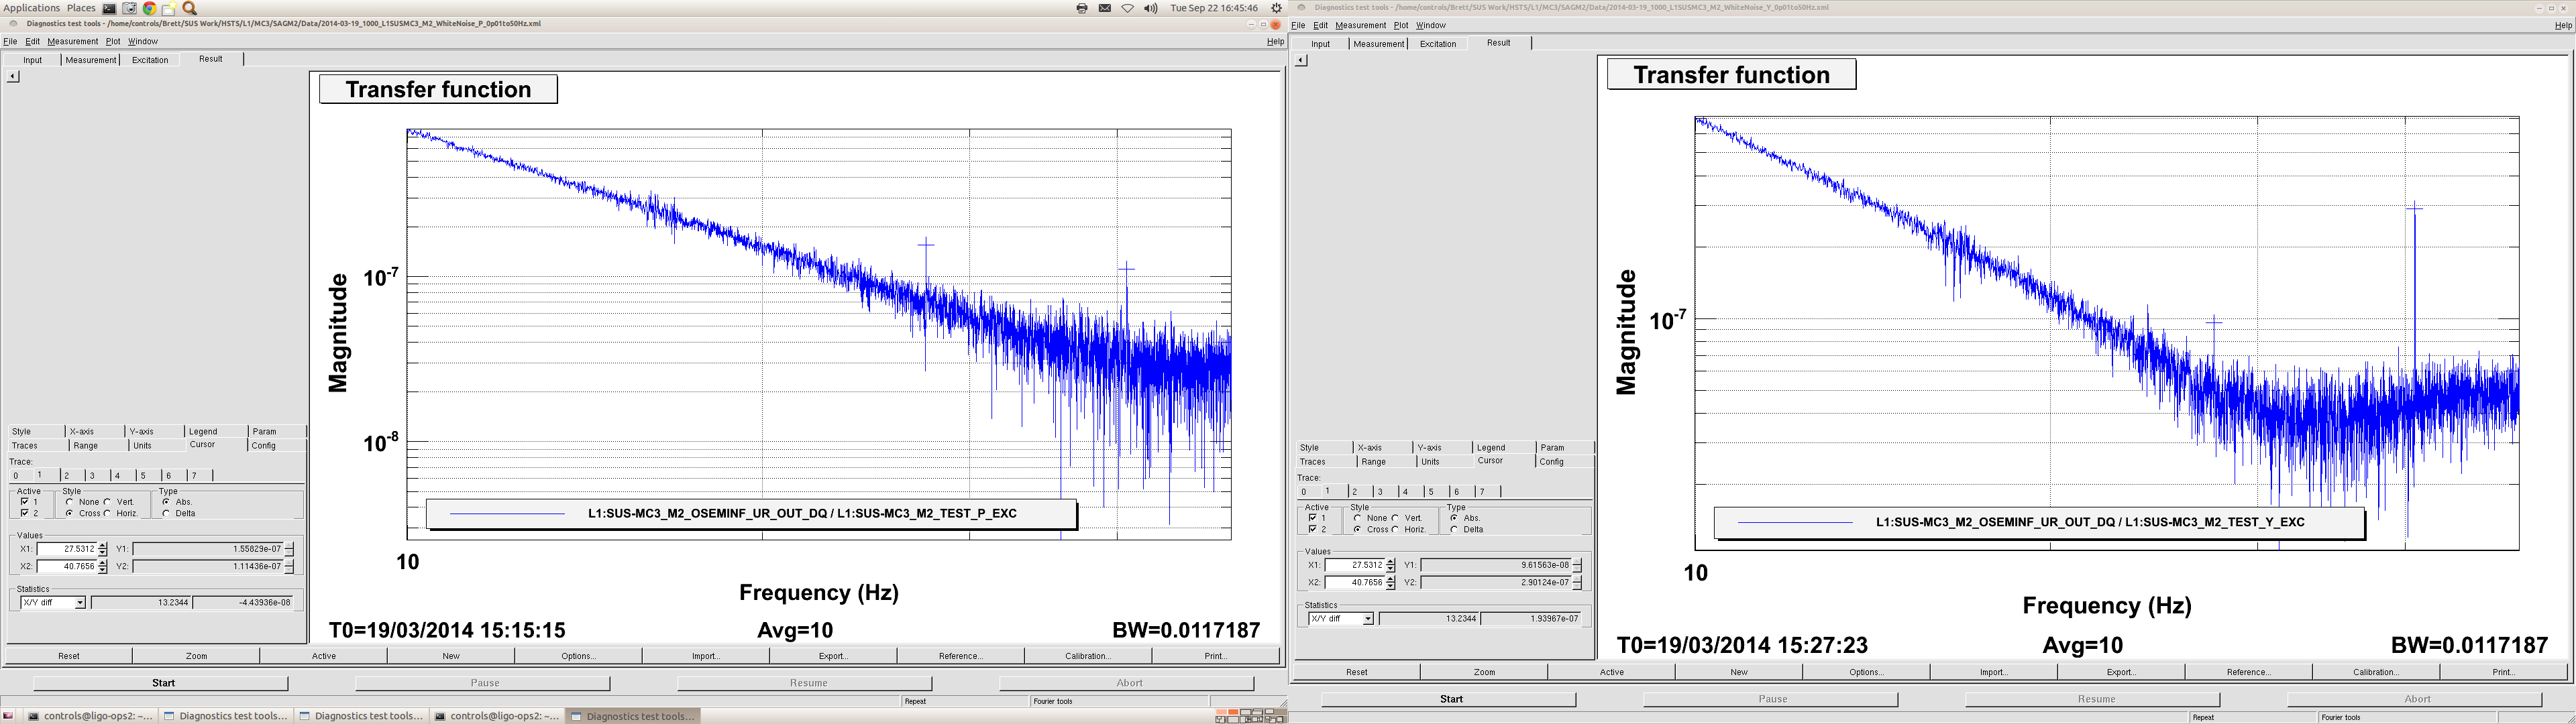
It was noted recently elsewhere that there are a pair of lines in DARM near 41 Hz
that may be the roll modes of triplet suspensions. In particular, there is
a prediction of 40.369 Hz for the roll mode labeled ModeR3.

Attached is a zoom of displacement spectrum in that band from 50 hours of early
ER8 data. Since one naively expects a bounce mode at 1/sqrt(2) of the roll mode,
also attached is a zoom of that region for which the evidence of
bounce modes seems weak. The visible lines are much narrower,
and one coincides with an integer frequency.

For completeness, I also looked at various potential subharmonics  and harmonics
of these lines, in case the 41-Hz pair come from some other source with non-linear coupling.
The only ones that appeared at all plausible were at about 2/3 of 41 Hz.

Specifically, the peaks at 40.9365 and 41.0127 Hz have potential 2/3 partners at
27.4170 and 27.5025 Hz (ratios: 0.6697 and 0.6706) -- see 3rd attachment. The
non-equality of the ratios with 0.6667 is not necessarily inconsistent with a harmonic
relation, since we've seen that quad suspension violin modes do not follow a strict harmonic
progression, and triplets are almost as complicated as quads. On the other hand, I do not see
any evidence at all for the 4th or 5th harmonics in the data set, despite the comparable strain
strengths seen for the putative 2nd and 3rd harmonics.

Notes:
* The frequency ranges of the three plots are chosen so that the two peaks would
appear in the same physical locations in the graphs if the nominal sqrt(2) and 2/3 relations were exact..
* There is another, smaller peak of comparable width between the two peaks near 27 Hz,
which may be another mechanical resonance.
* The 27.5025-Hz line has a width that encompasses a 25.5000-hz line that is part of a
1-Hz comb with a 0.5-Hz offset reported previously.
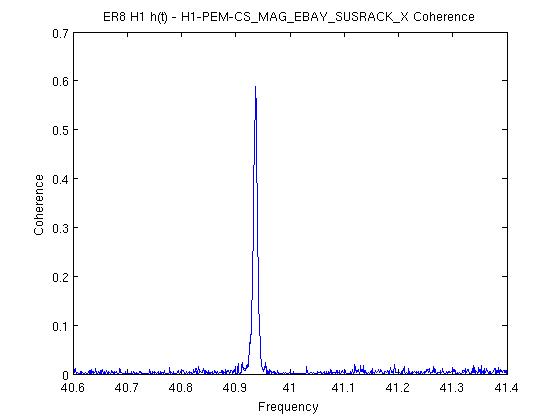
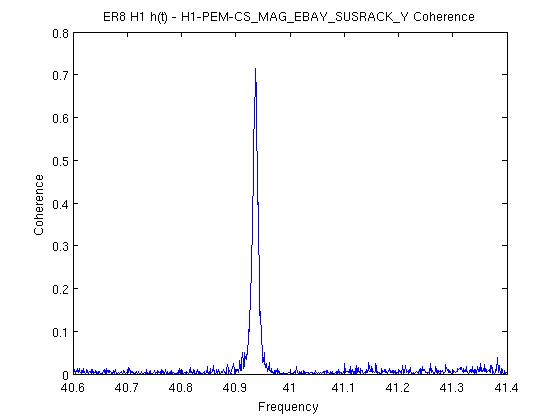
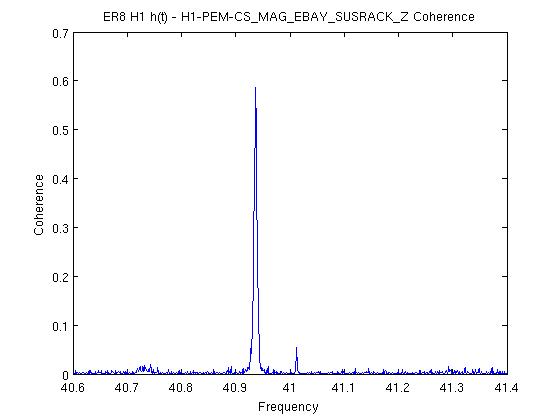
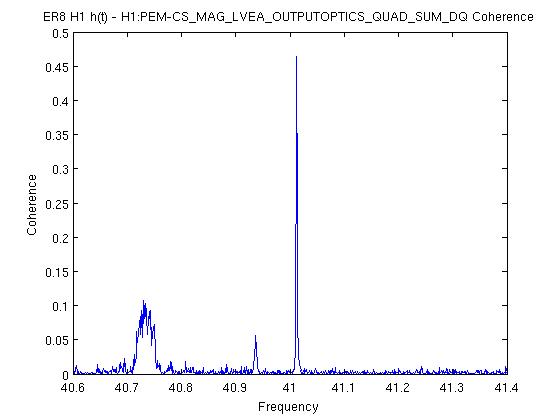
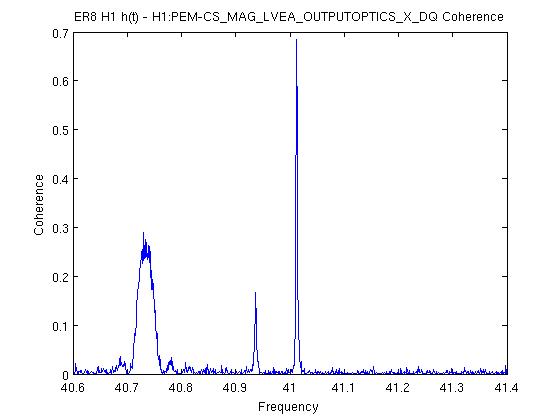
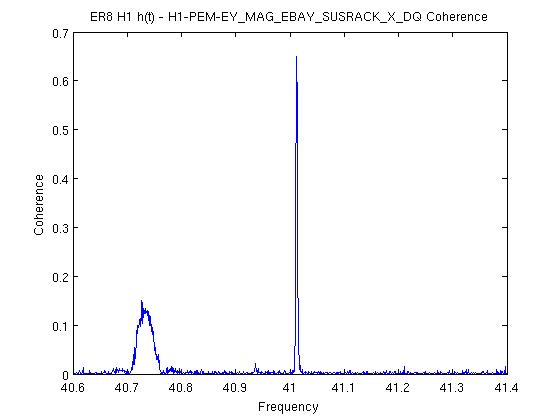
We are looking for the source of the 41 Hz noise lines.
We used the coherence tool results for a week of ER8, with 1 mHz resolution:
https://ldas-jobs.ligo-wa.caltech.edu/~eric.coughlin/ER7/LineSearch/H1_COH_1123891217_1124582417_SHORT_1_webpage/
and as a guide looked at the structure of the 41 Hz noise, as seen in the PSD posted above by Keith.
Michael Coughlin then ran the tool that plots coherence vs channels,
https://ldas-jobs.ligo-wa.caltech.edu/~mcoughlin/LineSearch/bokeh_coh/output/output-pcmesh-40_41.png
and made the following observations

Please see below. I would take a look at the MAGs listed, they only seem to be spiking at these frequencies.
The channels that spike just below 40.95:
 H1:SUS-ETMY_L3_MASTER_OUT_UR_DQ
 H1:SUS-ETMY_L3_MASTER_OUT_UL_DQ
 H1:SUS-ETMY_L3_MASTER_OUT_LR_DQ
 H1:SUS-ETMY_L3_MASTER_OUT_LL_DQ
 H1:SUS-ETMY_L2_NOISEMON_UR_DQ
 H1:SUS-ETMY_L2_NOISEMON_UL_DQ
 H1:PEM-CS_MAG_EBAY_SUSRACK_Z_DQ
 H1:PEM-CS_MAG_EBAY_SUSRACK_Y_DQ
 H1:PEM-CS_MAG_EBAY_SUSRACK_X_DQ

The channels that spike just above 41.0 are:

 H1:SUS-ITMY_L2_NOISEMON_UR_DQ
 H1:SUS-ITMY_L2_NOISEMON_UL_DQ
 H1:SUS-ITMY_L2_NOISEMON_LR_DQ
 H1:SUS-ITMY_L2_NOISEMON_LL_DQ
 H1:SUS-ITMX_L2_NOISEMON_UR_DQ
 H1:SUS-ITMX_L2_NOISEMON_UL_DQ
 H1:SUS-ITMX_L2_NOISEMON_LR_DQ
 H1:SUS-ITMX_L2_NOISEMON_LL_DQ
 H1:SUS-ETMY_L3_MASTER_OUT_UR_DQ
 H1:SUS-ETMY_L3_MASTER_OUT_UL_DQ
 H1:SUS-ETMY_L3_MASTER_OUT_LR_DQ
 H1:SUS-ETMY_L3_MASTER_OUT_LL_DQ
 H1:SUS-ETMY_L2_NOISEMON_UR_DQ
 H1:SUS-ETMY_L2_NOISEMON_UL_DQ
 H1:SUS-ETMY_L2_NOISEMON_LR_DQ
 H1:SUS-ETMY_L2_NOISEMON_LL_DQ
 H1:SUS-ETMY_L1_NOISEMON_UR_DQ
 H1:SUS-ETMY_L1_NOISEMON_UL_DQ
 H1:SUS-ETMY_L1_NOISEMON_LR_DQ
 H1:SUS-ETMY_L1_MASTER_OUT_UR_DQ
 H1:SUS-ETMY_L1_MASTER_OUT_UL_DQ
 H1:SUS-ETMY_L1_MASTER_OUT_LR_DQ
 H1:SUS-ETMY_L1_MASTER_OUT_LL_DQ
 H1:SUS-ETMX_L2_NOISEMON_UR_DQ
 H1:SUS-ETMX_L2_NOISEMON_LL_DQ
 H1:PEM-EY_MAG_EBAY_SUSRACK_Z_DQ
 H1:PEM-EY_MAG_EBAY_SUSRACK_Y_DQ
 H1:PEM-EY_MAG_EBAY_SUSRACK_X_DQ
 H1:PEM-CS_MAG_LVEA_OUTPUTOPTICS
 H1:PEM-CS_MAG_LVEA_OUTPUTOPTICS_QUAD_SUM_DQ

The magnetometers do show coherence at the two spikes seen in Keith's plot. The SUS channels are also showing coherence at these frequencies, sometimes broad in structure, sometimes narrow. See the coherence plots below.

Nelson, Michael Coughlin, Eric Coughlin, Pat Meyers
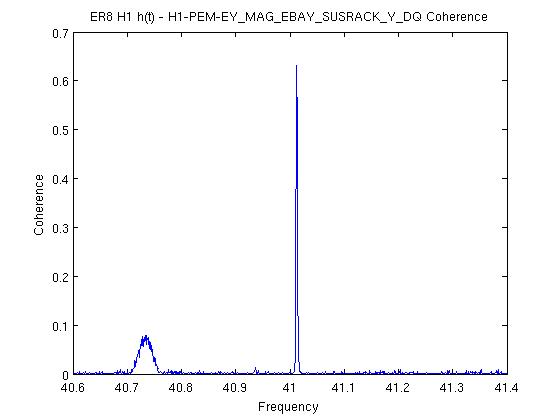
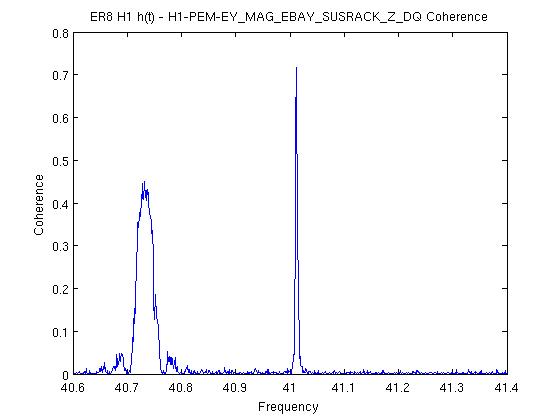
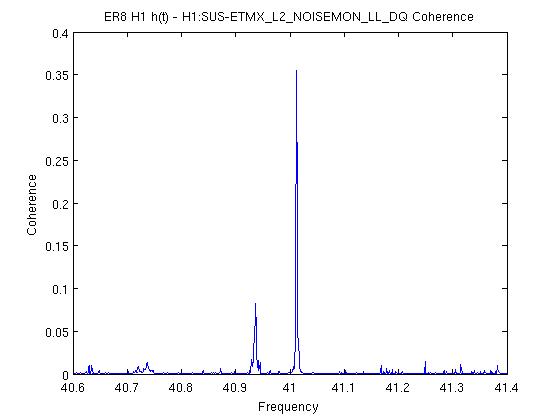
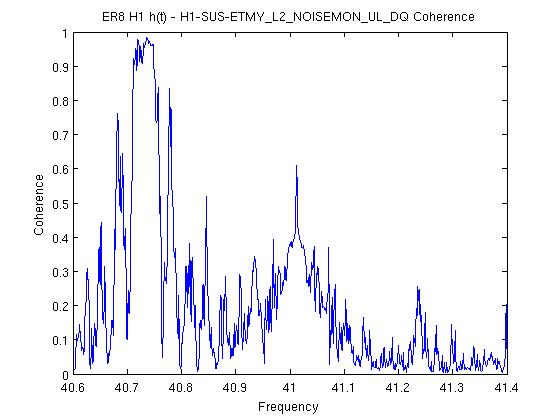
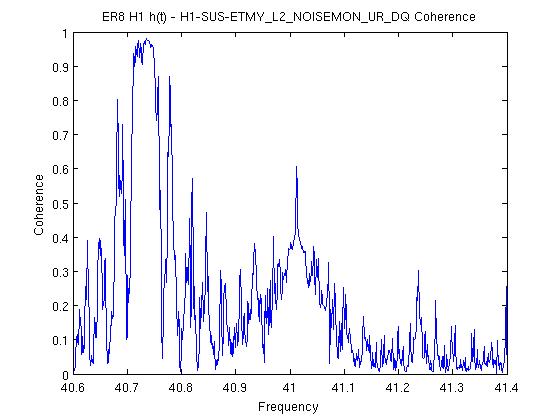

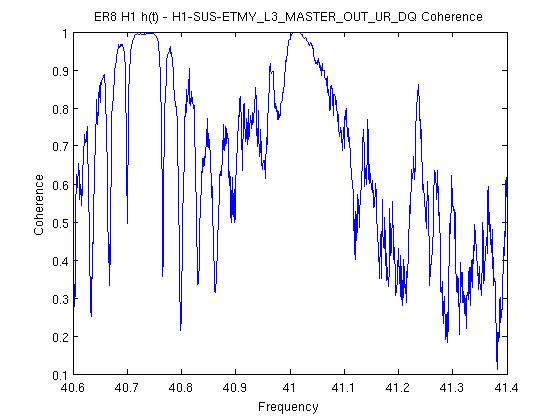
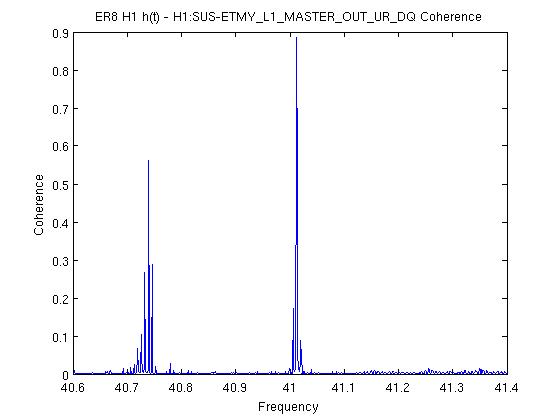
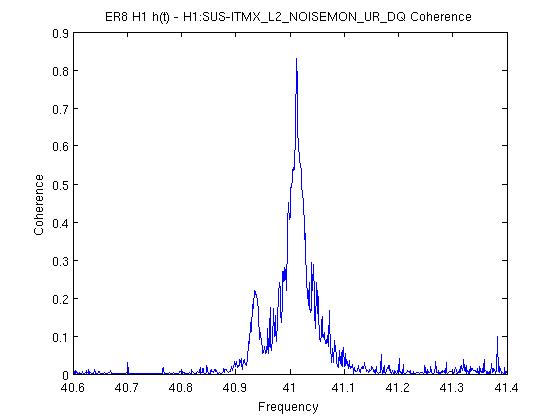
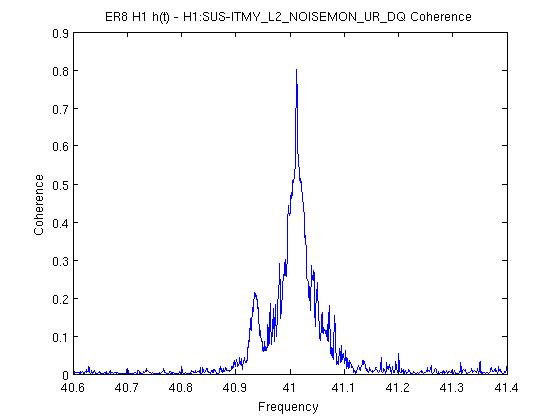
Nelson, et. al

Interesting list of channels. Though they seem scattered, I can imagine a scenario where the SRM's highest roll mode frequency is still the culprit.

All of the following channels you list are the drive signals for DARM. We're currently feeding back the DARM signal to only ETMY. So, any signal your see in the calibrated performance of the instrument, you will see here -- they are part of the DARM loop.
 H1:SUS-ETMY_L3_MASTER_OUT_UR_DQ
 H1:SUS-ETMY_L3_MASTER_OUT_UL_DQ
 H1:SUS-ETMY_L3_MASTER_OUT_LR_DQ
 H1:SUS-ETMY_L3_MASTER_OUT_LL_DQ
 H1:SUS-ETMY_L2_NOISEMON_UR_DQ
 H1:SUS-ETMY_L2_NOISEMON_UL_DQ
 H1:SUS-ETMY_L2_NOISEMON_LR_DQ
 H1:SUS-ETMY_L2_NOISEMON_LL_DQ
 H1:SUS-ETMY_L1_NOISEMON_UR_DQ
 H1:SUS-ETMY_L1_NOISEMON_UL_DQ
 H1:SUS-ETMY_L1_NOISEMON_LR_DQ
 H1:SUS-ETMY_L1_MASTER_OUT_UR_DQ
 H1:SUS-ETMY_L1_MASTER_OUT_UL_DQ
 H1:SUS-ETMY_L1_MASTER_OUT_LR_DQ
 H1:SUS-ETMY_L1_MASTER_OUT_LL_DQ

Further -- though we'd have to test this theory by measuring the coherence between, say the NoiseMon channels and these SUS rack magnetometers, I suspect these magnetometers are just sensing the requested DARM drive control signal
 H1:PEM-EY_MAG_EBAY_SUSRACK_Z_DQ
 H1:PEM-EY_MAG_EBAY_SUSRACK_Y_DQ
 H1:PEM-EY_MAG_EBAY_SUSRACK_X_DQ

Now comes the harder part. Why the are ITMs and corner station magnetometers firing off? The answer: SRCL feed-forward / subtraction from DARM and perhaps even angular control signals. Recall that the QUAD's electronics chains are identical, in construction and probably in emission of magnetic radiation.
 H1:PEM-CS_MAG_EBAY_SUSRACK_Z_DQ
 H1:PEM-CS_MAG_EBAY_SUSRACK_Y_DQ
 H1:PEM-CS_MAG_EBAY_SUSRACK_X_DQ
sound like they're in the same location for the ITMs as the EY magnetometer for the ETMs. We push SRCL feed-forward to the ITMs, and SRM is involved in SRCL, and also there is residual SRCL to DARM coupling left-over from the imperfect subtraction. That undoubtedly means that the ~41 [Hz] mode of the SRM will show up in DARM, SRCL, the ETMs and the ITMs. Also, since the error signal / IFO light for the arm cavity (DARM, CARM -- SOFT and HARD) angular control DOFs have to pass through HSTSs as they come out of the IFO (namely SRM and SR2 -- the same SUS involved in SRCL motion), they're also potentially exposed to this HSTS resonance. We feed arm cavity ASC control signal to all four test masses.

That would also explain why the coil driver monitor signals show up on your list:
 H1:SUS-ITMY_L2_NOISEMON_UR_DQ
 H1:SUS-ITMY_L2_NOISEMON_UL_DQ
 H1:SUS-ITMY_L2_NOISEMON_LR_DQ
 H1:SUS-ITMY_L2_NOISEMON_LL_DQ
 H1:SUS-ITMX_L2_NOISEMON_UR_DQ
 H1:SUS-ITMX_L2_NOISEMON_UL_DQ
 H1:SUS-ITMX_L2_NOISEMON_LR_DQ
 H1:SUS-ITMX_L2_NOISEMON_LL_DQ

The 41 Hz showing up in
 H1:SUS-ETMX_L2_NOISEMON_UR_DQ
 H1:SUS-ETMX_L2_NOISEMON_LL_DQ
(and not in the L3 or L1 stage) also is supported by the ASC control signal theory -- we only feed ASC to the L2 stage, and there is no LSC (i.e. DARM) request to ETMX (which we *would* spread among the three L3, L2, and L1 stages.). Also note that there's a whole integration issue about how these noise monitor signals are untrustworthy (see Integration Issue #9), and the ETMX noise mons have not been cleared as "OK," and in fact have been called out explicitly for their suspicious behavior in LHO aLOG 17890

I'm not sure where this magnetometer lives:
 H1:PEM-CS_MAG_LVEA_OUTPUTOPTICS
 H1:PEM-CS_MAG_LVEA_OUTPUTOPTICS_QUAD_SUM_DQ
but it's clear from the channel names that these is just two different versions of the same magnetometer.

I'm surprised that other calibrated LSC channels like
H1:CAL-CS_PRCL_DQ
H1:CAL-CS_PRCL_DQ
H1:CAL-CS_PRCL_DQ
don't show up on your list. I'm staring at the running ASD of these channels on the wall and there's a line at 41 [Hz] that in both the reference trace and the current live trace (though, because PRCL, SRCL, and MICH all light that bounces off of HSTSs, I suspect that you might find slightly different frequencies in each).

"I see your blind list of channels that couple, and raise you a plausible coupling mechanism that explains them all. How good is your hand?!"
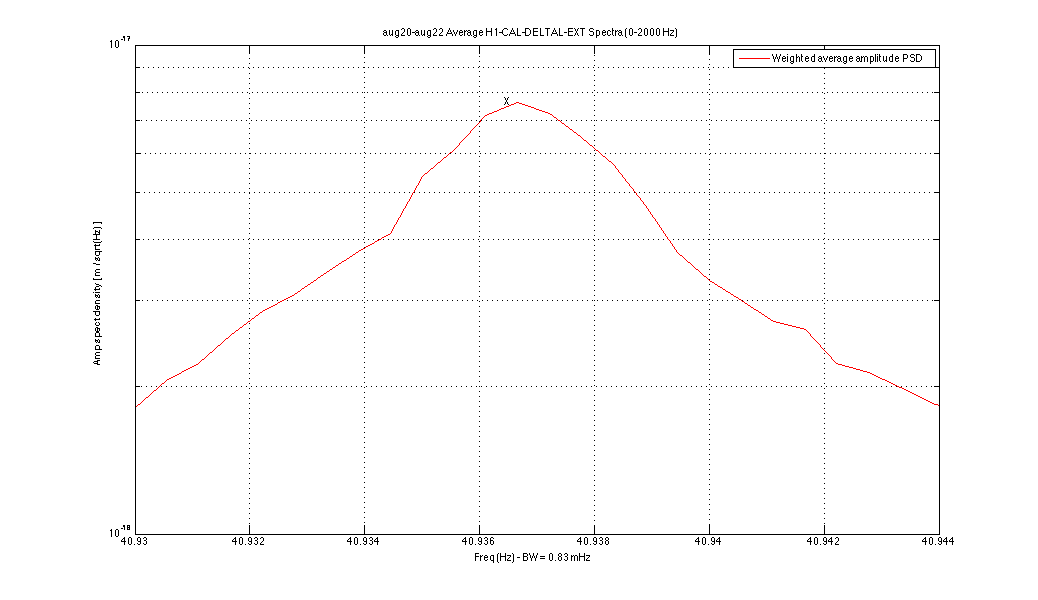
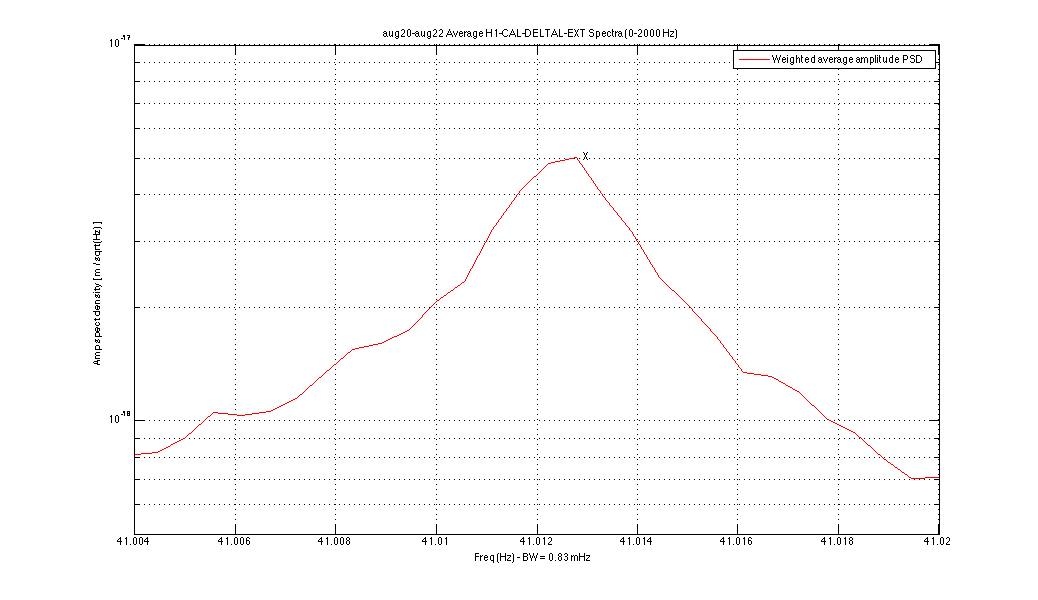
I neglected to state explicitly that the spectra I posted are taken
from non-overlapped Hann-windowed 30-minute SFTs,
hence with bins 0.5556 mHz wide and BW of about 0.83 mHz.
Attached are close-in zooms of  the bands around 41 Hz peaks,
from the ER8 50-hour data integration, allowing an estimate of
their Q's (request from Peter F).

For the peak at about 40.9365 Hz, one has:
FWHM ~ 0.0057 Hz
-> Q = 40.94/.0057 = 7,200

For the peak at about 41.0127 Hz, one has:
FWHM ~ 0.0035 Hz
-> Q = 41.01/0.0035 = 12,000

Also attached are zooms and close-in zooms for the peak at 41.9365 Hz
from 145 hours of ER7 data when the noise floor and the peak were
both higher. The 41.0127-Hz peak is not visible in this data set integration.

In the ER7 data set, one has for 41.9365 Hz:
FWHM ~  0.0049 Hz
-> Q = 40.94/0.0049 = 8,400

Peter expected Q's as high as 4000-5000 and no lower than 2000 for
a triplet suspension. These numbers are high enough to qualify.
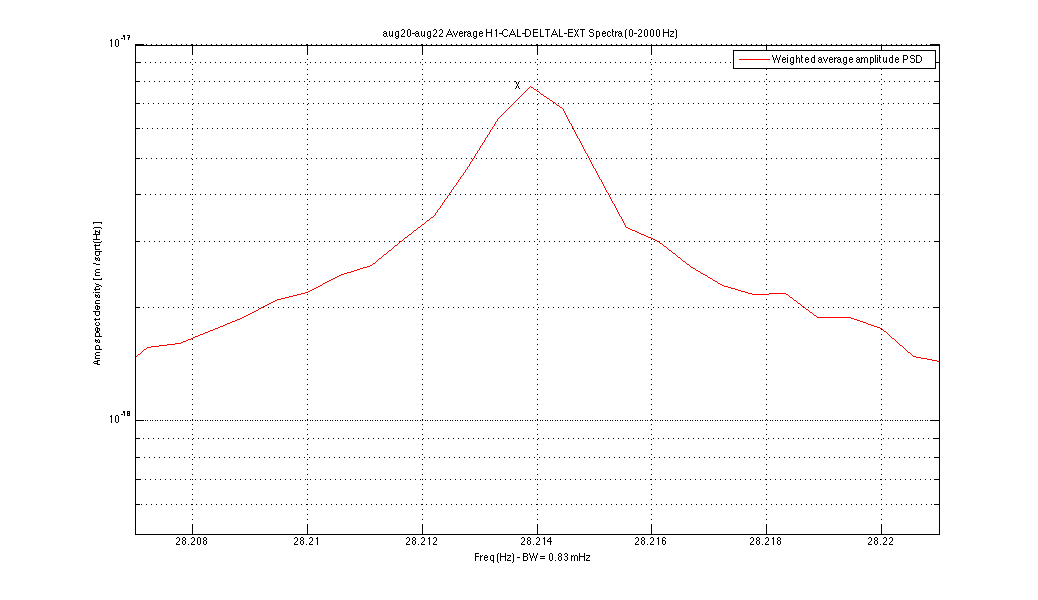
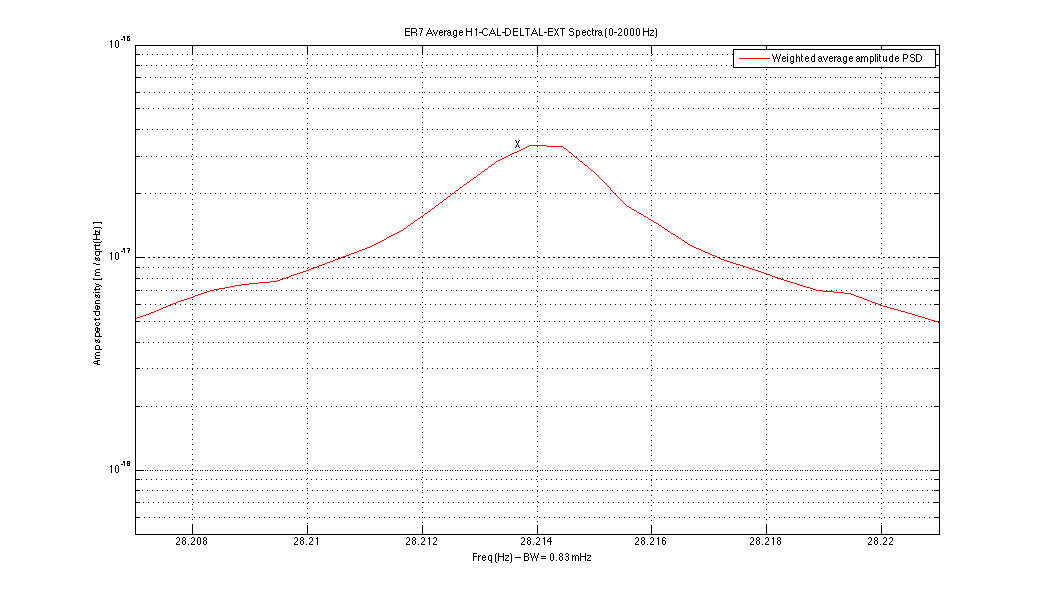
Andy Lundgren pointed out that there is a line at about 28.2 Hz that
might be close enough to 40.9365/sqrt(2) = 28.95 Hz to qualify as
the bounce-mode counterpart to the suspected roll mode.

So I've checked its Q in the 50-hour ER8 set and the 145-hour ER7 set
and am starting to think Andy's suspicion is correct (see attached spectra).
I get Q's of about 9400 for ER and 8600 for ER7, where the line in
ER7 is much higher than in ER8, mimicking what is seen at 41 Hz.
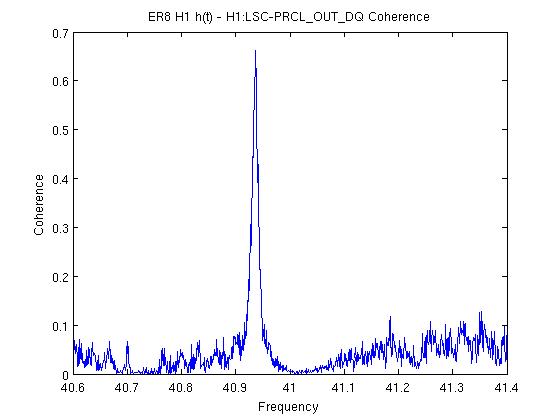
In an email Gabriele Vajente has stated, "...the noise might be correlated to PRCL." There is a coherence spike between h(t) and H1:LSC-PRCL_OUT_DQ at 40.936 Hz. Here is the coherence for a week in ER8.
Peter F asked if Q of ~ 10,000 for bounce and roll modes was plausible.

Answer is yes. We have evidence that the material loss can at least a factor of 2 better than 2e-4 - e.g. see our paper (due to be published soon in Rev Sci Instrum,) P1400229, where we got an average 1.1 x 10^-4 loss for music wire. Q = 1/loss.
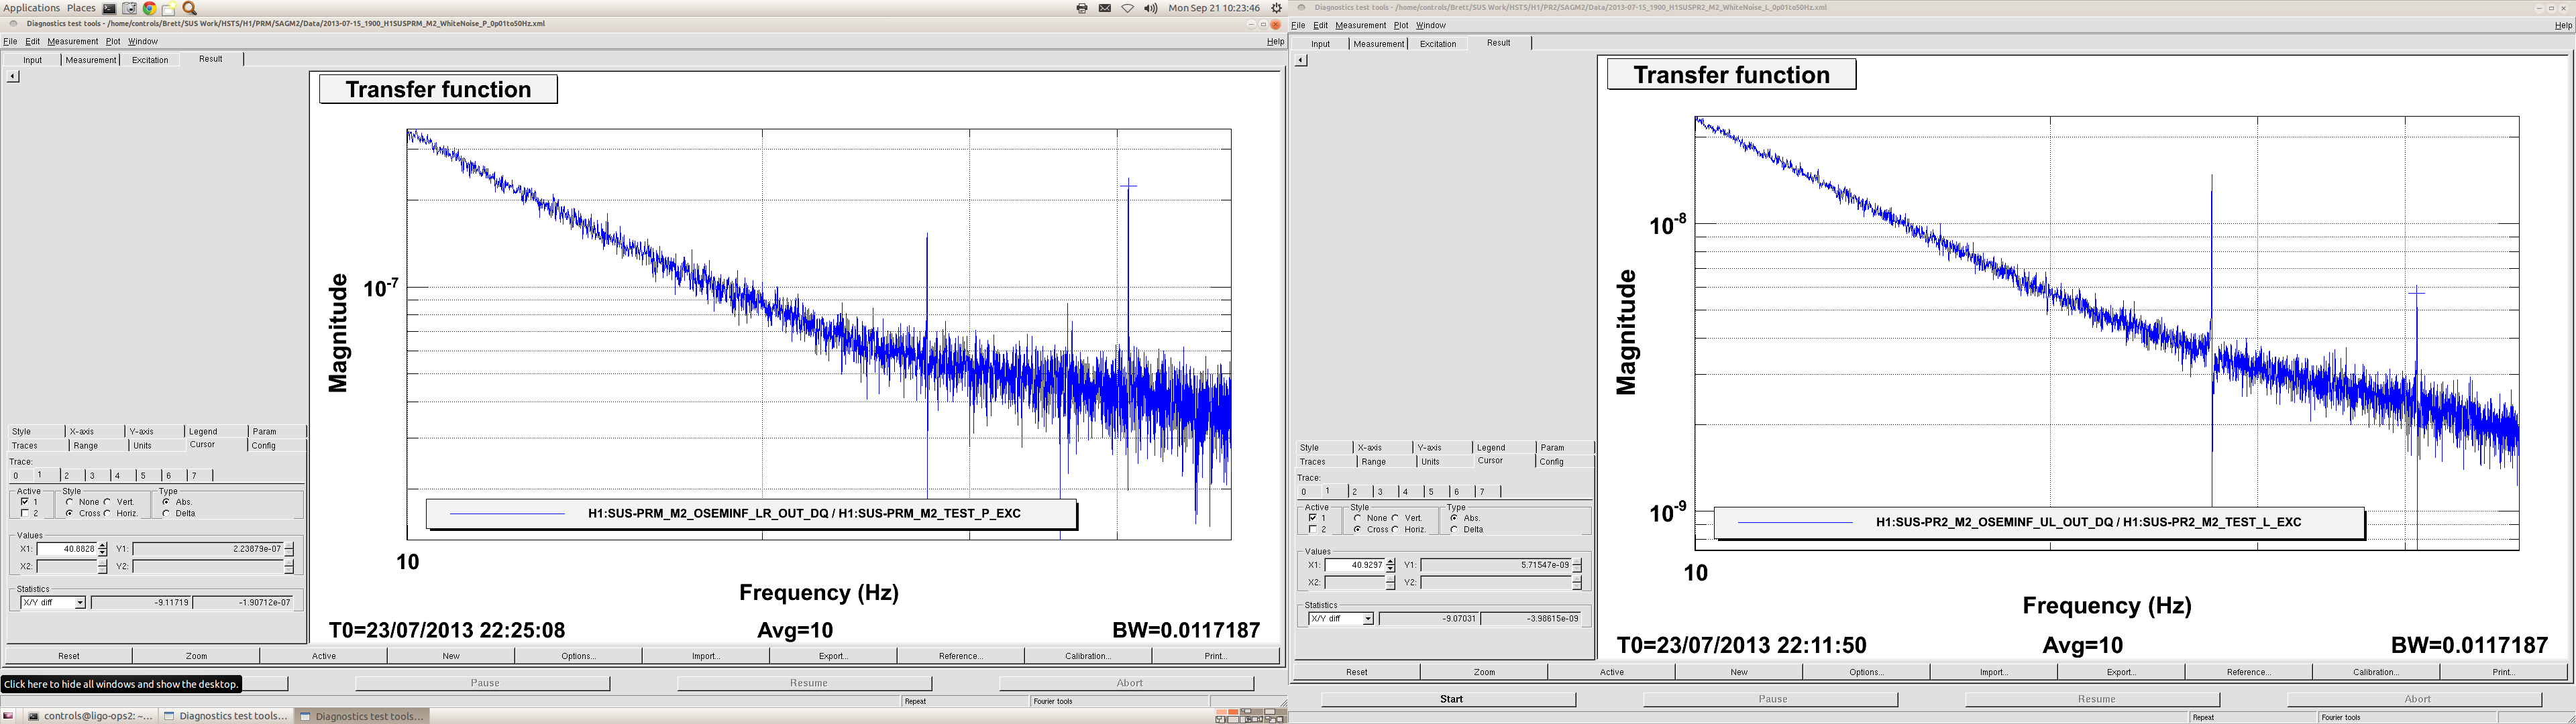
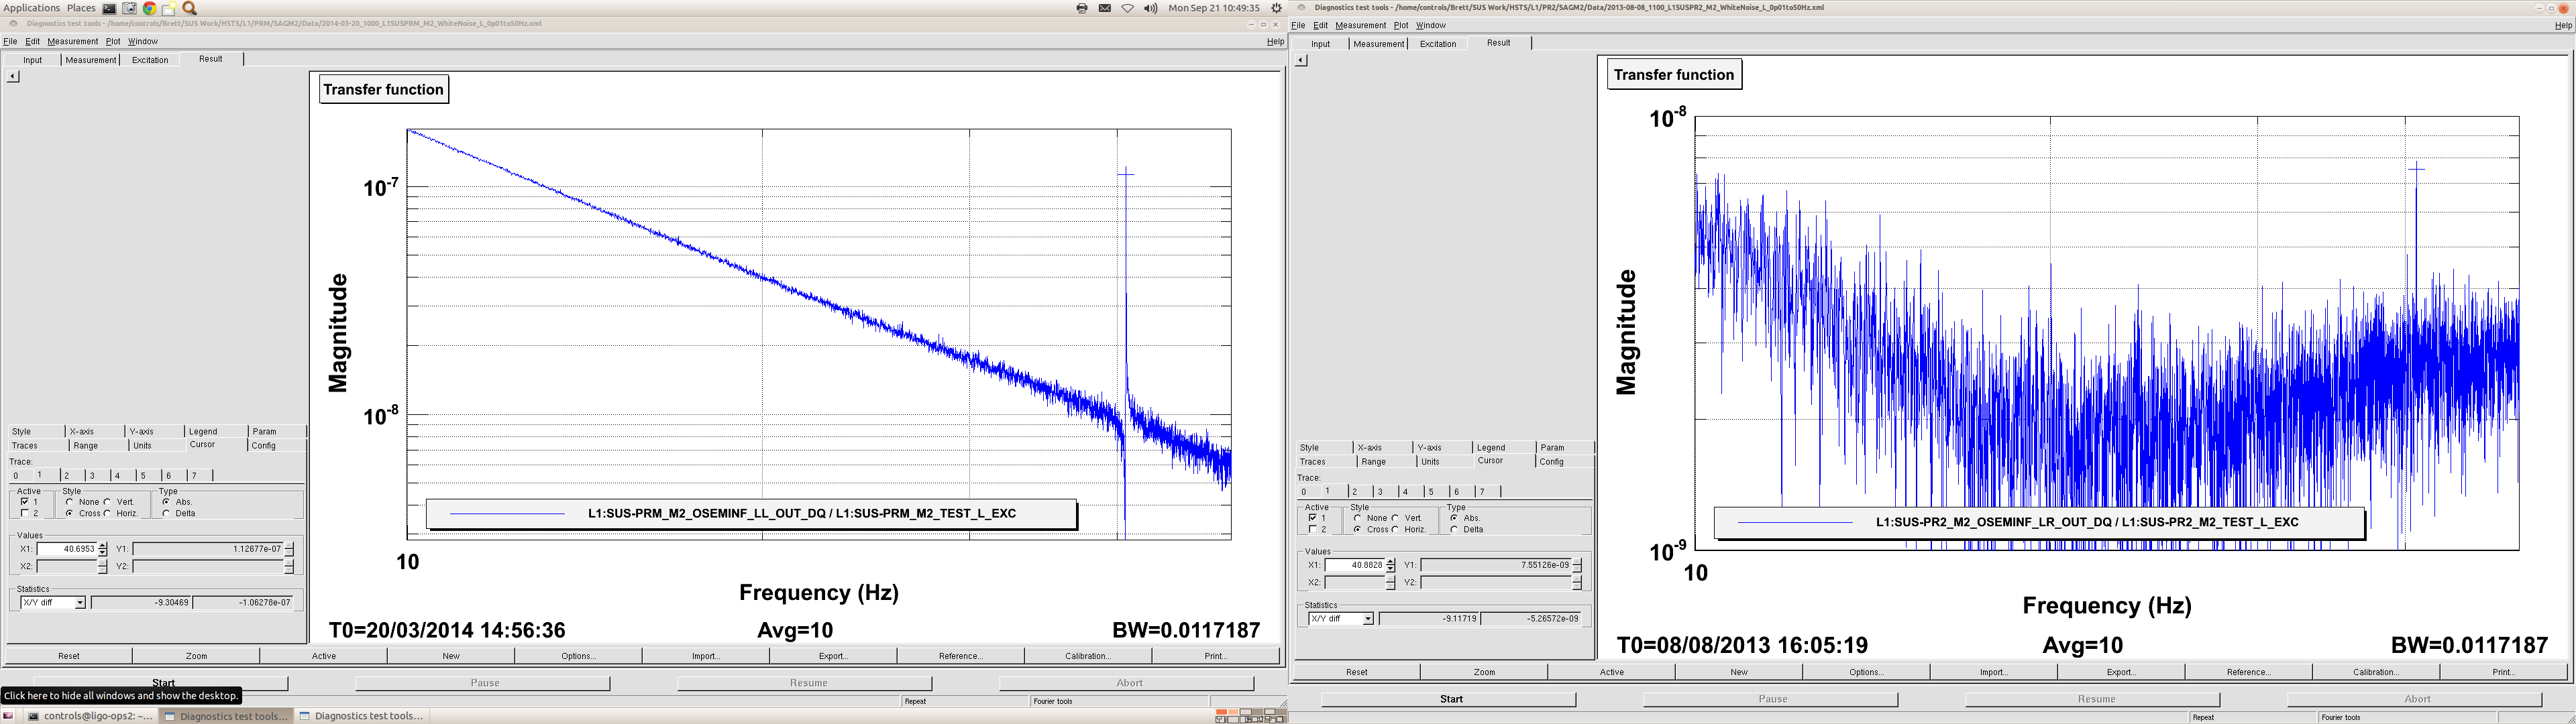
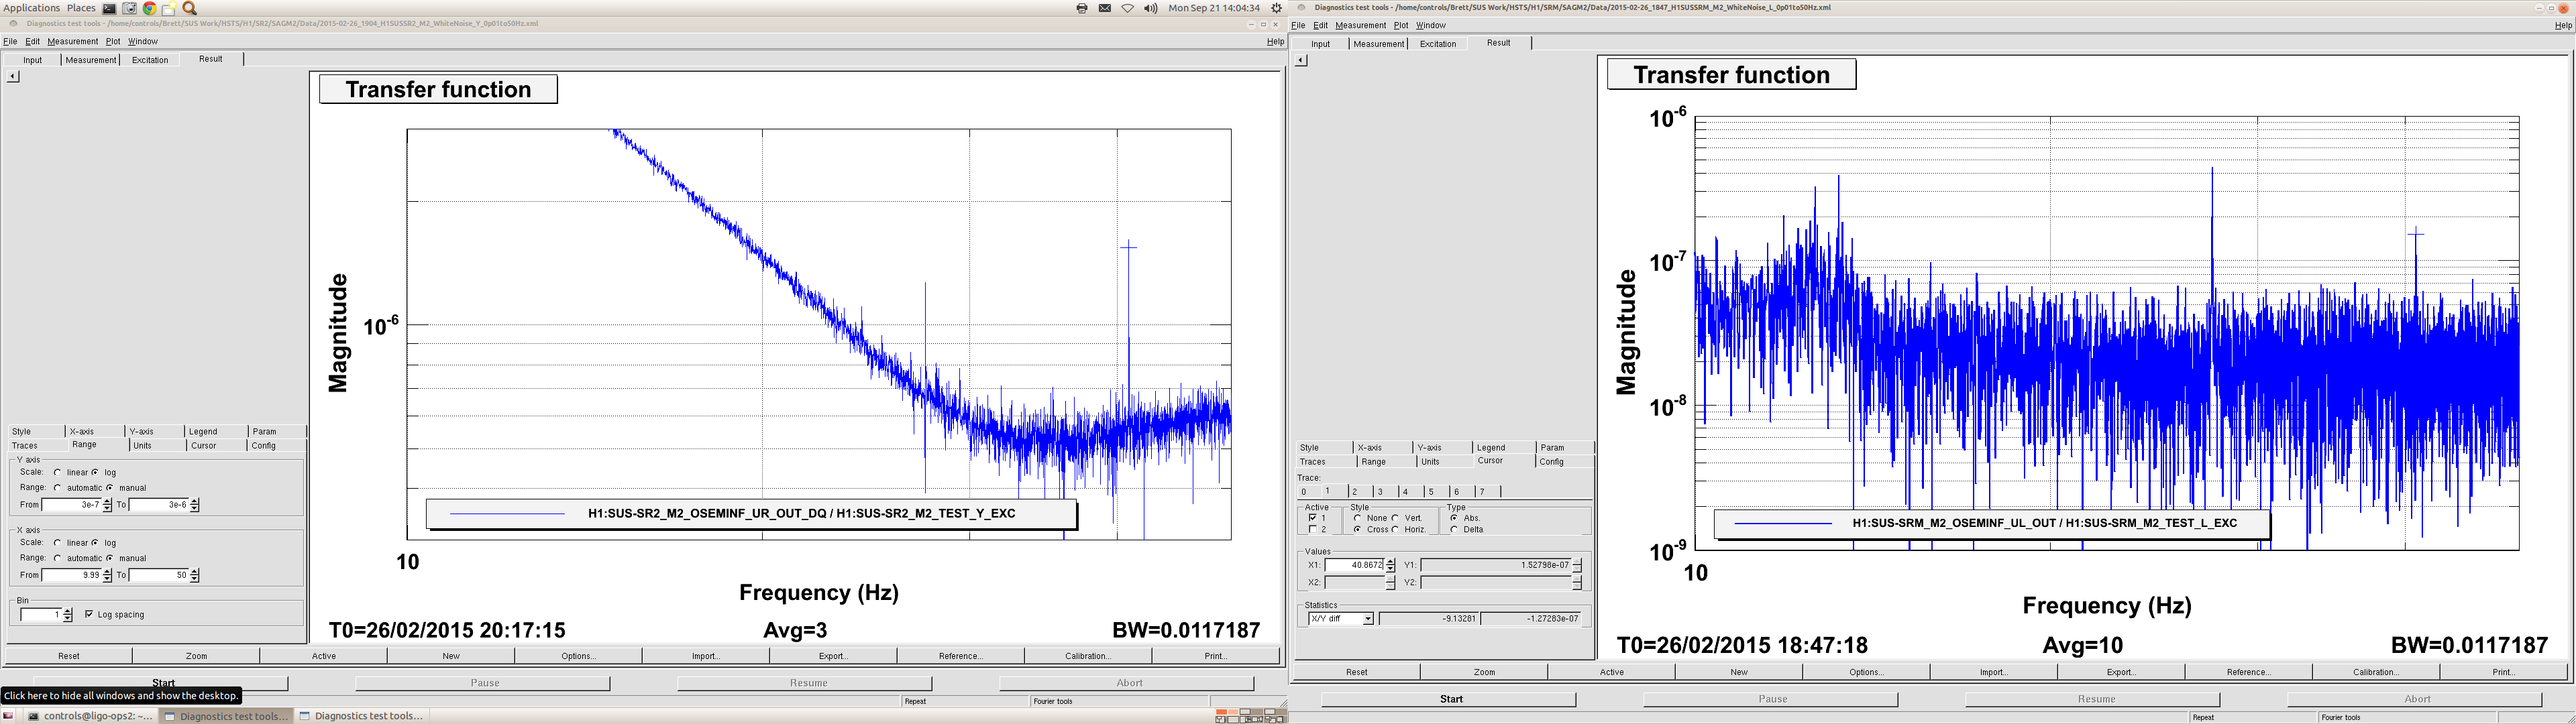
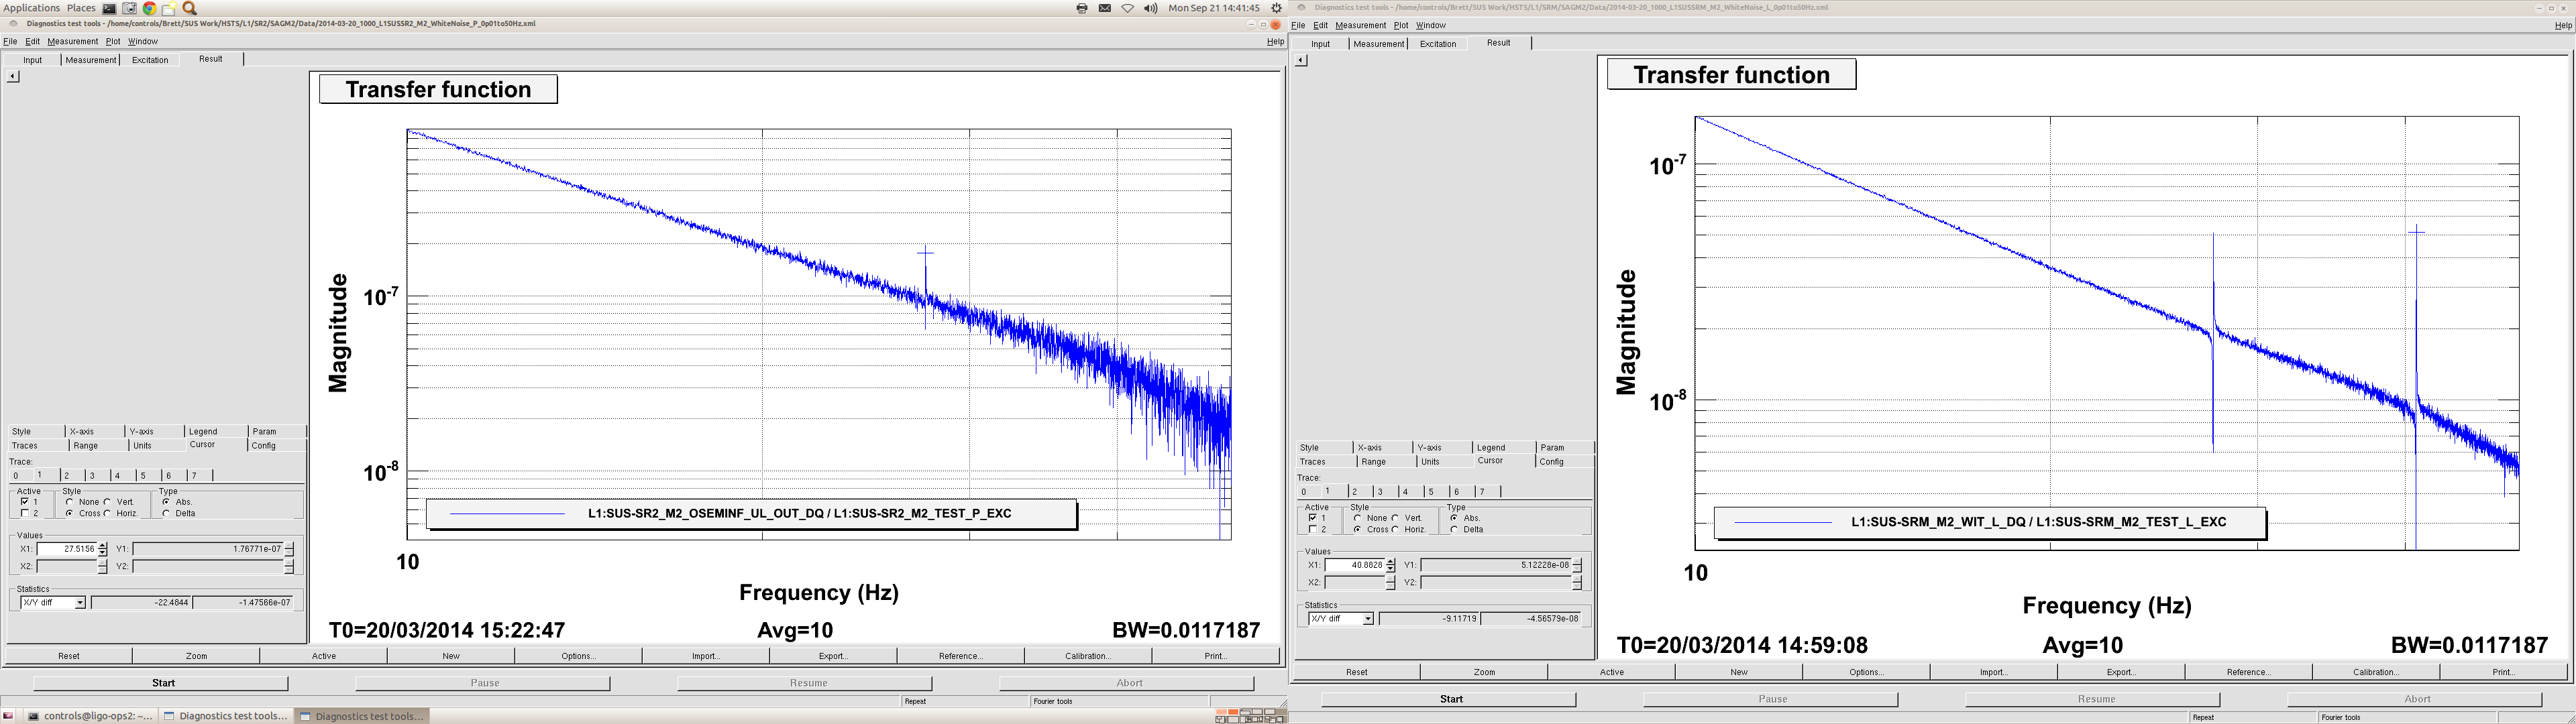
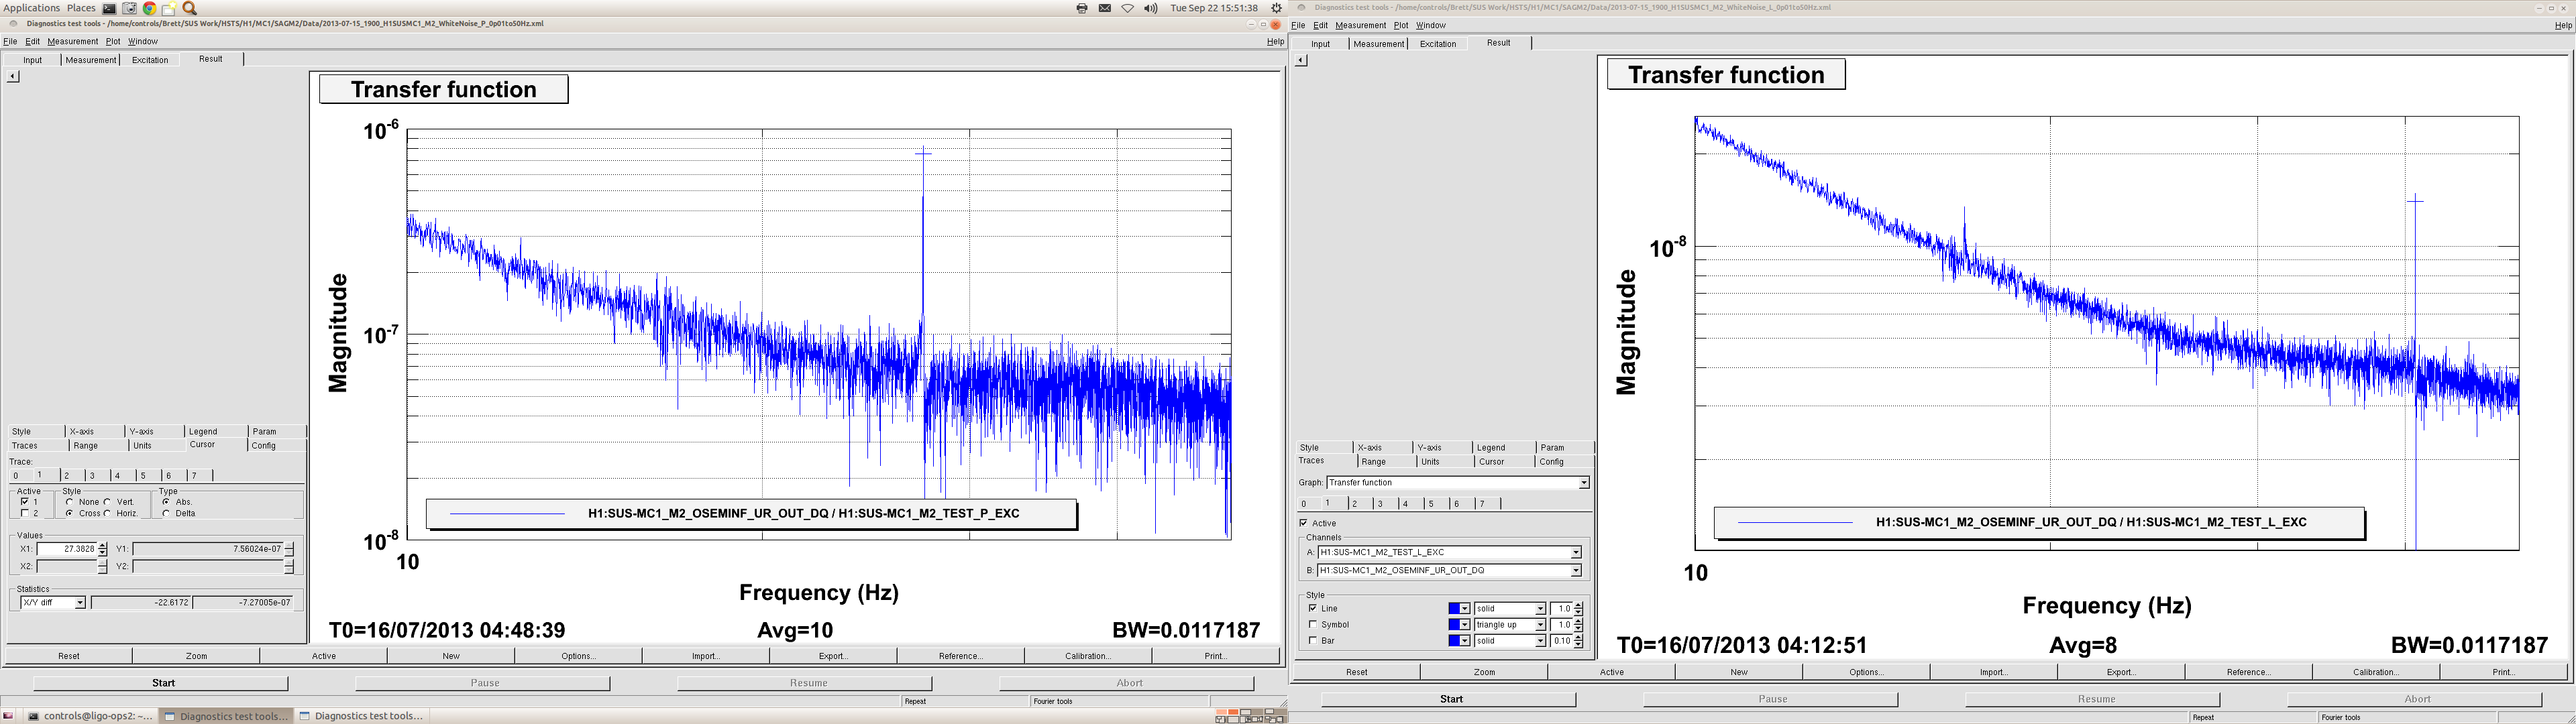
[Stuart A, Jeff K, Norna R]

After having looked through acceptance measurements, taken in-chamber (Phase 3), for all H1 HSTSs, it should be noted that our focus was on the lower frequency modes of the suspensions, so we have little data to refine the estimates of the individual mode frequencies for each suspension.

No vertical (modeV3 at ~27.3201 Hz) or roll (modeR3 at ~40.369 Hz) modes are present in the M1-M1 (top-to-top) stage TFs of the suspensions.

Some hints of modes can be observed in M2-M2 and M3-3 TFs (see attached below), as follows:-

1) M2-M2, all DOFs suffer from poor coherence above 20 Hz. However, there are some high Q features that stand out in the L DOF for SRM, at frequencies of 27.46 Hz and 40.88 Hz. In Pitch, there is a high Q feature at 27.38 Hz for PR2. In Yaw, a feature at 40.81 Hz is just visible for MC1.

2) M3-M3, again all DOFs suffer very poor coherence above 20 Hz. However, a feature can be seen standing above the noise at 26.7 Hz for MC2 in the L DOF. Also, a small peak is present at 40.92 Hz for SR2 in the Yaw DOF.
We currently don't have any bandstops for these modes on the tripples, except for in the top stage length path to SRM and PRM. It would not impact our ASC loops to add bandstops to the P+Y input on all triples. We will do this next time we have a chance to put some changes in.
Ryan Derosa mentioned that he took some low resolution measurements that include an L1 SR2 roll mode at 41.0 Hz.
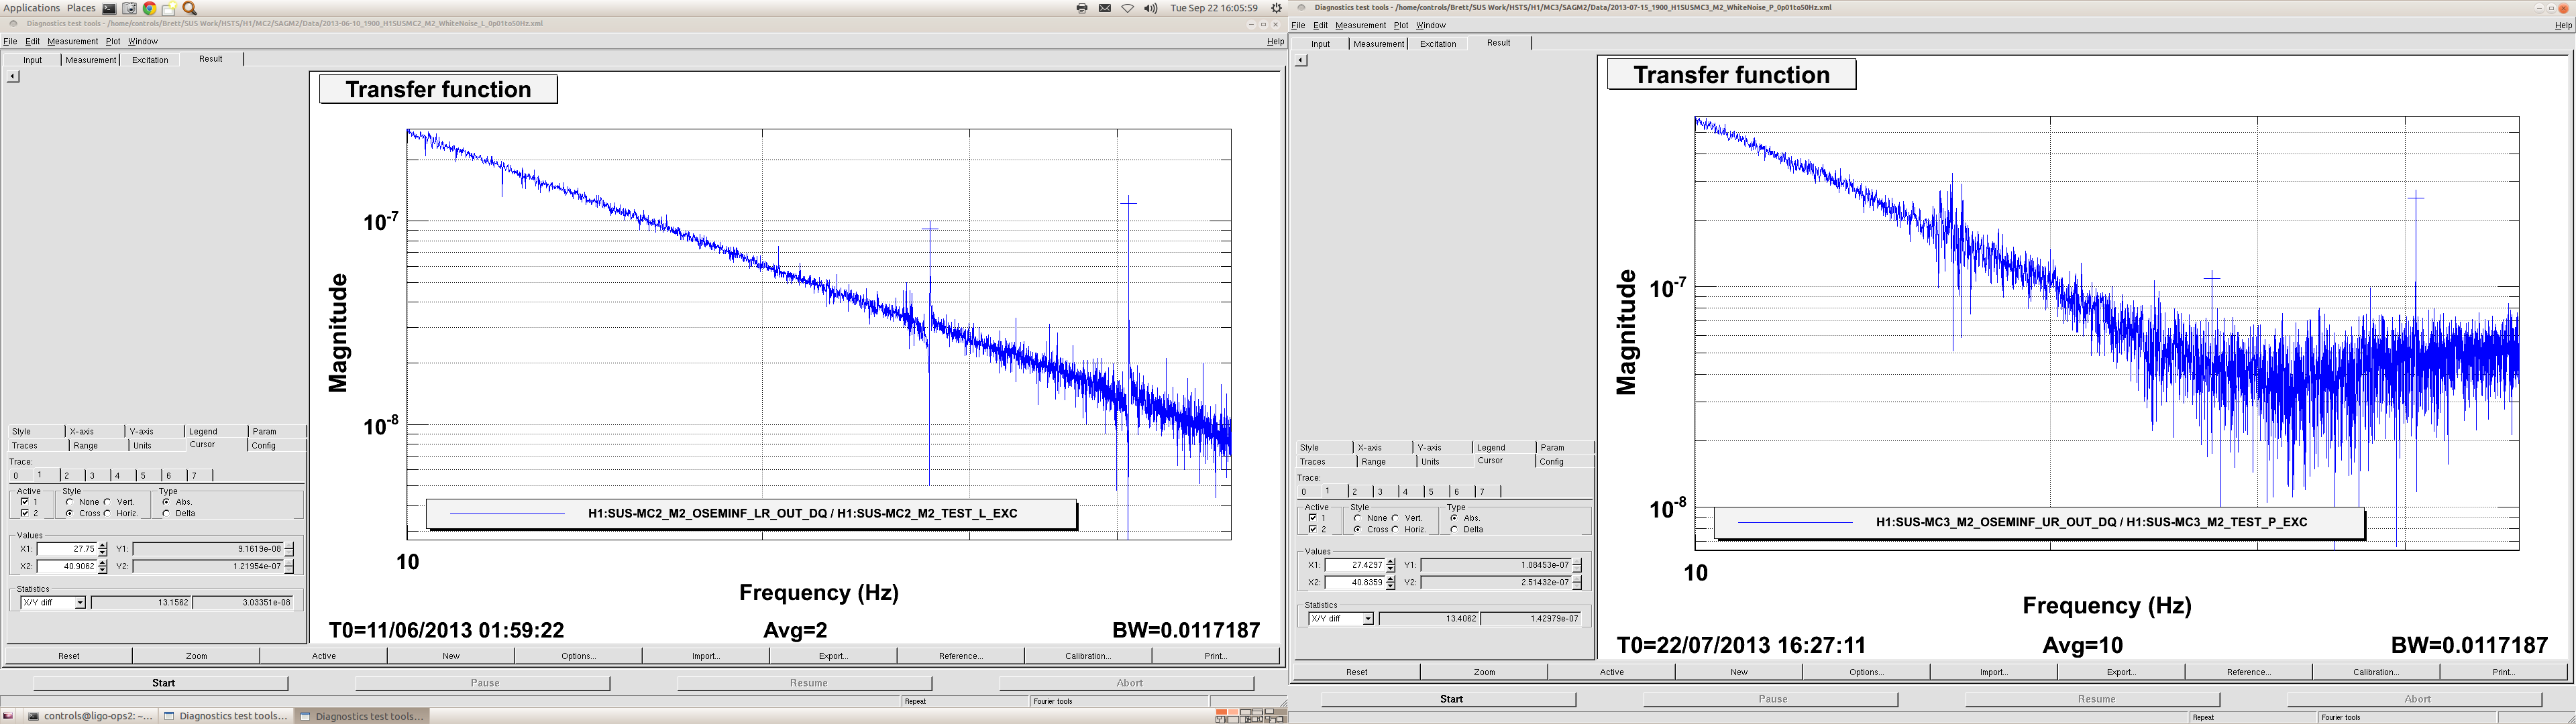
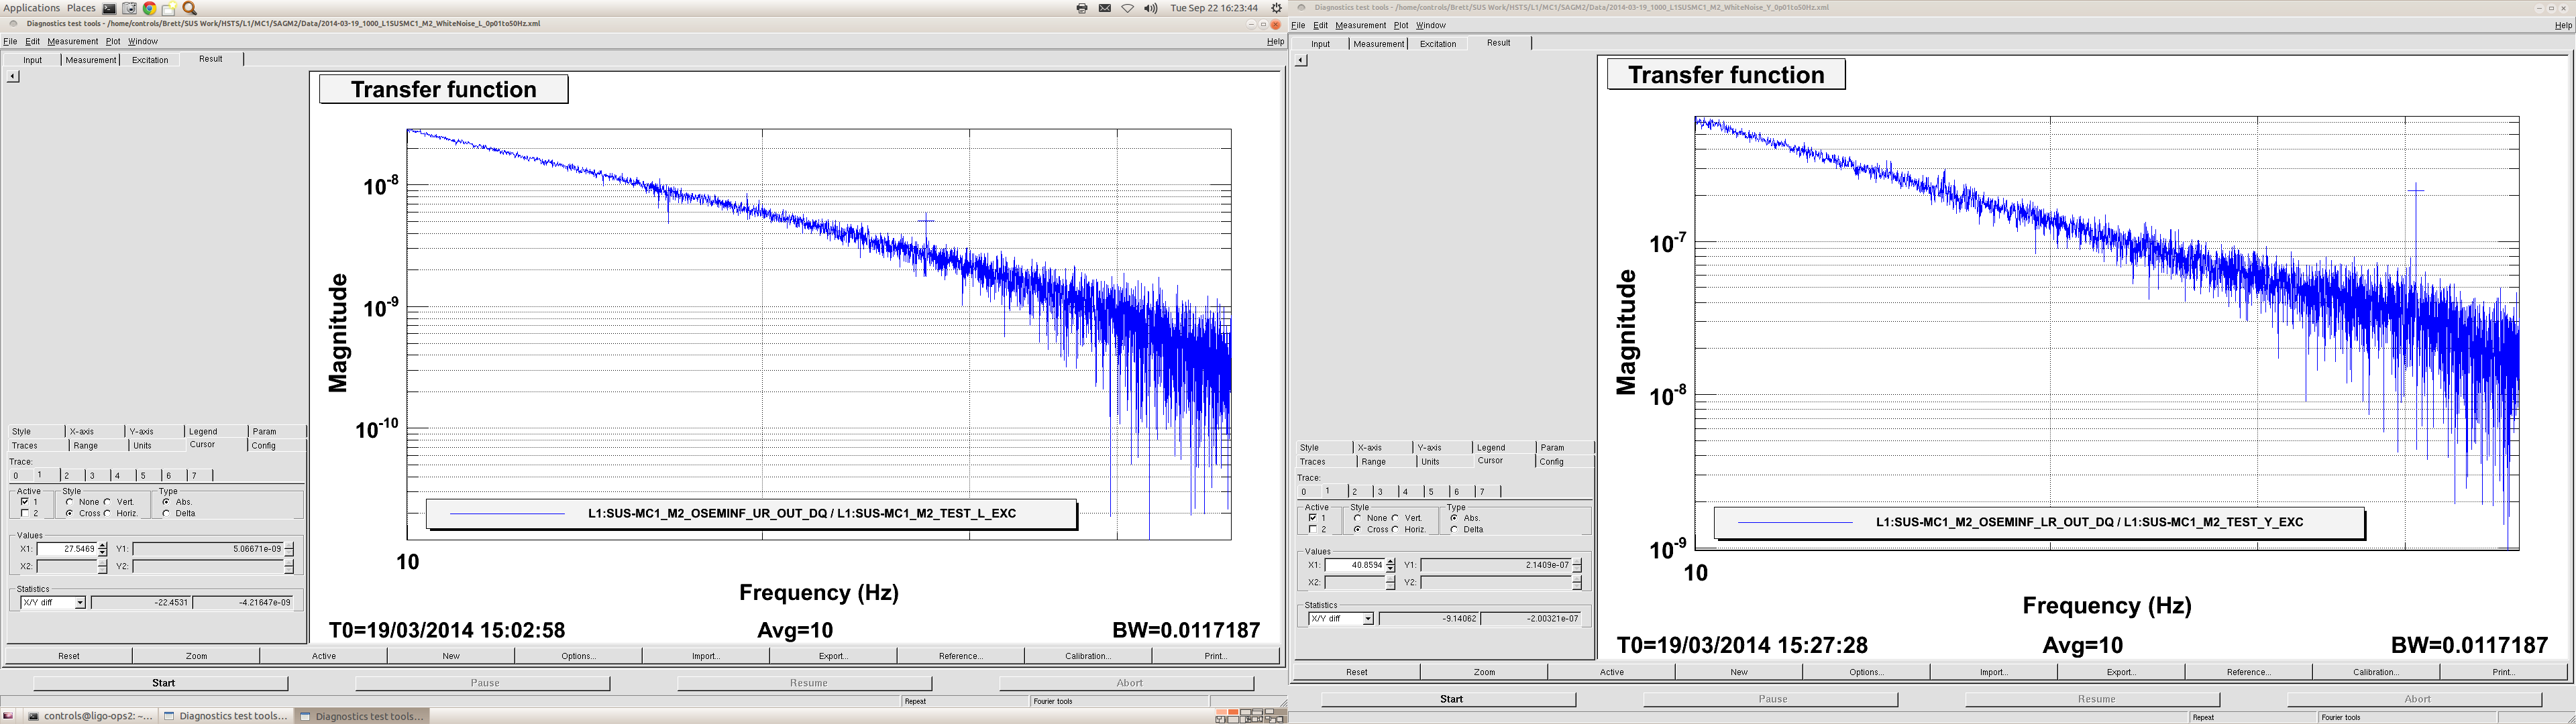
I have now looked at the data for all the MCs, to complement the PRs and SRs above in log 21741. Screenshots of the data are attached, a list of the modes found are below.
H1
SUS bounce (Hz) roll (Hz)
MC1 27.38 40.81
MC2 27.75 40.91
MC3 27.43? 40.84
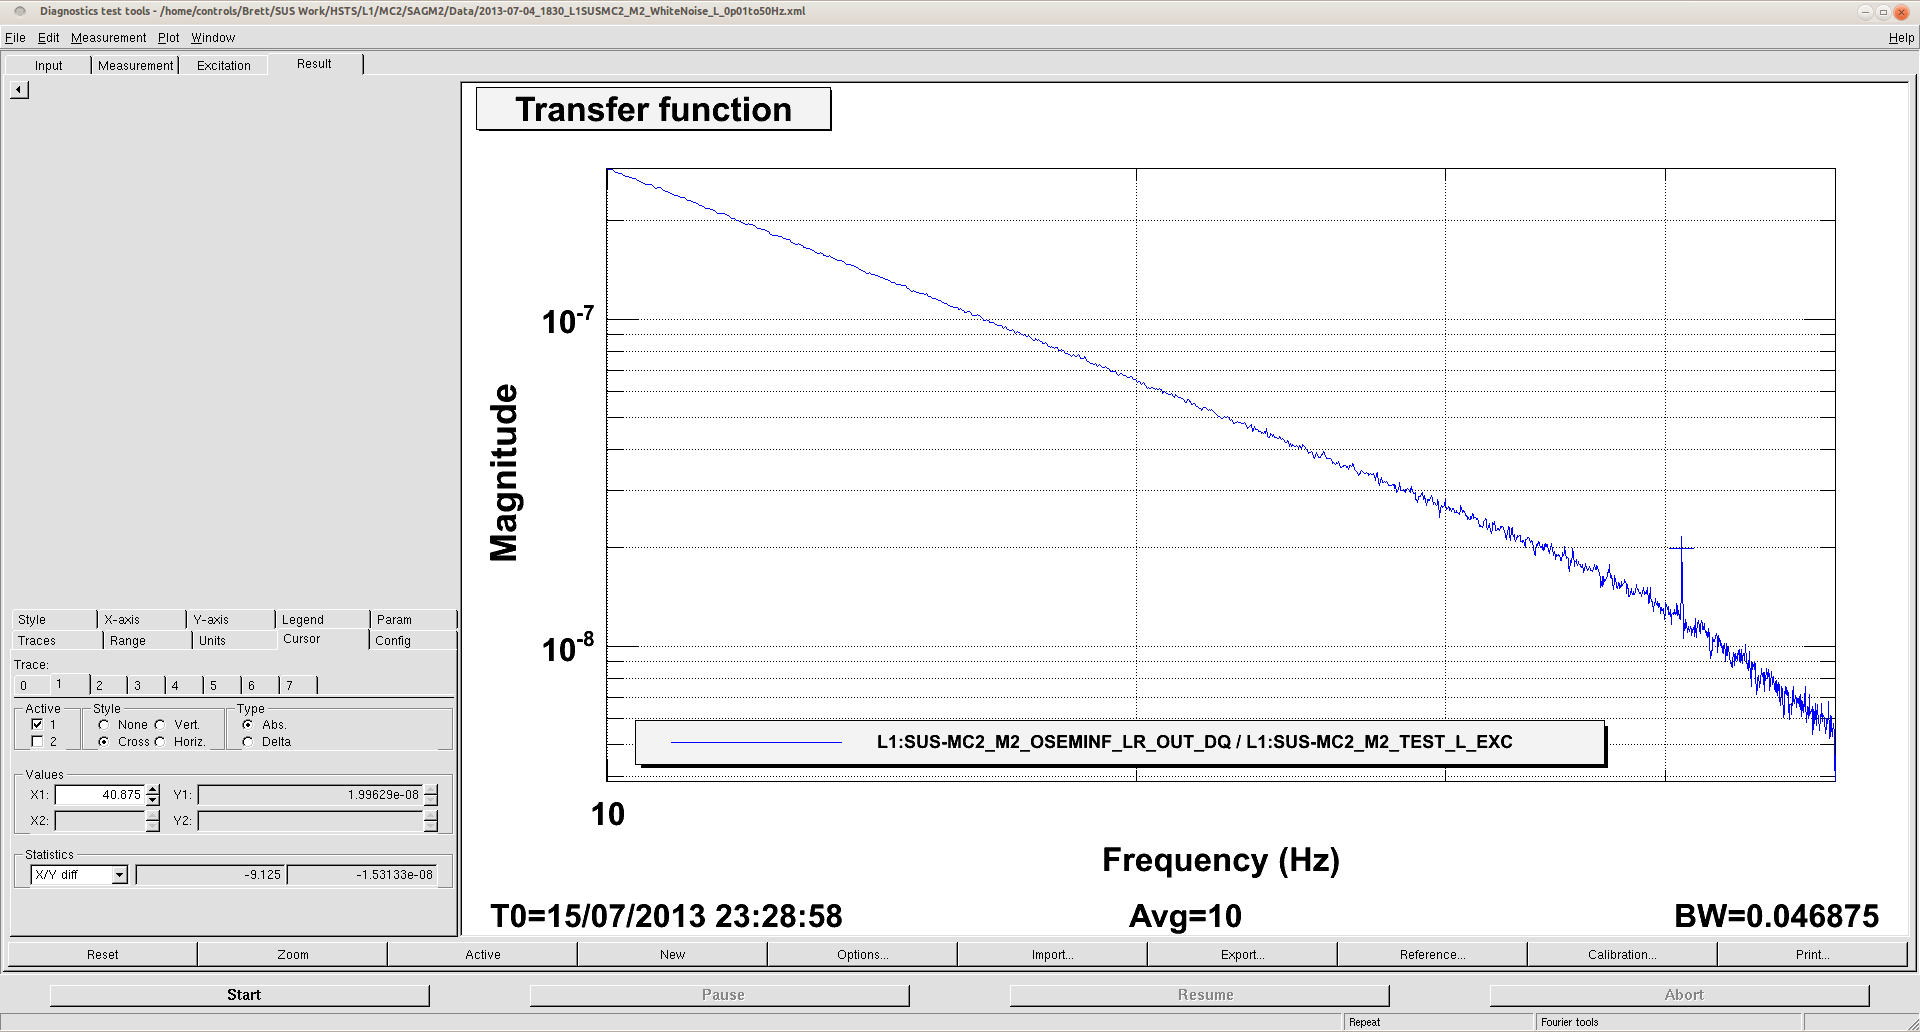
L1
SUS bounce (Hz) roll (Hz)
MC1 27.55? 40.86
MC2 --- 40.875
MC3 27.53 40.77
Error bars of +- 0.01 Hz.
I am not sure about the bounce modes for H1 MC3 and L1 MC1 since the peaks are pretty small. I couldn't find any data on L1 MC2 showing a bounce mode.
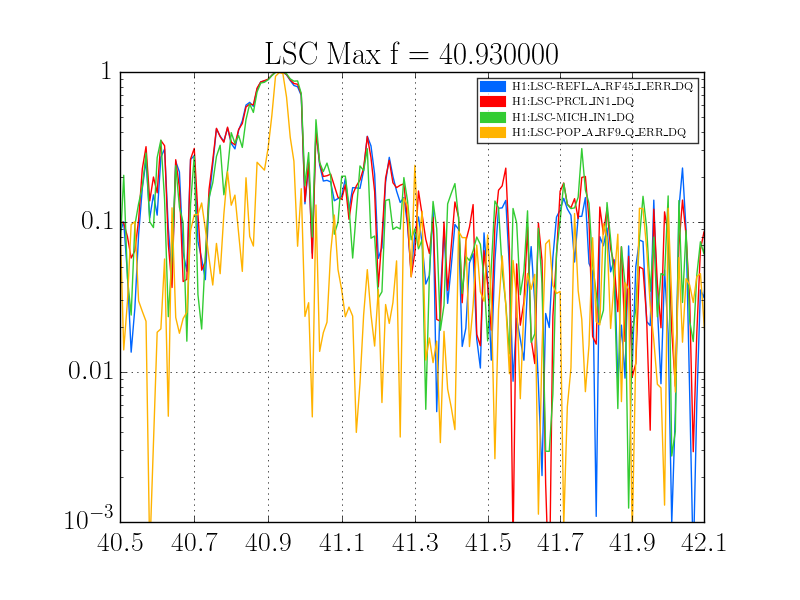
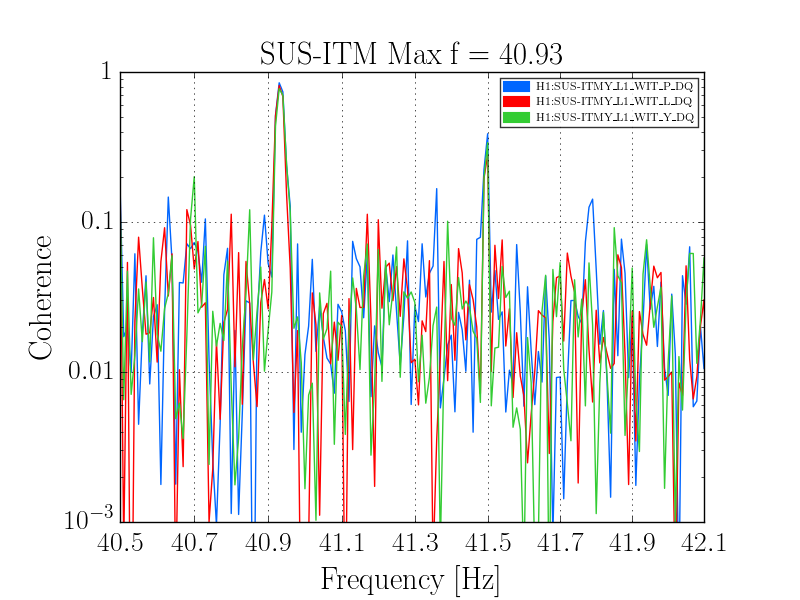
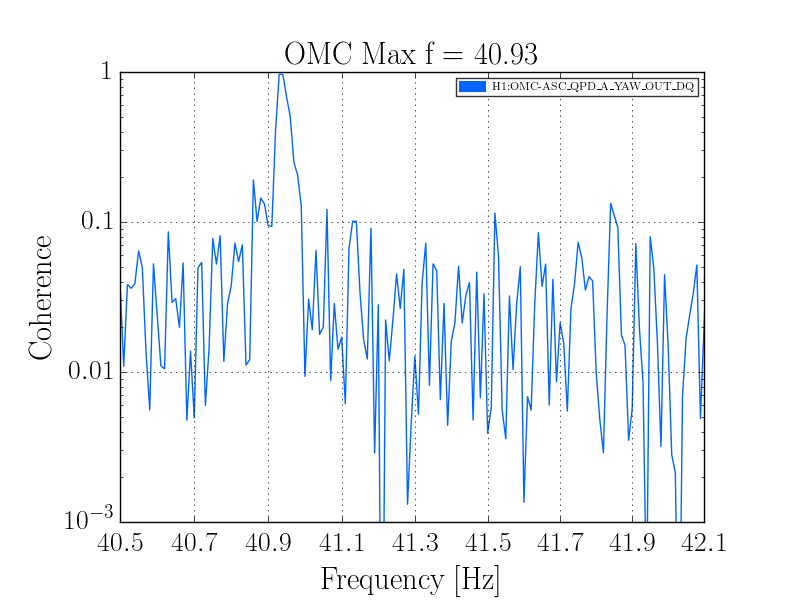
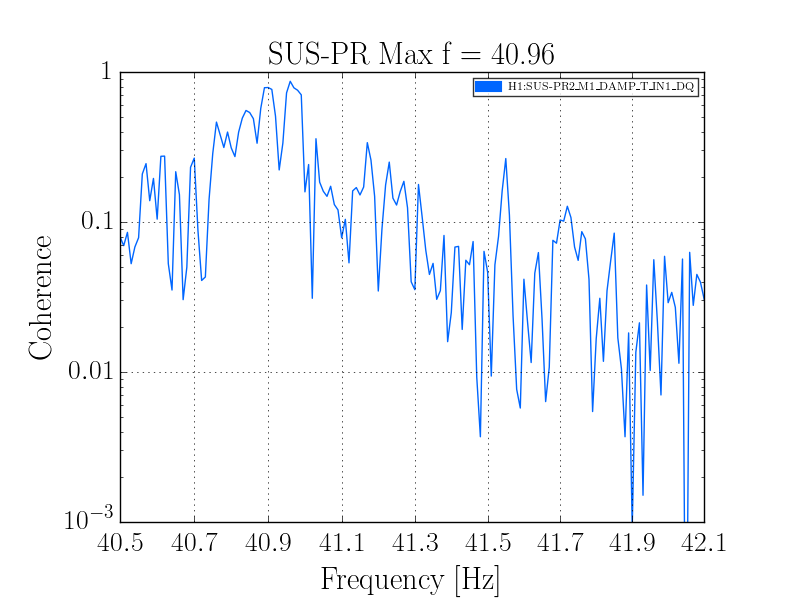
Expanding the channel list to include all channels in the detchar O1 channel list:
https://wiki.ligo.org/DetChar/O1DetCharChannels
I ran a coherence study for a half our of data towards the end of ER8.
I see particularly high coherence at 40.93Hz in many channels in LSC, OMC, ITM suspensions, and also a suspension for PR2. It seems to me like this particularly strong line is probably due to PR2 based on these results, Keith's ASDs, and Brett's measurements, and it seems to be very highly coherent.
Full results with coherence matrices and data used to create them (color = coherence, x axis = frequency, y axis = channels) broken down roughly by subsystem can be found here:
https://ldas-jobs.ligo-wa.caltech.edu/~meyers/coherence_matrices/1126258560-1801/bounce_roll4.html
Attached are several individual coherence spectra that lit up the coherence matrices with the frequency of maximum coherence in that range picked out.
-Pat
I did a diag reset on a timing glitch that occurred at around 20:48UTC. THe reset was effected at ~23:28UTC
Does clicking Diag_Reset knock us out of Observation Mode?

General Question: Does this knock us out of Observation Mode? Could I have reset this this morning?
IFO was in Commissioniing.
No, the DIAG_MAIN guardian node is NOT under the OBSERVATION READY check. It can be changed/reset/etc. without affecting OBSERVATION MODE.
I think Cheryl was talking about the diag reset button on the GDS overview screen for the front end, not the DIAG_MAIN guardian.