Stefan, Evan
We spent some time today trying to estimate the amount of carrier power (00 or otherwise) in HAM6 in full lock. Stefan had previously estimated about 270 mW of non-45-MHz light entering HAM6, based on AS_C calibration. This seemed high to us, since we should expect < 150 mW of carrier: 25 mW or so of 00 carrier (based on the DCPD sum), and 110 mW or so of other carrier (23 W input power × 0.88 input chain throughput × 37 W/W recycling gain × 150 ppm contrast defect, taken at low power).
[Does Dan have updated numbers for the contrast defect (and the 9 MHz AS port content) based on new 23 W modescans???]
According to Dan, there is a factor-of-two error in Stefan's AS_C calibration, which would bring the estimated carrier power down to 135 mW [but this is problematic; see below]. Since one can never have too many calibrations of the same diode, I'm going to use 60×103 ct/W for the calibration [referred to watts of power entering HAM6], based on 1638.4 ct/V (ADC) × 0.78 A/W (responsivity) × 2 V/V (single/differential conversion) × 1036/20 V/V (whitening) × 370 ppm (optical throughput to AS_C).
We did a few different measurements.
DARM offset sweep
We locked the IFO on RF at 23 W, locked the OMC (with dither on), and swept the DARM offset by a few tens of picometers (positive and negative). From these data it should be possible to compute a calibrated curve of current versus DARM offset, as Dan has done previously at lower power. But even without that, we can already infer 2700(640)×103 ct on AS_C for 39.5(6) mA on the DCPD sum [= 68(16) ct/mA]. Assuming an AS_C calibration of 60×103 ct/W, and noting that the amount of photocurrent at zero DARM offset is small (< 1 mA), this suggests that for 20 mA of DCPD sum we have 23 mW of carrier from the arms entering HAM6. This seems unphysically low, since we already expect 26 mW of carrier based on a DCPD responsivity of 0.75 A/W. Either way, something about the numbers in HAM6 doesn't hang together, which is a conclusion that Koji and Dan already came to based on single-bounce power budgeting.
I believe we expect at least 30 mW coming into HAM6 under normal operation, since we expect at least 14 % readout losses, not including the quantum efficiencies of the photodiodes or anything upstream of the OFI. [31 mW × (1 − 0.14) × 0.75 A/W = 20 mA.]
[For this measurement, we notched out the 332 Hz pcal line in the EX drive, so it is visible in the DCPDs. So this can be used to estimate the optical gain at each DARM offset.]
DCPDs vs AS_C vs OMC REFL
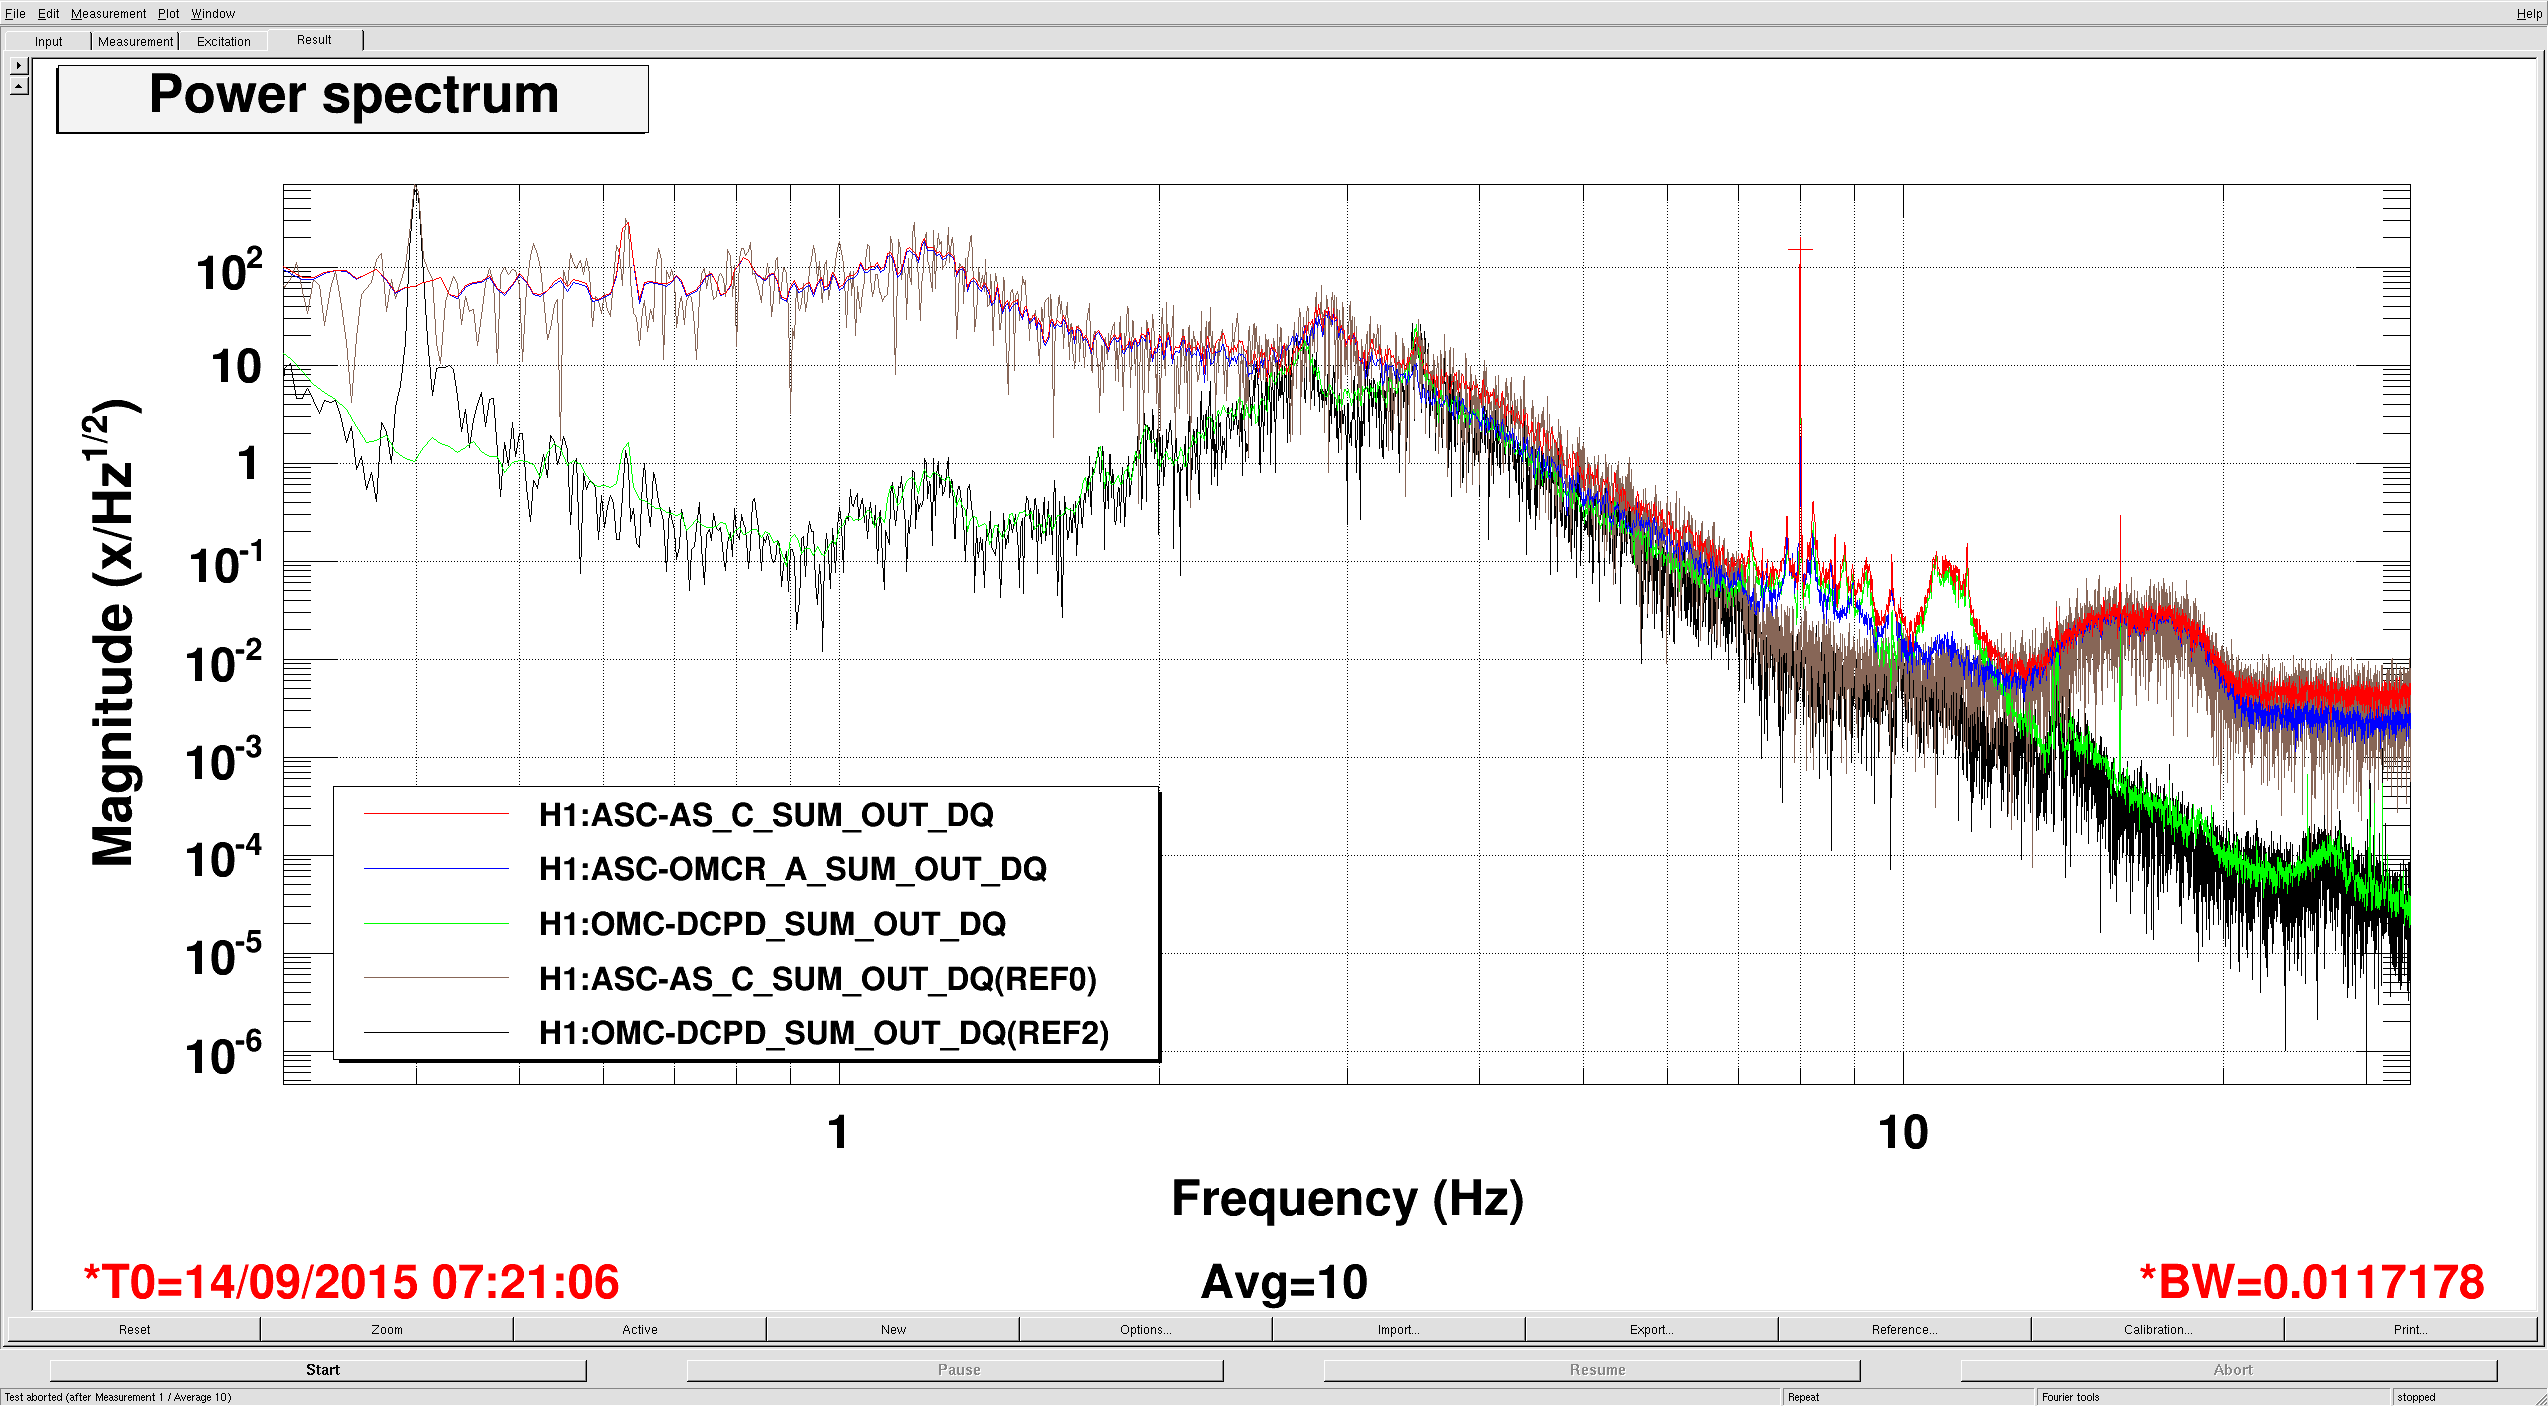
As a second test, we modulated DCPD sum at 8 Hz by driving OMC-READOUT_X0 while watching AS_C and OMC_REFL (we again opened the beam diverter for this). First, from the quiescent spectra alone we could already calibrate the PDs against each other; the calibrations are roughly 70 ct/mA for AS_C sum / DCPD sum and 2 ct/ct for AS_C sum / OMC REFL A sum. With AS_C and OMC REFL A calibrated (attachment), the strength of the line in OMC REFL A appears with a factor of 0.012 relative to the line in AS_C, suggesting that >98% of the modulated DARM light is coupled into the OMC.