I still don't know where the glitches that are correlated with ETMY saturations come from, but I do know why ETMY saturates.
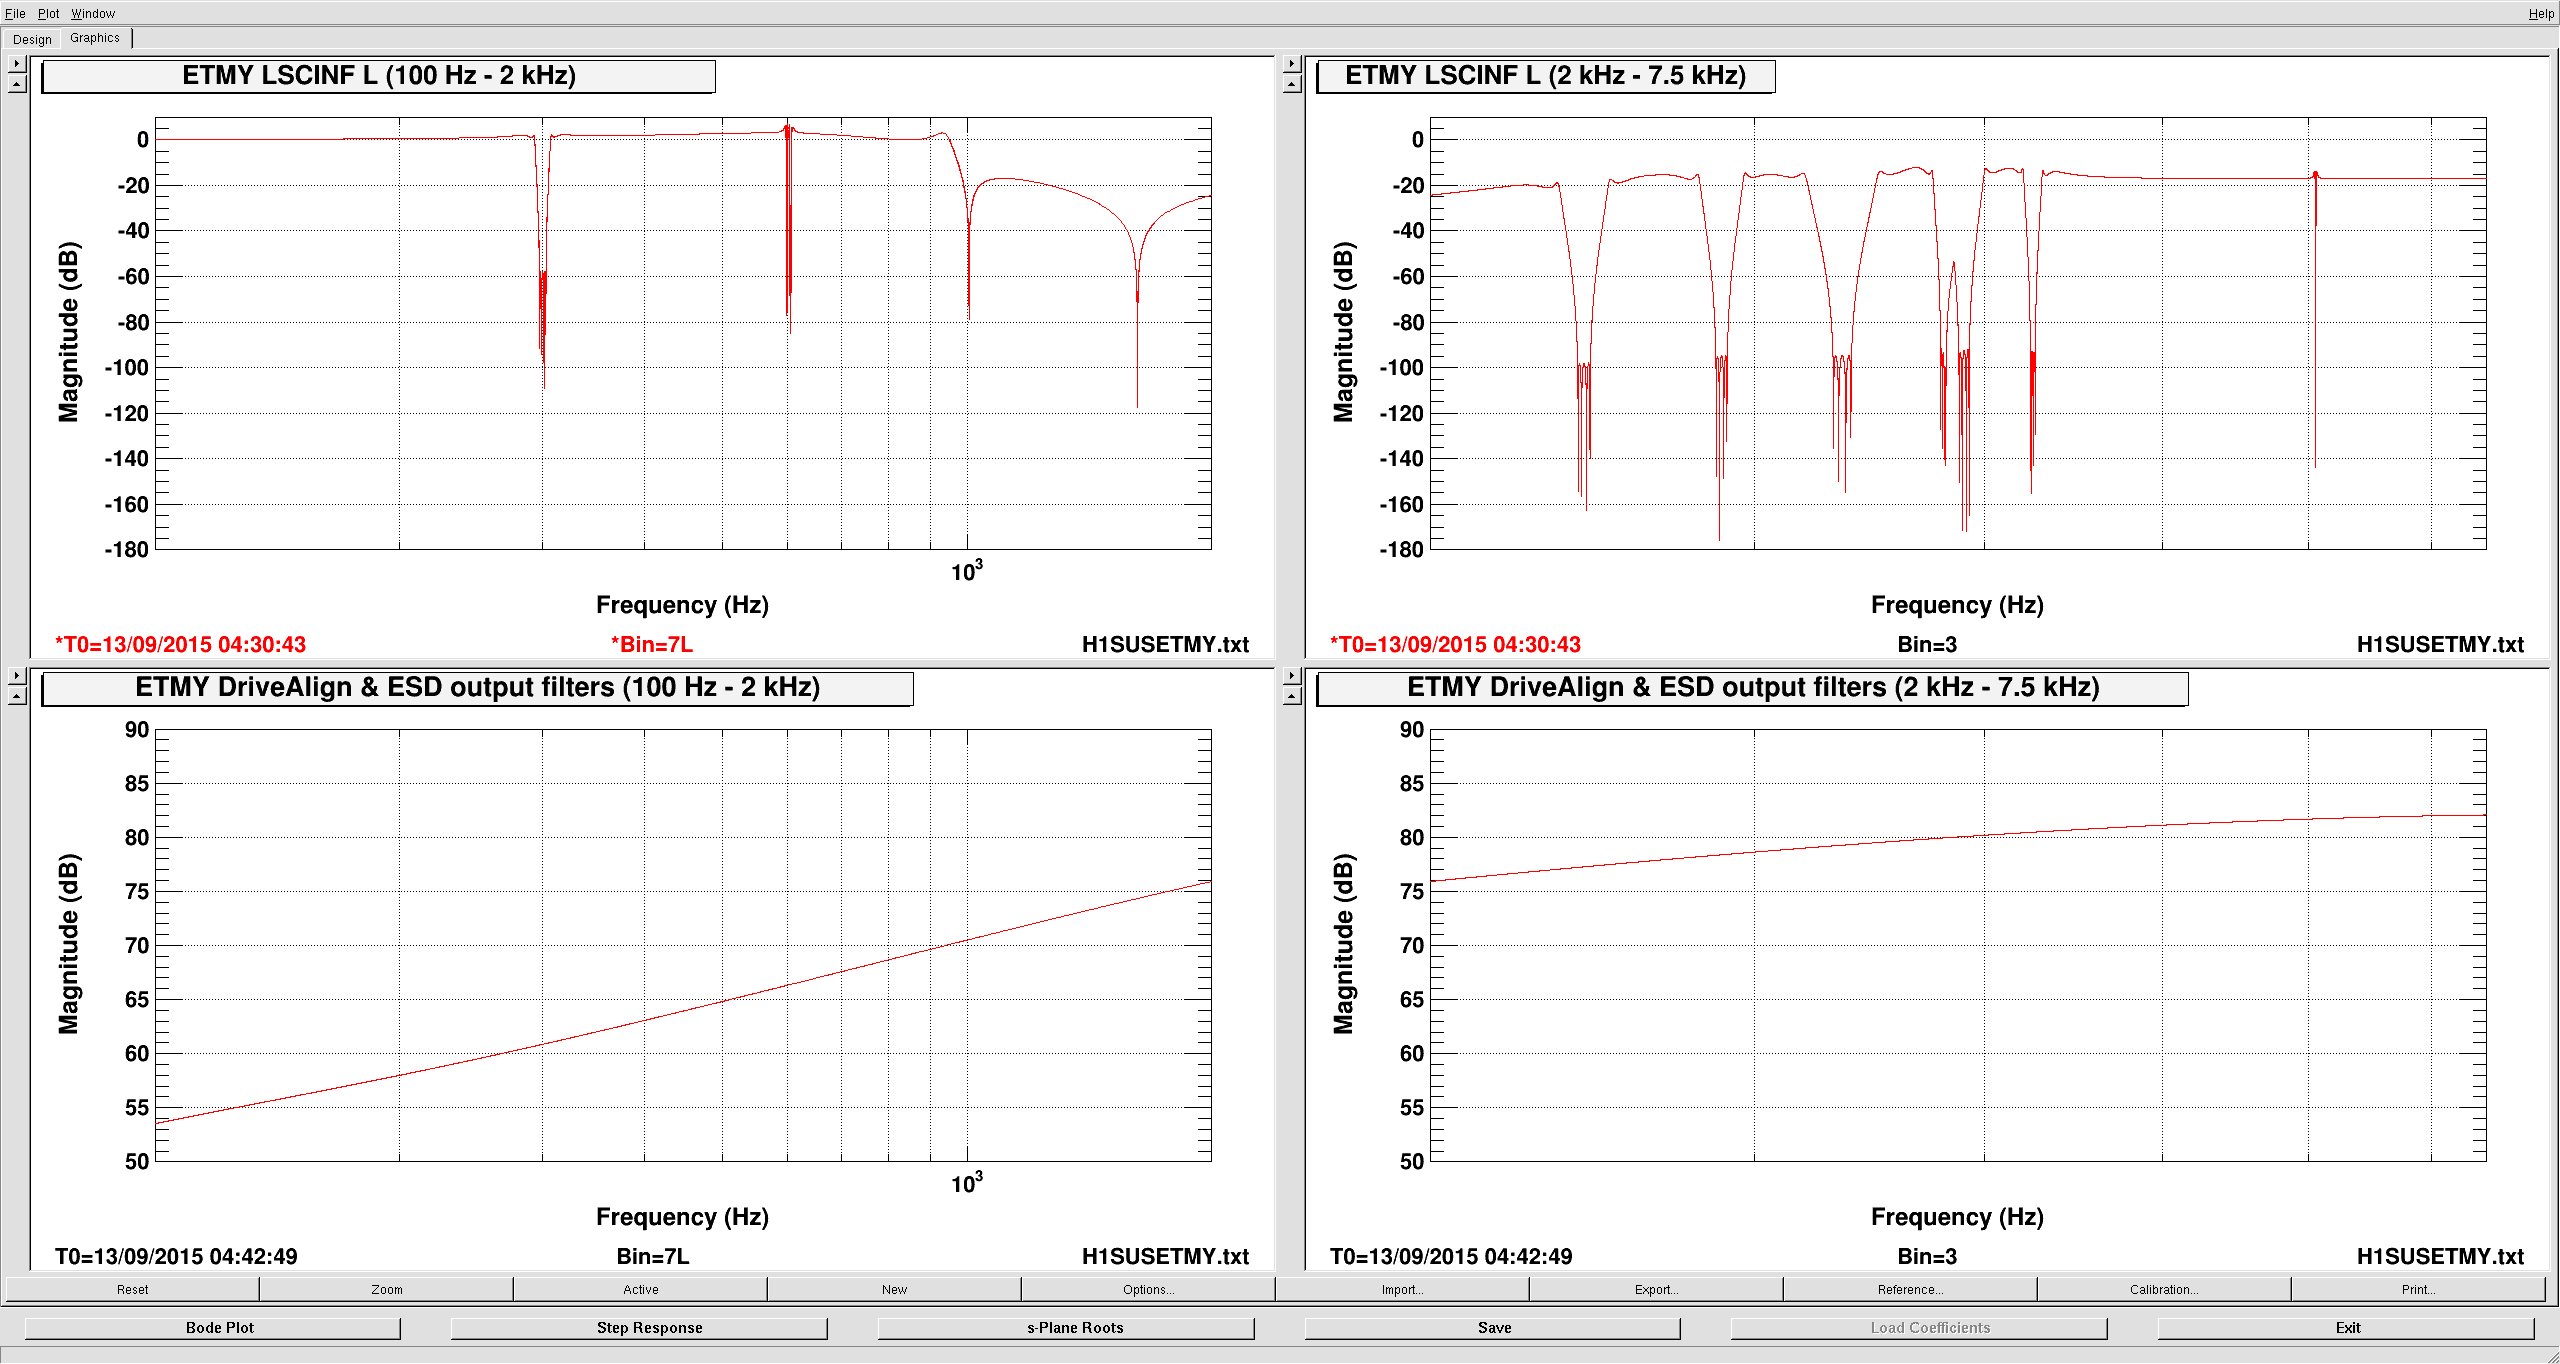
We have many very deep notches in the L3 LSC LOCK filter bank in ETMY. Some of these are as deep as -180 dB! (There are probably others in the LSC-DARM filter bank, but I didn't look there to plot filters). The top half of the first attachment shows all of these notches. (Since I zoomed in and captured references of each notch with many points to see the actual depth, I had to split the filter over 2 plots - sorry).
Later, we have 2 digital filters (for each quadrant) in the ESDOUTF filter banks. These are compensating for the analog "Acquisition" filter, and the analog low pass. Together, they have magnitudes of more than 70 dB above 1 kHz. The bottom half of the first attachment shows the magnitude of these filters together with the nearly-negligible-at-high-frequency filters in the DriveAlign filter bank.
So, we are multiplying our signals by very small numbers, then multiplying them up by very large numbers. This seems like a recipe for badness. I don't actually know if numerical precision is the cause of these problems, but perhaps it is?
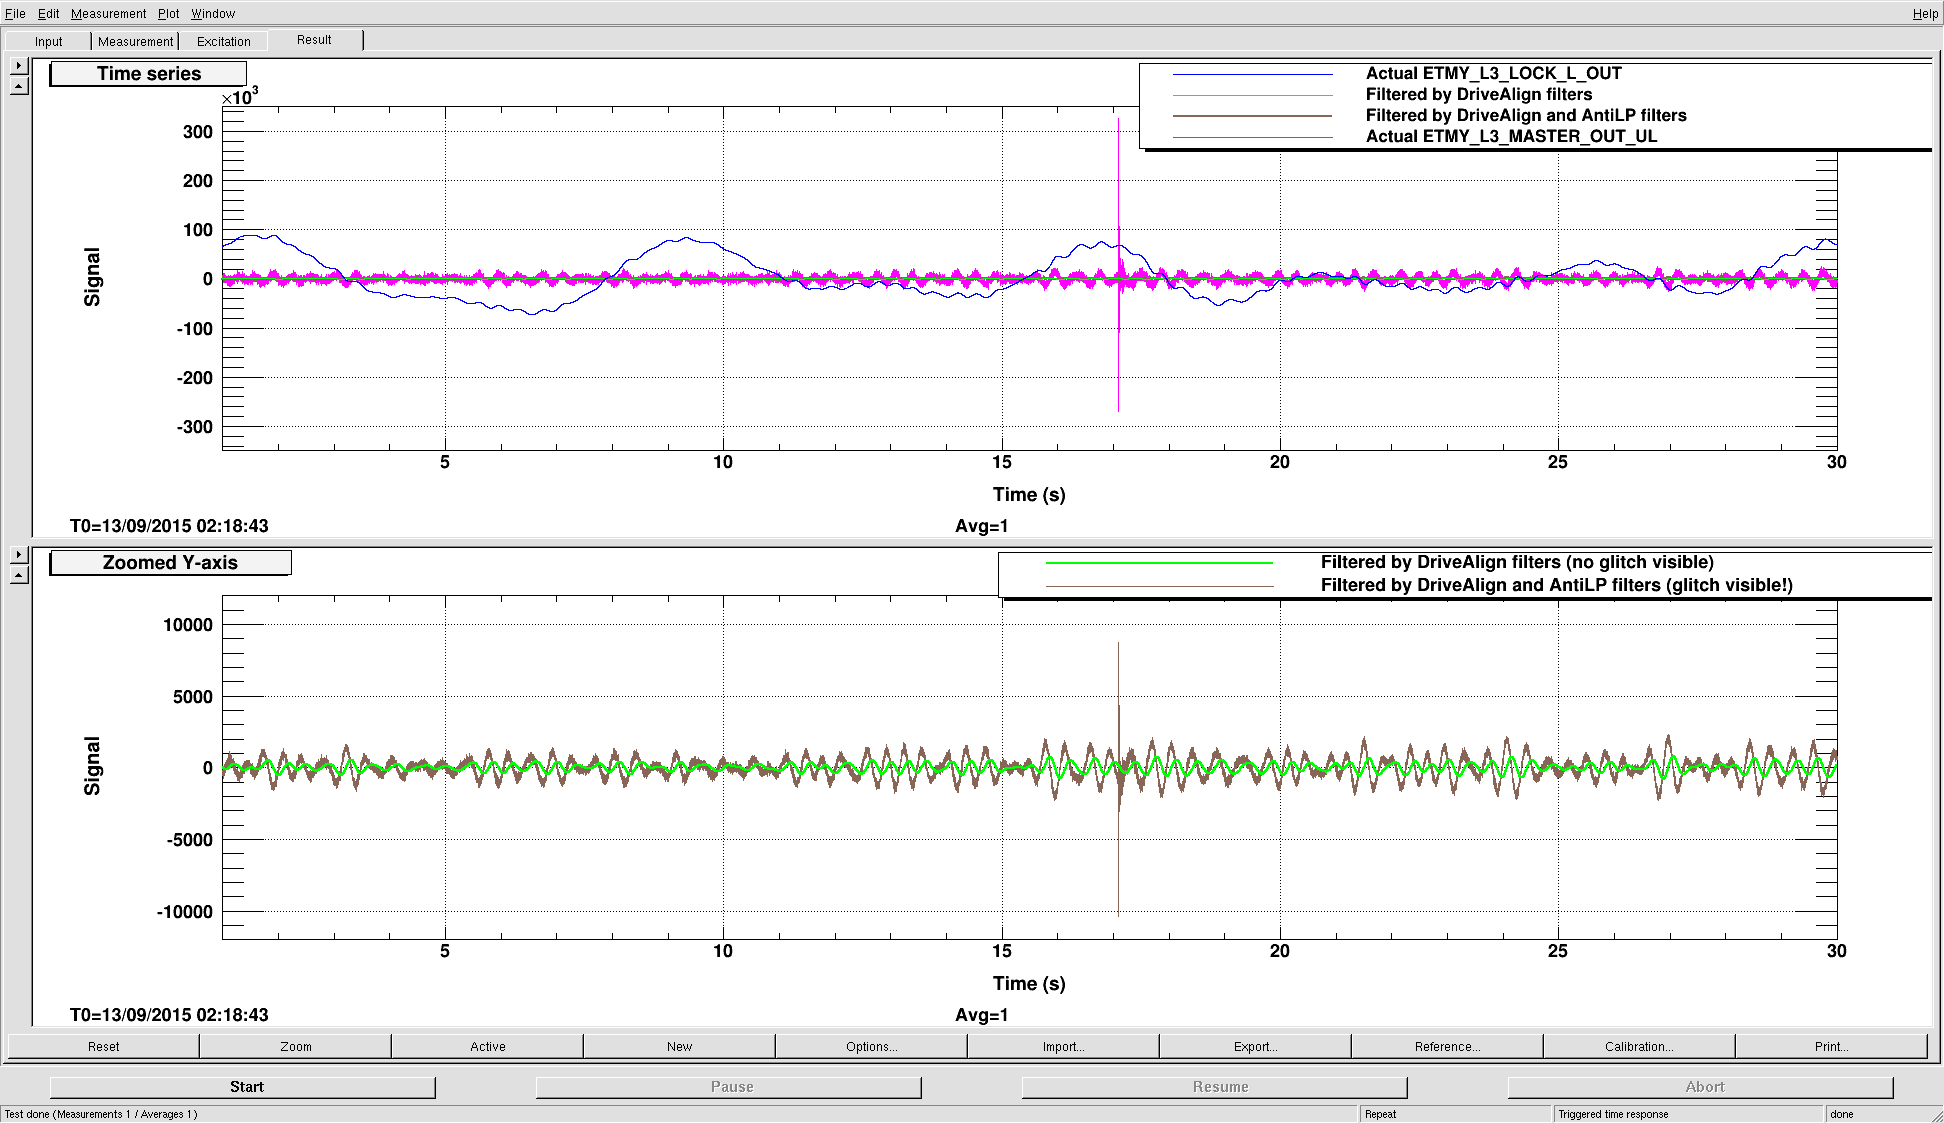
The effect of these filters is shown in the second attachment. Note here that brown and green traces on the top and bottom plots are the same data, but with different y-axes for clarity. The pink trace is the MASTER_OUT signal for one quadrant of the ESD, right before it goes to the DAC. The glitch is much larger than the 132k count DAC range, so we are certainly saturating the DAC. The blue trace is the output of the L3 LOCK L filter bank, after the filters shown in the top half of the first attachment. The green trace is that signal, filtered by FMs 3 and 4 of the DRIVEALIGN_L2L filter bank. There is still no obvious glitch. The brown trace is again the output of the Lock L filter bank, filtered by the same DriveAlign filters, and then also filtered by the AntiLP in the ESD output filter bank. Notice that due to the high gain at high frequency of that filter, we clearly see the glitch. DTT is somehow unable to filter a signal by the AntiAcq filter (zpk([152],[3250],1,"n")), so I don't have that included in the brown trace. But, the pink MasterOut trace is the actual signal, after all of the filters.
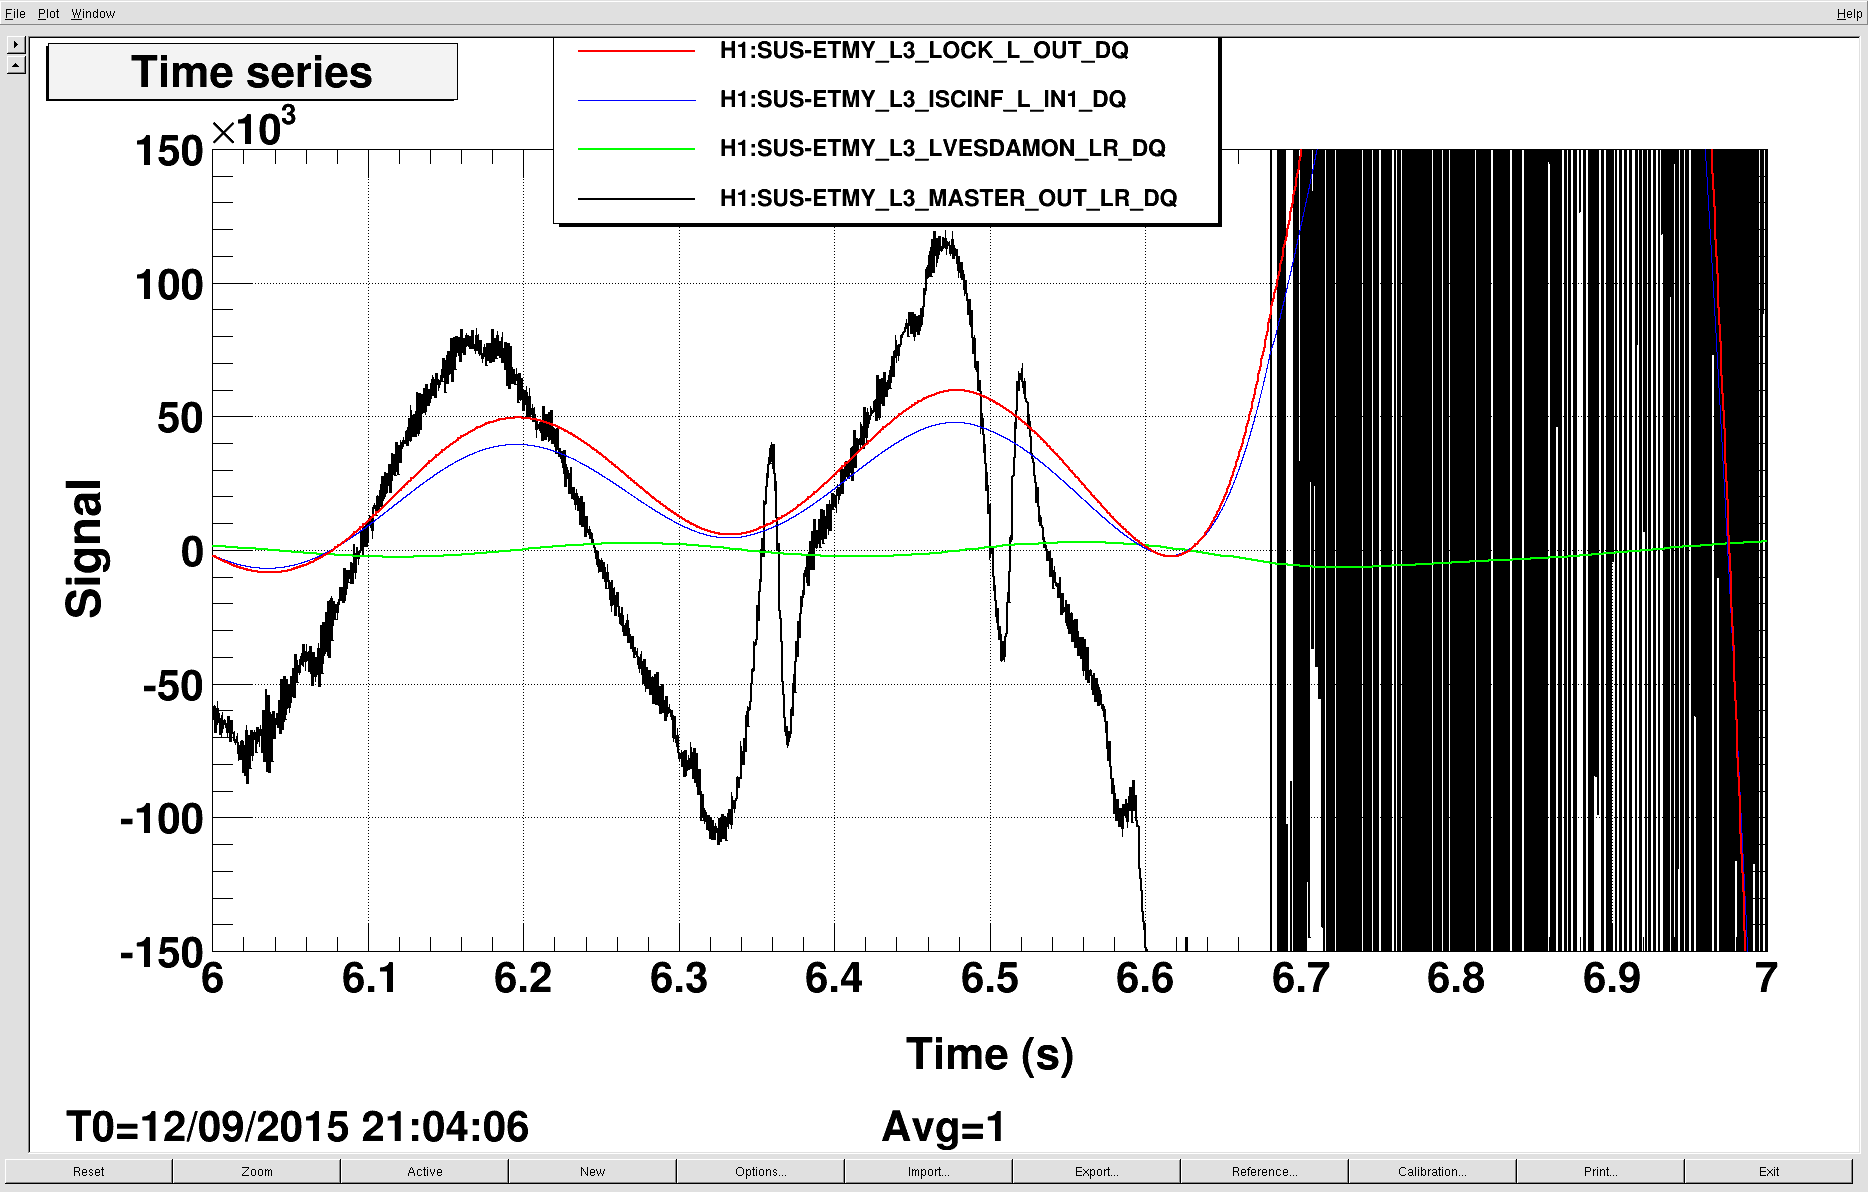
The third attachment shows the time just before the lockloss around 21:00 12Sept2015, and we can clearly see that this filtering effect is causing the signal out to the DAC to be quite weird. However, since the Lowpass and Acq filters are engaged, the signal actually going to the ESD may be mostly okay. In this plot, the blue trace is the length signal as soon as it gets to the suspension, the red trace is after all of the notch filters, black is the MasterOut after all of the digital filtering, and green is a readback of the analog signal going to the ESD. The glitches are basically impossible to see in any trace other than the MasterOut.
To conclude, maybe we don't really care if the ETMY ESD saturates occasionally, but the reason it does is the huge high gain at high frequency of the digital filters that compensate for the analog acquisition and low pass filters. Note that in ER7 we used the acquisition filter, and so some amoung of high gain at high frequency, but now in ER8 (and O1) we are also using the lowpass, so we need much more high freq high gain in our compensation filters. As Evan pointed out in alog 21315 this is why we're seeing more of these saturations now than we used to.
(Now that I've written all of this out, it all seems very obvious. But, when I was looking at the 3rd attachment (which started this all....), it was not at all obvious to me why the black trace looked so different from the others.)


While looking into some of the problems Jim was having today, I found an error in the ISC_DRMI guardian. The clearing of history was reworked a few weeks ago to use fast ezcas, but the order of things became incorrect, (gains were zeroed, histories reset, then inputs turned off. This means that the integrators in the top stage were cleared and then reaquired some history before the input was turned off.)
Now this is fixed, so inputs are turned off, gains are zeroed, then history is cleared.
This was causing DRMI to sometimes be misaligned if PRMI was locked first, the lock was dropped, and we attempted to relock DRMI.