Patrick, Cheryl, Nutsinee
Most of the logs were hand-written by Patrick. If things don't make sense that means I didn't decode his handwriting correctly.
- All time in UTC (PDT) -
14:58 (7:58) Peter getting something out of H2 PSL enclosure
15:02 (8:02) Jeff to LVEA colect CC Data
15:05 (8:05) Shiva and Sudarshan to EX
15:08 (8:08) Filiberto cabling started
15:18 (8:18) Joe check eye wash in LVEA
15:19 (8:19) Peter done
15:20 (8:20) Jeff done
15:34 (8:34) Ed to EY to start TCS
15:35 (8:35) Christina, Karen to EY (cleaning)
15:50 (8:50) Hannah, Elli install TCSY temp. sensor
15:58 (8:58) EX, FIl and Gerado start regen process
16:07 (9:07) Jason to optics lab
16:19 (9:19) Robert starting PEM
16:21 (9:21) Karen, Christina to EX
16:22 (9:22) Thomas, Shiva, ?
16:23 (9:23) Ed temp. back looking for drillbit
16:26 (9:26) Elli, Hannah back
16:27 (9:27) Filiberto and Andrea done, not out
16:30 (9:30) Jason start PMC transfer function
16:31 (9:31) Ed to EY
16:35 (9:35) Jim and Carlos to EY to replace H1scsey fornt end computer
16:37 (9:37) John, Elli, Hanna to LVEA
16:39 (9:39) DAQ restart
16:52 (9:52) Guardian restart full machine
16:54 (9:54) Karen, Christina leaving EX
16:59 (9:59) Robert into PSL
17:00 (10:00) Elli, Hanna to TCS ITMY
17:01 (10:01) DAC PEM CS model restart
17:09 (10:09) Cheryl to PSL
17:10 (10:10) Ed leaving EY and going to EX
17:15 (10:15) Leo about to start charge measurement at EY
17:20 (10:20) ASC-IMC, OMC, CSC model restart (Kiwamu, Keita)
17:35 (10:35) Kiwamu restart H1LSC model
17:36 (10:36) H1 ASC IMC restart (Kiwamu)
17:45 (10:45) Kyle to EY to shut off calibration gas
17:45 (10:45) Nutsinee to help Elli in the LVEA
17:51 (10:51) DAC restart digital video computers
17:53 (10:53) Karen and Christina cleaning in LVEA
17:55 (10:55) DAQ restart
18:00 (11:00) Fil to EX, fix UIM(?) drive
18:13 (11:13) DAQ restart
18:21 (11:21) Robert in PSL
18:24 (11:24) Parada water delivery
18:25 (11:25) Joe done
18:27 (11:27) Robert to LVEA to continues setting up PEM (?)
18:38 (11:38) Gerado and Kyle vack to LVEA
18:39 (11:39) measure power on photodiode
18:45 (11:45) Dave restarting camera servers
18:46 (11:46) Ed done at EX, going to LVEA
18:50 (11:50) Hugh HAM5, testing SDF
19:10 (12:10) Robert done
19:12 (12:12) Ed done
19:12 (12:12) Cheryl done
19:19 (12:19) Fil done
19:28 (12:28) Jim, Hugh, filter bugs in HEPI
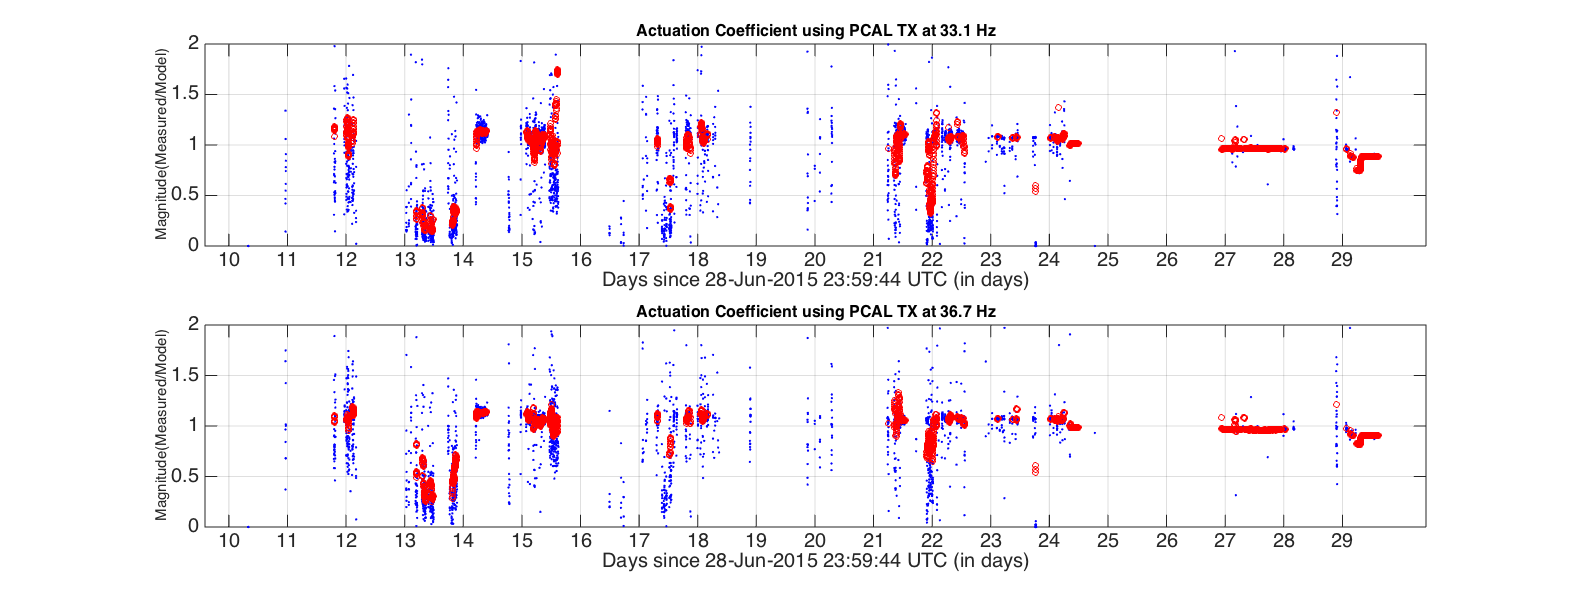
19:29 (12:29) Pcal done
19:45 (12:45) Rick back to EX for laptop
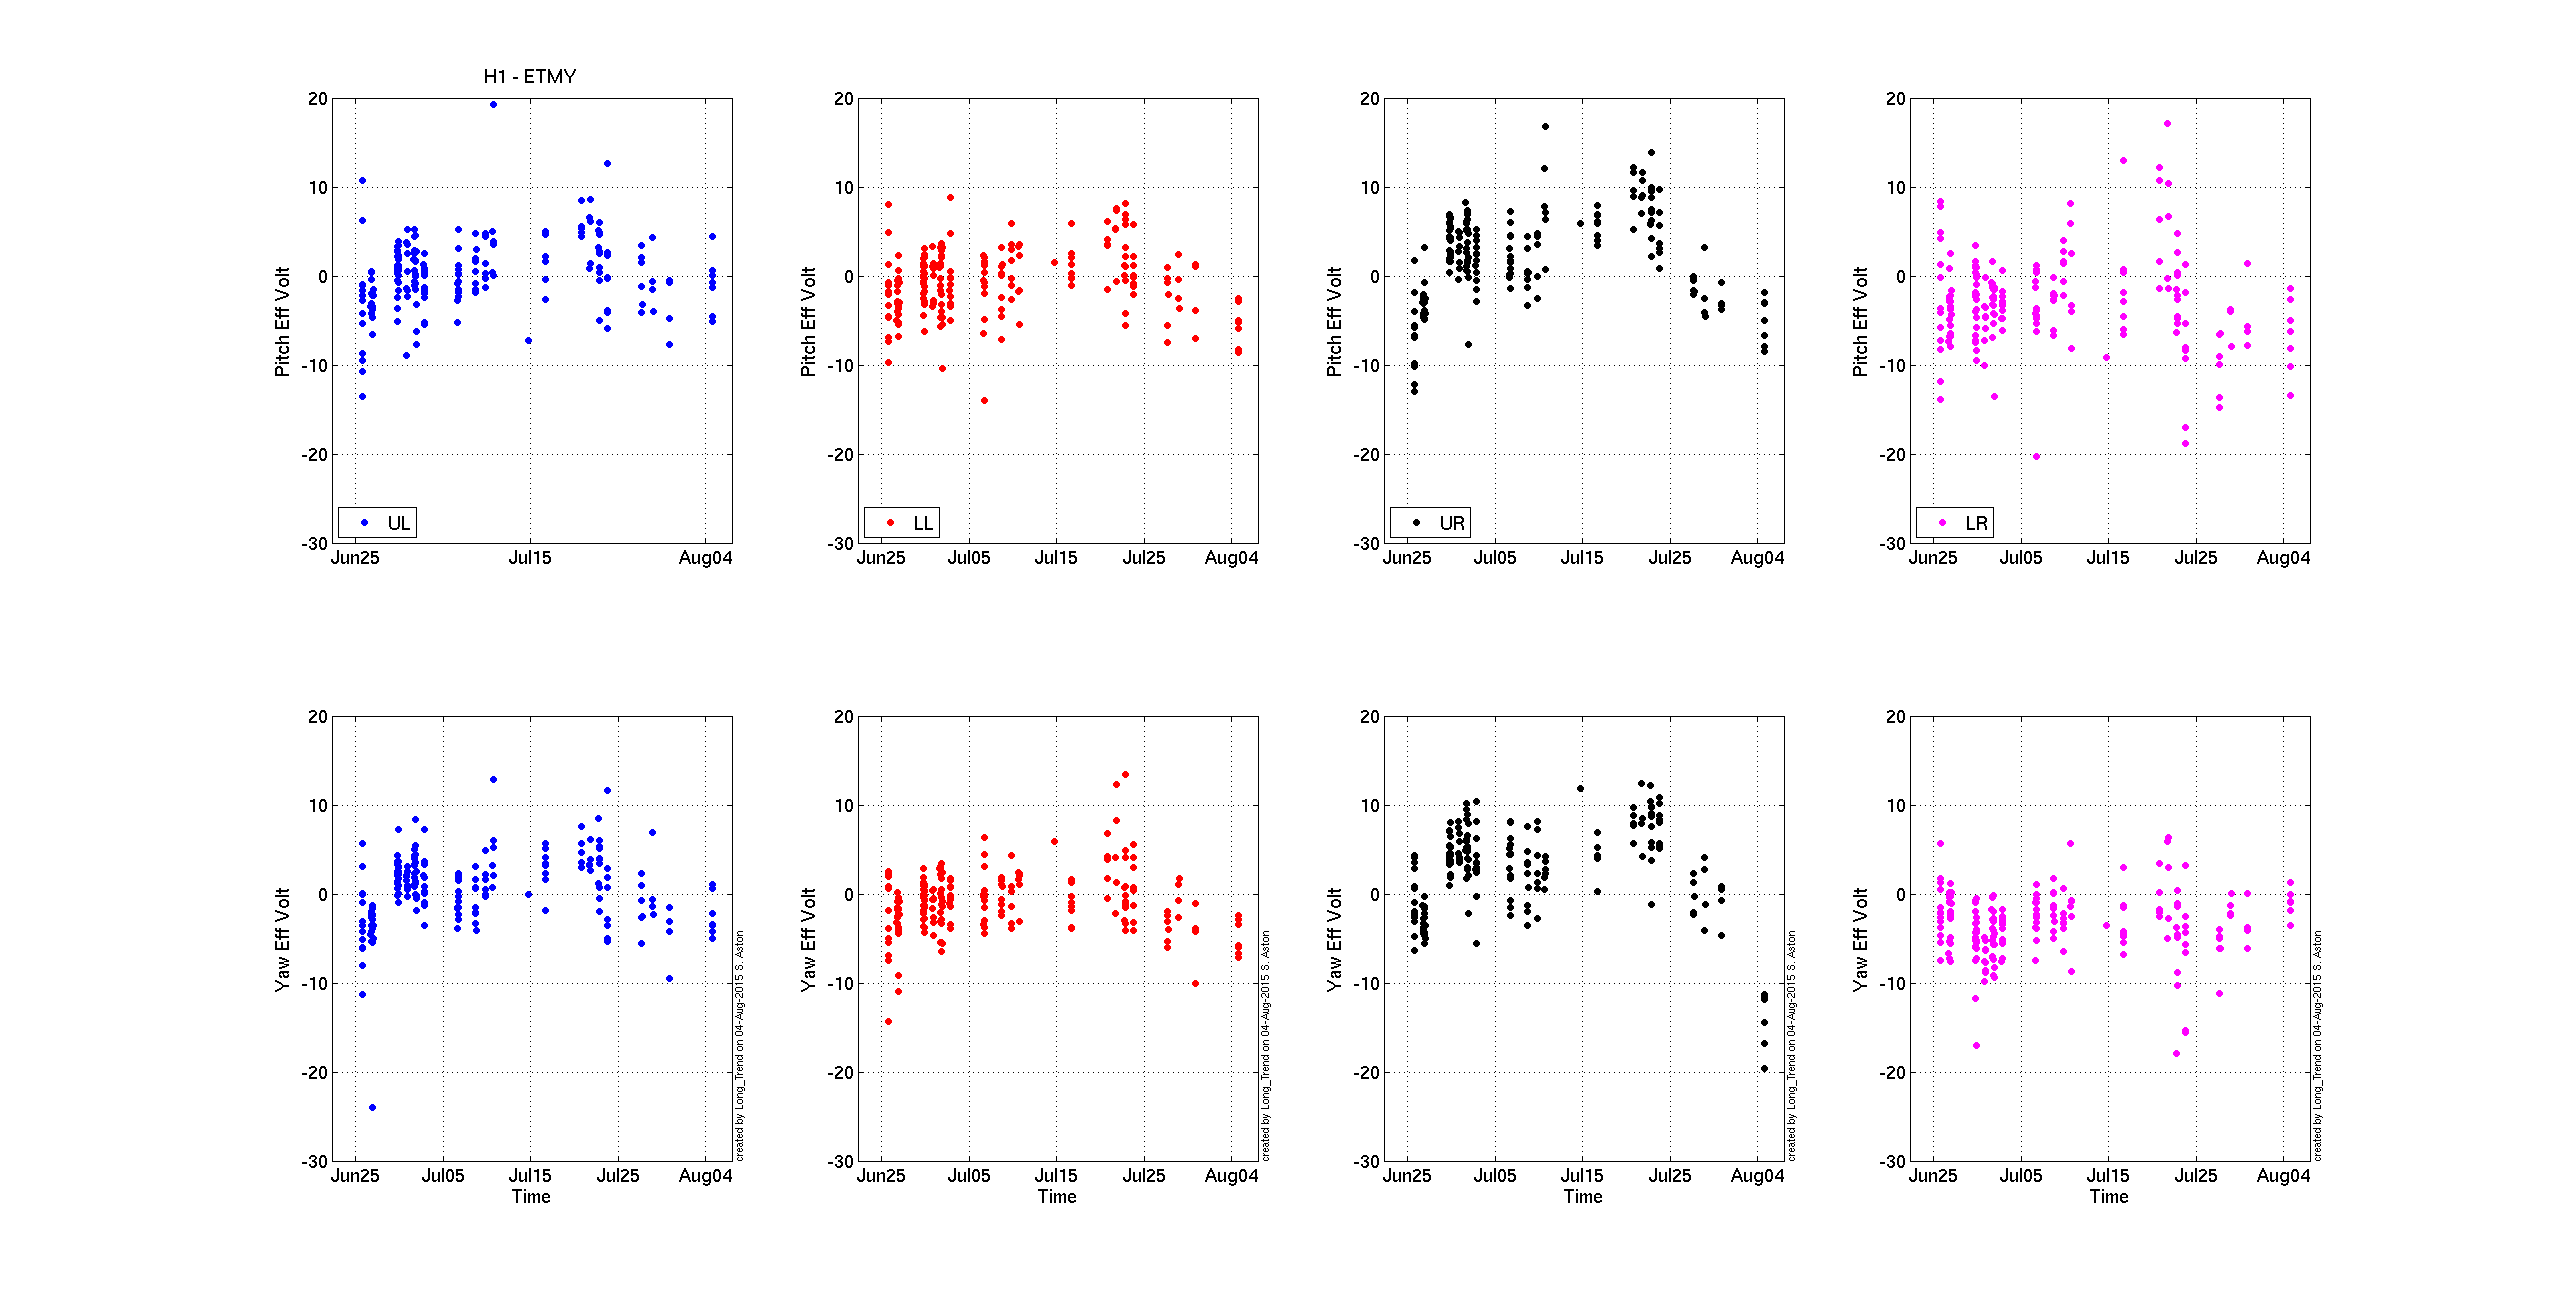
19:59 (12:59) TJ, Betsy derail(?) ETMX high voltage driver
20:11 (13:11) Kyle back to EX
20:18 (13:18) Ops computer restart
20:26 (13:26) TJ, Betsy done
20:36 (13:36) Gerado to work with Elli
20:41 (13:41) EX inf. con. gage off
21:00 (14:00) ALS COMM, DIFF, XARM, and YARM nominal state is now SHUTTERED (Sheila)
21:38 (14:38) Fil to EX - try to fix ESD drive
22:13 (15:13) ESD working - Fil going to Mid Y
22:27 (15:27) Jeff to EX to restart high voltage
22:40 (15:40) Jeff coming back
0:53 (17:53) Patrick and Stefan still recovering the ifo.
Happy Maintenance Tuesday....


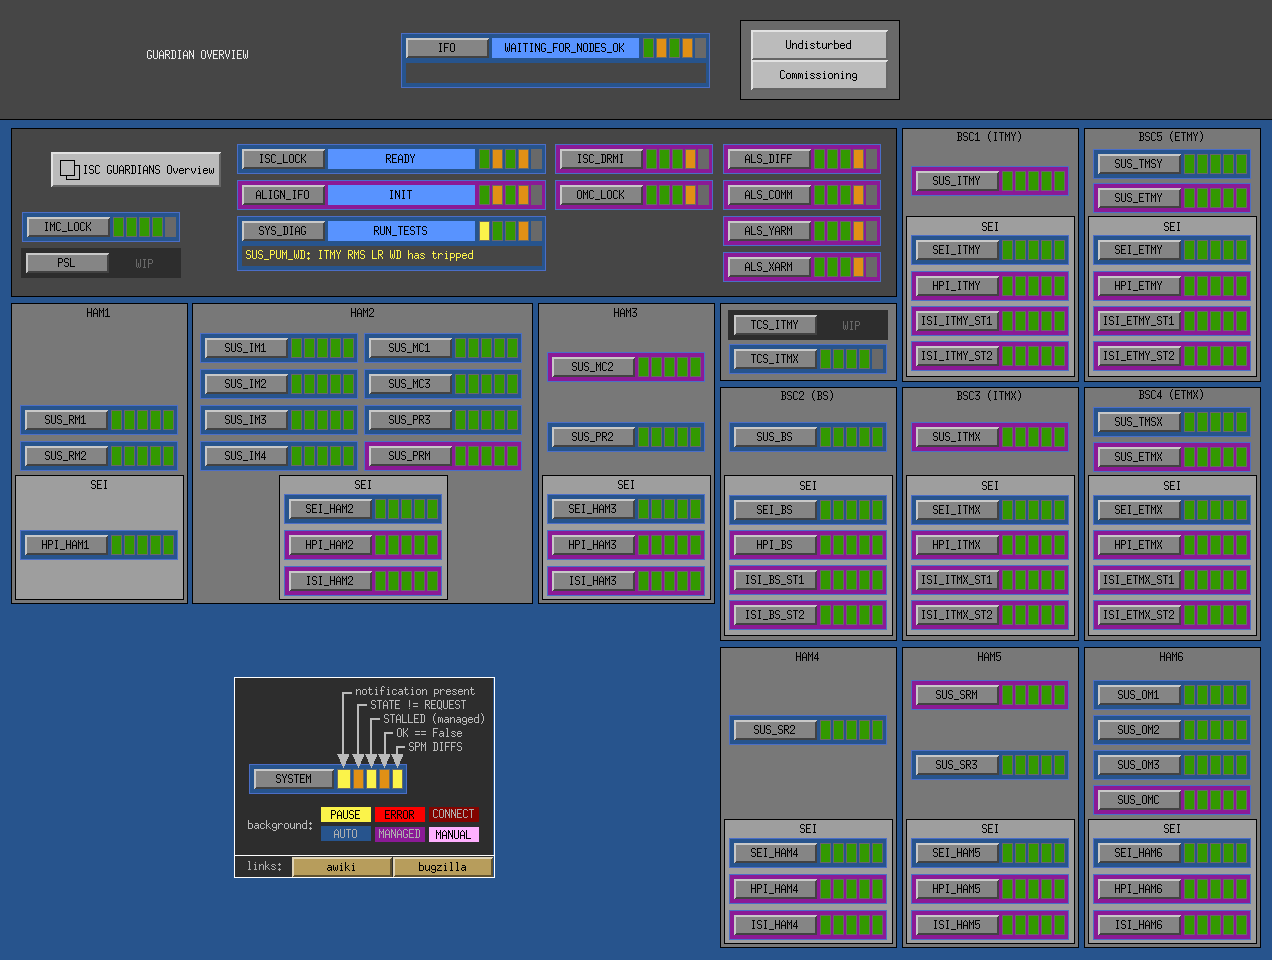

I also changed the NOMINAL state for IMC_LOCK to correspond to the new ISS on state:
IMC_LOCK: ISS_ON