thomas.shaffer@LIGO.ORG - posted 13:28, Friday 11 September 2015 (21405)
Observation Mode
All work is done (for now) so we are back in Observe
All work is done (for now) so we are back in Observe
The IFO is locked in Nominal Low Noise, but we are not in Observing mode due to beam tube seam sealing and a few various other trips around the site.
Highly related: alog 21234
Conversion coefficients to obtain the equivalent beam rotation at the periscope from IMC WFS signals were measured at around 20Hz while IFO was operating in low noise (see subentry for details):
| PIT (nrad/ct) | YAW (nrad/ct) | |
| IMCWFSA | 5.8 | 4.6 |
| IMCWFSB | 3.5 | 1.4 |
There could easily be 10 or 20% error but this cannot be off by an order of magnitude.
Note that the PIT to YAW and YAW to PIT coupling in the sensing are not small at all. PIT to YAW sensing coupling is about 0.6 for WFSA and 0.9 for WFSA, while for YAW to PIT the numbers are 0.5 for WFSA and 0.4 for WFSB. (This is not surprising as the WFS quadrant gains are fishy: alog 20065). If we need to evaluate PIT and YAW jitter separately, it's somewhat better to use WFSB for PIT and WFSA for YAW.
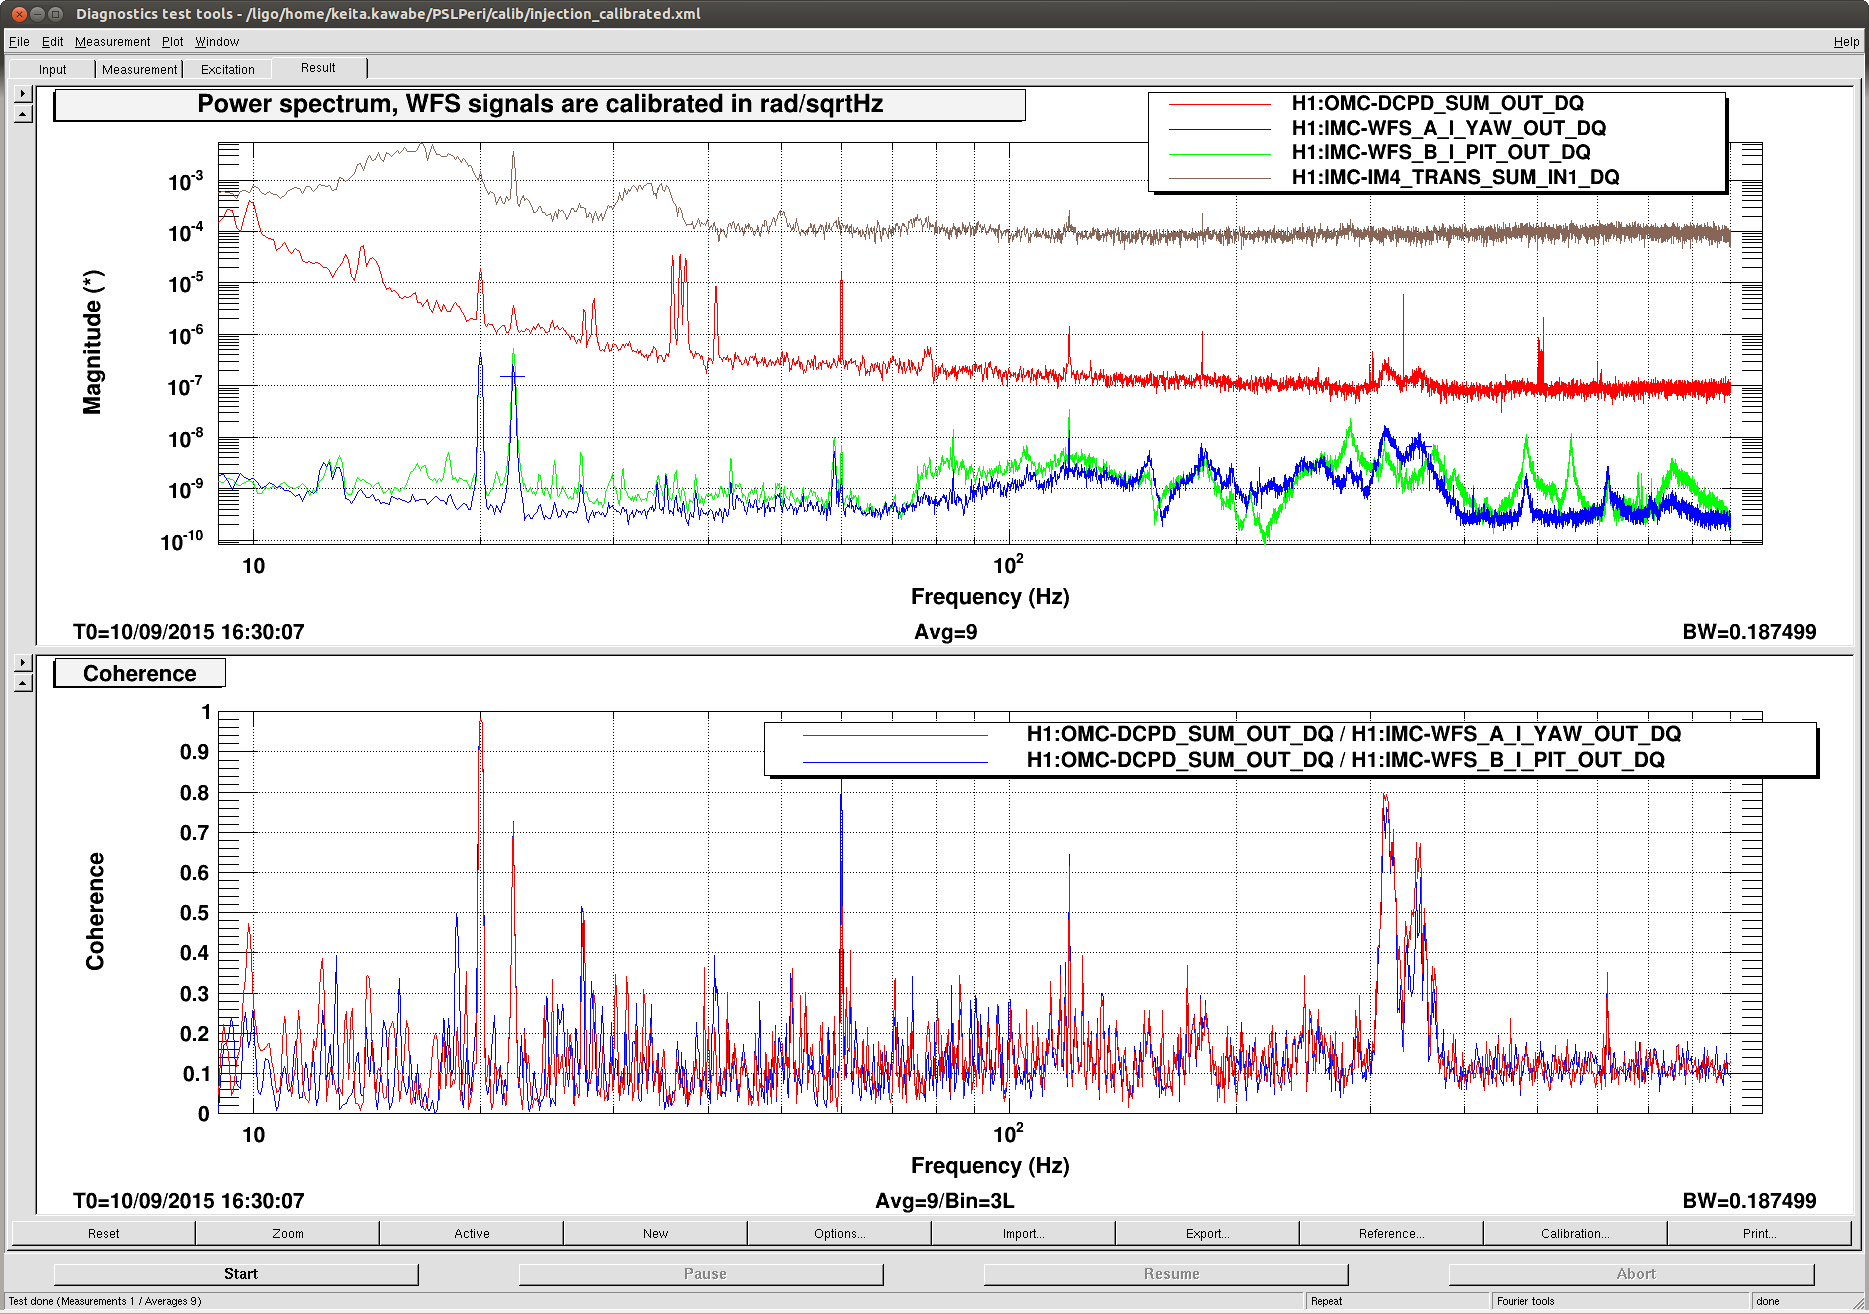
The attached shows WFSB PIT and WFSA YAW, already calibrated to radians using the above table (assuming that WFS response as a sensor is flat), and OMC DCPD in full lock. There are two lines injected to Peri PZT, @20Hz for YAW and 22.1Hz for PIT. The excitation voltage is the same for both, but due to the fact that peri mirror is tilted by 45degrees in PIT, beam deflection in YAW is sqrt(2) smaller than PIT.
Taking this into account, PIT to DCPD coupling is a factor of 7.5 smaller than YAW coupling. Looking at the peaks, indeed there are peaks in WFSB PIT, most notably at 280Hz, that are not present in DCPD even though the hight was as large as annoying twin peaks at 315 and 350Hz, and this is consistent with the smaller PIT coupling.
The attached also shows IMC trans SUM. PIT peak (22.1Hz) is much larger than YAW (20Hz) even you take a factor of sqrt(2) into account. This is probably due to the fact that MC WFS offset for PIT is much larger than YAW. Even then, PIT coupling is smaller. This is one of several things that show that this cannot be a simple jitter AM conversion by MC.
Among many calculations that could be done, I'll probably convert the input beam jitter to the beam jitter on OMC.
How the WFS calibration numbers are obtained:
1. PZT sensitivity in rad/volt
The PZT is PI S-330.4 type (T1500342). The controller is PI E-616.SS0G which has -2 to 12V input range in open loop mode. This combination gives 7 mrad p-p tilt in both axes (E1300470).
So this is about 7mrad/14V(drive input) at DC.
2. Beam rotation at the PZT mirror
The PZT is tilted 45degrees in PIT. This doesn't affect the beam rotation per mirror tilt for PIT (beam angle = 2* mirror tilt), but does make it sqrt(2) smaller for YAW.
3. DAC to driver input
According to Vern our 16bit DAC gives +20V differential maximum and -20V differential minimum. According to D1100909, AI output goes to D1100482 and then to the driver (note that LPF is ommitted in D1100909 but should be added).
It seems that there's no DC gain in D1100482 (D1100457 inside, the board converts +-20V differential to +-20V single ended though the output should rail at the supply voltage).
drive input/DAC count = 40V/2^16 = 610uV/cout.
4. LPF (alog 21300)
Pole is at about 1.2Hz. This was confirmed by injecting lines at around 0.1Hz, 1Hz and 20Hz for YAW and looking at IMC WFS DC when MC2 was misaligned (not shown here but the file is /ligo/home/keita.kawabe/PSLPeri/calib/WFSDCcalib2Y.xml).
No reason to believe that this is any different for PIT.
5. Injection into PZT at 20Hz for YAW and 22.1Hz for PIT in full lock
At 20Hz I assume that the effect of the IMC ASC is small even at 20W. I measured the TF from injection to the WFS outputs (the file is /ligo/home/keita.kawabe/PSLPeri/calib/injection.xml).
PZT PIT PZT YAW
WFSA P 5.6 2.5
WFSA Y 3.2 5.5
WFSB P 9.4 7.4
WFSB Y 8.9 18.3
(Note that PIT to YAW and YAW to PIT coupling numbers in the parent log were obtained from this.)
6. Combining numbers
From 1 to 4, beam rotation per DAC count is 0.6/(1+i*f/1.2Hz) urad/ct for PIT, 0.4/(1+i*f/1.2Hz) urad/ct for YAW, i.e. 33nrad/ct for PIT and 25nrad/ct for YAW at injection frequencies.
I divide 33nrad/ct by e.g. 5.6 to obtain the conversion coefficient for WFSA PIT.
Paul has done some measurements in the past to misalign the MC to assess the jitter noise in calibrated units. I wonder if his results agree with the calibrated WFS error signals.
Out of Observing due to some SDF work and a few maintenance items.
The raw minute SSD RAID has been rebuilt, and h1tw0 is now writing raw minute trend data to it's disk. Since data from April 14 to present was lost, we will evaluate if data recorded from h1tw1 can be used to fill in the gap.
Sheila and Evan here for a few hours, and Sheila a bit more, then we put the IFO into Observation, and It's been locked since.
One DIAG_MAIN Guardian glitch where it lost the connection to the nds server. I reloaded, and it reconnected.
Evan, Sheila, Cheryl
After realizing that T0900511 suggests using REFL 45 for SRC control and only using AS36 for the BS (not any SRC controls), we decided to have a look at the REFL 45 WFS tonight. Indeed, what we see is rather consistent with what is predicted T0900511.
We have known for a while that the phasing of the refl 45 WFS is wrong (we are subtracting a lof of our signals), so we would like to fix that before attempting to use them in an additional loop.
First we disengaged the PRC2 loop (combination of REFL 9+45 A+B to PR3) at 23 Watts, we reverted the phases of the refl wfs to the ones we found in 20811 . We checked that these are still phases where the CHARD signal is in the Q phase, and we checked the transfer function from a CHARD PIT excitation to each quadrant. The phases for the individual quadratures are consistent with a pitch signal.
We also drove PR3 and SR3 PIT and measured the transfer function to each quadrant of refl 45. The measurement was a little tricky for PR3. At first we drove at 8 Hz, and got a signal that looked mostly like a length sigal (same phase on all 4 quadrants). We added a resG filter (which is now loaded in PRM M3 ISCINF), which changed the quadrant TF phases to be somewhat PITCH like. We then drove at 3 Hz to be well within the bandwidth of all our LSC loops, and got quadrant TF phases that would prodce a pitch signal for a pitch drive.
We then looked at the DC signals and moved optics around to see what gave us a good signal. The matrix that you would guess based on T0900511 seems like a good one: REFL 45 A + B I to PR3, REFL 45 A - B to SR3, and we have CHARD signal in REFL 45 A + B Q.
After a lockloss that I caused by moving optics too far, Cheryl brought the IFO back up and we engaged the ASC with the new REFL 45 phases, and a matrix that did not include any refl 9 signals for PR3. This seemed OK although the turn on was a bit rough. At 10 Watts and 15 Watts things also seemed fine, but at 20 Watts we had our usual runaway, with POP 90 increasing.
I left a few alingment offsets different after working on ASC, so SDF was red. We accepted SR3 and PR3 alignment values. We thought about not monitoring these channels, but they don't change every lock.
Title: 09/10/2015, Evening Shift 23:00 – 07:00 (16:00 – 00:00) All times in UTC
Support: Jenne, Evan, Jeff K., Sheila
Incoming Operatror: Cheryl
Shift Summary:
- Attend operators training meeting until 23:10 (16:10)
- In Maintenance Mode due to S&K Electronics hammering drilling at End-Y
- S&K Electronics finished – Turn IFO over to Kiwamu for commissioning work
- Repaired leak in OSB sprinkler system – Have informed Facilities
- Dropped out Observing mode to Commissioning – Turn IFO over to Evan for commissioning work. LLO was not in Observing Mode.

Activity Log: All Times in UTC (PT)

23:15 (16:15) Take over from TJ
23:15 (16:15) IFO locked at NOMINAL_LOW_NOISE, 22.7W, 60Mpc
23:34 (16:34) Switch Observatory Mode from Maintenance to Commissioning
01:24 (18:24) Dick G – Out of the Optics lab
02:01 (19:01) Set intent bit and Observatory Mode to Observing at 22.7W 72Mpc
02:50 (19:50) Lockloss – Cause unknown
03:14 (20:14) IFO locked at NOMINAL_LOW_NOISE, 22.6W, 69Mpc
03:16 (20:16) Set intent bit and Observing Mode to Observing
03:24 (20:24) Commissioners reloaded Guardian code – DID NOT DROP OUT OF OBSERVING
04:42 (21:42) Drop to Commissioning mode per commissioner’s request
07:28 (00:28) Turn over to Cheryl
EPICS values used for calculation of DARM time-varying parameters (DCC T1500377) in GDS pipeline and with PCALMON data were updated on 10-Sep-2015, 23:38:17 PDT (11-Sep-2015, 06:38:17 UTC) using H1 DARM model with canonical parameter set for ER8/O1 (LHO alog 21386).
There is an additional phase of 136.7 degrees that was fudged into H1:CAL-CS_TDEP_REF_INVA_CLGRATIO_TST_(REAL|IMAG). This value is used for calculation of kappa_{tst} (the phase fudge factor was introduced one day ago, see LHO alog 21358). We are investigating the source of this discrepancy.
New values were accepted in SDF_OVERVIEW.
Output files (raw epics values, more verbose log and a matlab file with EP# variables that correspond to table 2 in T1500377 convention) were committed to the calibration SVN directory: (detailed log is also attached to this alog):
CalSVN/aligocalibration/trunk/Runs/ER8/H1/Scripts/CAL_EPICS/
The EPICS values correspond to the model file and the parameter file in calibration SVN at rev. 1381:
CalSVN/aligocalibration/trunk/Runs/ER8/H1/Scripts/DARMOLGTFs/H1DARMOLGTFmodel_ER8.m
CalSVN/aligocalibration/trunk/Runs/ER8/H1/Scripts/DARMOLGTFs/H1DARMparams_1124954397.m
I have produced first-order plots of the magnitude and phase strain uncertainty.
These plots look very good mostly because I am using only statistical uncertainty, and in some cases eyeballing the systematics from residual plots to get an idea of our final uncertainty.
These are the values of sigma I used for the various parameters important to strain:

σ_|A_tst| = 0.01*abs(A_tst);    1% uncertainty
σ_|A_pu| = 0.039*abs(A_pu);     3% uncertainty
σ_|C_r| = 0.01*abs(C_r);        1% uncertainty
σ_|kappa_tst| =  0.0040;        std of first order |kappa_tst| calculations
σ_|kappa_pu| = 0.0066;          std of first order |kappa_pu| calculations
σ_φ_A_tst = 5;                  5 degree assumption
σ_φ_A_pu = 5;                   5 degree assumption
σ_φ_C_r = 5;                    5 degree assumption
σ_φ_kappa_tst = 0.27;           std of first order phi_kappa_tst calculations
σ_φ_kappa_pu = 0.35;            std of first order phi_kappa_tst calculations
σ_kappa_C = 0.0049;             std of first order kappa_C calcs
σ_f_c = 23.4731;                std of first order f_c calcs

Plots 1 and 2 are the Magnitude and Phase Uncertainty Plots using the Response function.  Recall the Response function R = (1 + G) / C.  I will also have the "Two Signal" calibration uncertainty (h = DARM_ERR / C + A * DARM_CTRL), and I expect them to coincide nicely someday soon.
Note that the max uncertainty in magnitude is ~4% at 30 Hz and the max uncertainty in phase is ~7 degrees.  (Remember that these are first order plots, but this is surely auspicious!)

Plots 3 and 4 are the squared component plots where we can see which parts of the uncertainty dominate where.
For magnitude, phi_A_pu and phi_A_tst dominate at low frequency and phi_C_r dominates at high frequency.
For phase, phi_A_pu dominates at low frequency and phi_C_r dominates at high frequency.

Next I will ensure the Two Signal and Response Function uncertainties are similar, then I will begin to inform our sigmas more intelligently.
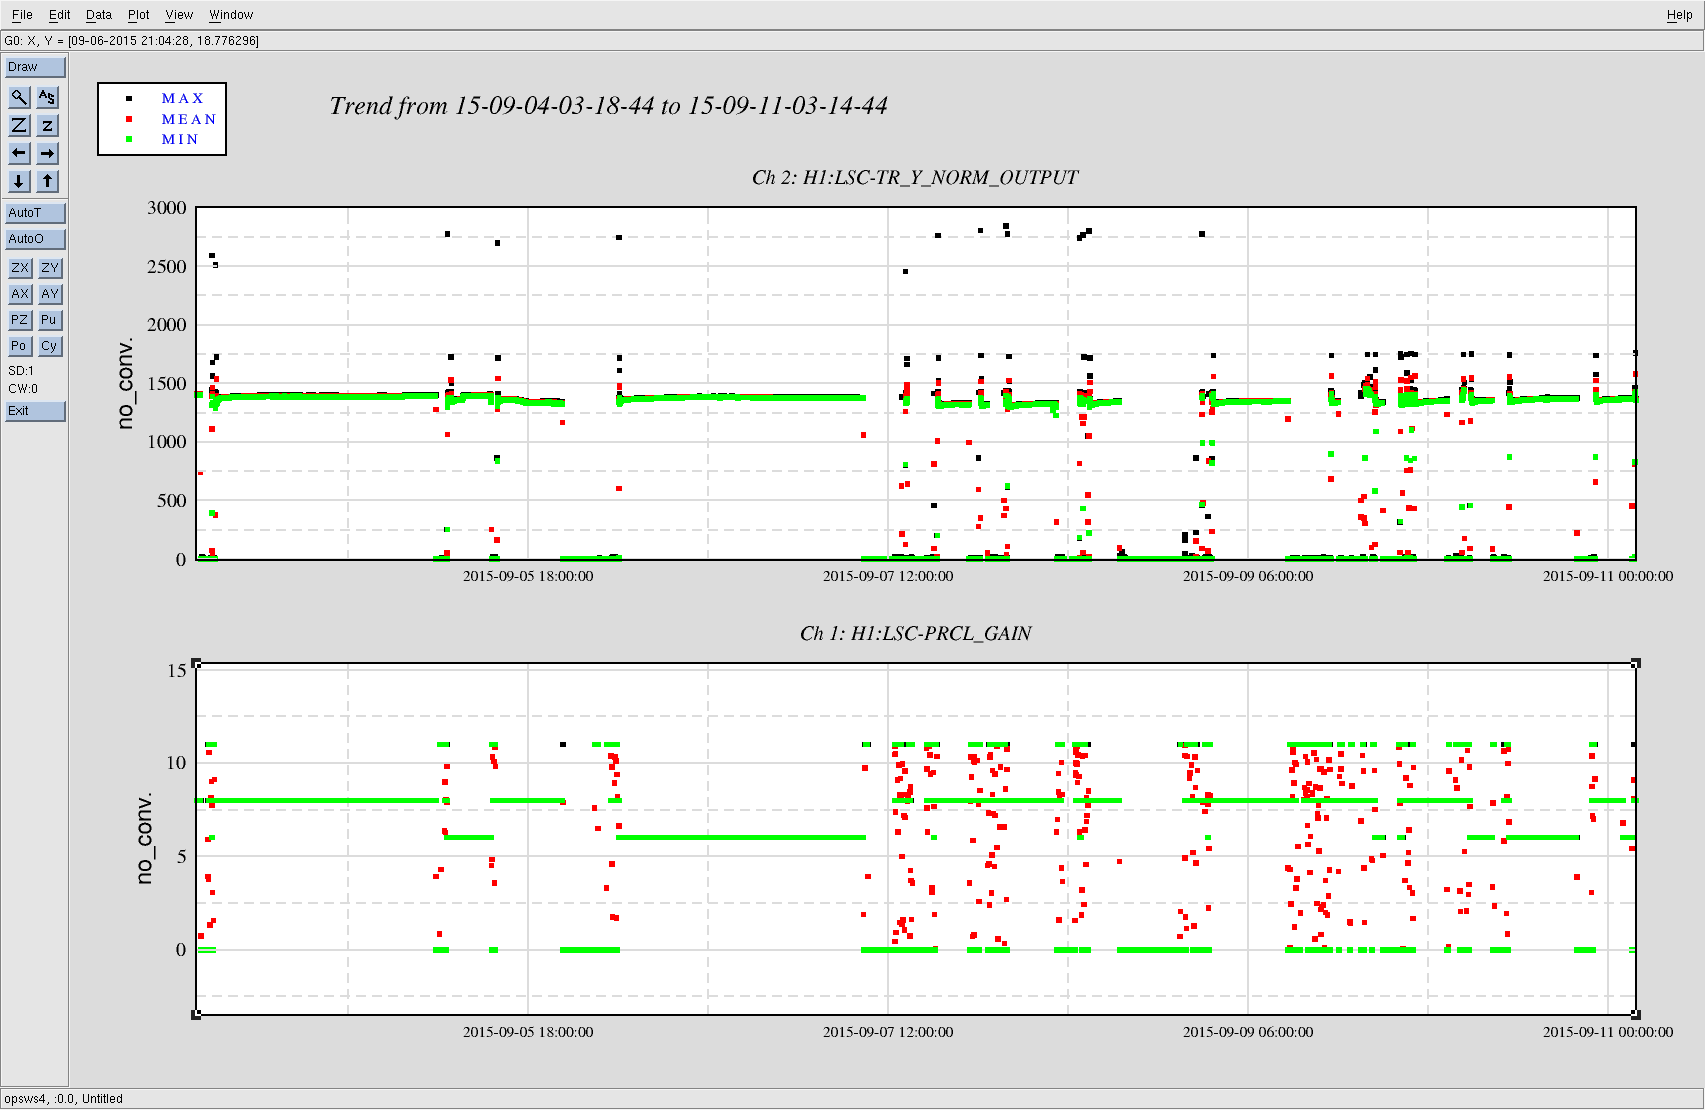
As part of my clearing of SDF earlier (alog 21387), I found that the LSC-PRCL_GAIN did not match the value in the observe.snap file.
The gain is set to 8 during the DRMI acquisition, but then is supposed to be changed to 6 during CARM_15PM in the CARM offset reduction sequence in the ISC_GUARDIAN. This change is supposed to happen during the run part of the state, after some timers have completed, and after some other things have finished. However, the conditional for exiting the state didn't include a "if self.counter == 1" statement, so depending on which of 2 timers finished first, we either would or would not change the PRCL gain. Thumbs down to that.
As can be see in the plot from Evan below, over the last week some of our long locks have had a PRCL gain of 6, and others have had a gain of 8. Not good.
I fixed the conditional, so now it will always change the PRCL gain appropriately before exiting the CARM_15pm state. We reloaded the guardian at 03:24 UTC.
Generally a good first half of the shift. Commissioning work was successful. Wind speed and seismic activity low.Had a ~4 hour lock at 68+Mpc
Lost lock at 02:50 - cause unknown - Relocked and in Observing mode at 03:16.

NOTE: Commissioners reloaded Guardian code at 03:24 and the IFO did not drop out of Observing Mode.
Jeff, Darkhan, Sudarshan, Craig, Kiwamu,
(Verification measurement)
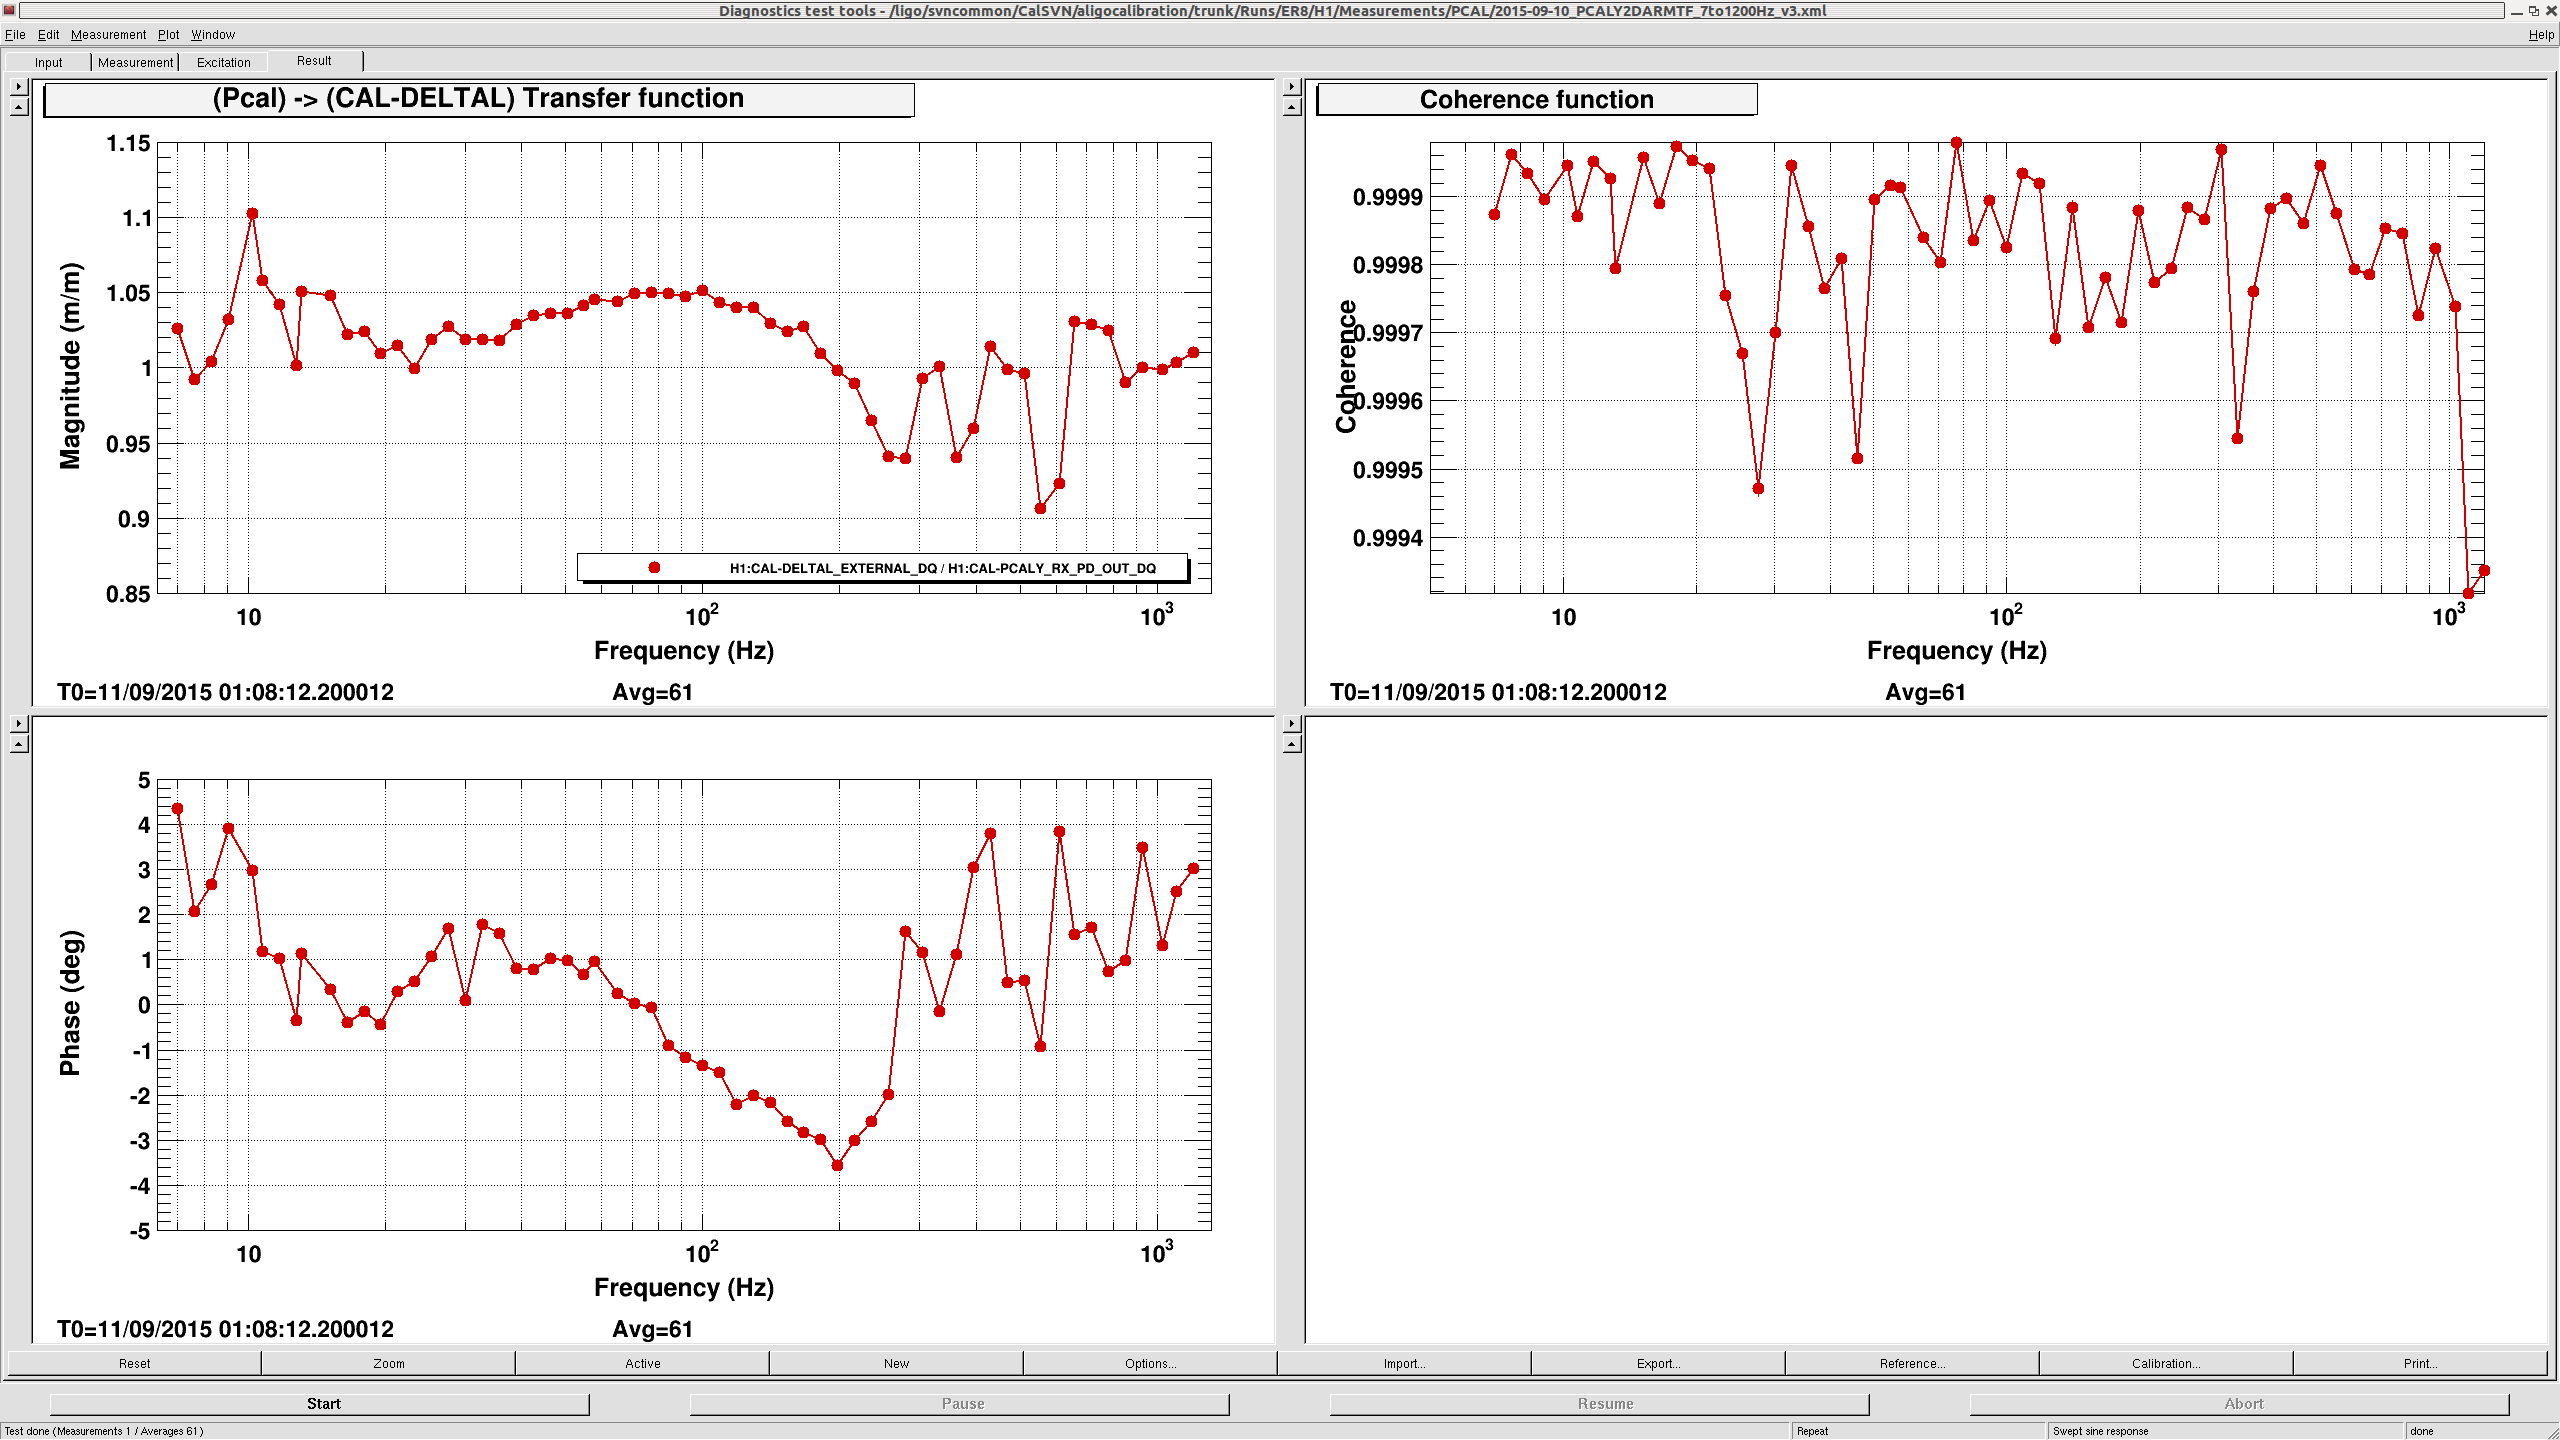
The above screen shot shows a measured transfer function from displacement estimated by Pcal Y to displacement estimated by CAL-CS. They agree within +/- 10 % in magnitude and +/- 5 deg in phase all across the frequency band we swept. Note that one data point at 10 Hz showed magnitude that is slightly above 10%, but this was not repeatable and therefore we don't think it is a reliable data point. We measured the same transfer function three times within the same lock stretch and saw the magnitude changing to a value between 0.85 and 1.1 at this particular frequency point. We are guessing that this is due to a bounce mode confusing our measurement.
Also, even though the coherence was high all across the frequency band, the data points below 30 Hz seemed to change in magnitude in every sweep. So we increased the integration time from 3 sec to 6 sec which seemed to improved the flatness.
The optical gain was adjusted by measuring the sensing function with a Pcal sweep within the same lock stretch. This gave me a 341 Hz cavity pole (which is the same as two nights ago, alog 21352) and an optical gain of 8.834e-7 meters/counts. Both the parameters are now loaded into the CALCS foton file and enabled.
(Phase correction)
Sudarshan will make a separate alog on this topic, but a trick to get this beautiful plot was to properly incorporate the know time delays. Based on our knowledge, we have included a 115 usec = (41 + 61 + 13 usec) time delay. If we did not remove the delay, the phase would have been off by 40 deg at 1 kHz.
(An extra measurement)
Independently of the calibration validation measurement, we did a simple measurement -- check the binary range with and without the calibration lines. Here is the relevant time stamps:
We will check the range later.
All the data are accessible at the following SVN locations:
DARM open loop measurements
aligocalibration/trunk/Runs/ER8/H1/Measurements/DARMOLGTFs/2015-09-10_H1_DARM_OLGTF_7to1200Hz.xml
aligocalibration/trunk/Runs/ER8/H1/Measurements/DARMOLGTFs/2015-09-10_H1_DARM_OLGTF_7to1200Hz_halfamp.xml
For the analysis, I have used the first measurement. The second measurement was meant to assess repeatability of the measurement by applying the half size of the usual excitation in DARM.
Pcal to DARM responses:
aligocalibration/trunk/Runs/ER8/H1/Measurements/PCAL/2015-09-10_PCALY2DARMTF_7to1200Hz.xml
aligocalibration/trunk/Runs/ER8/H1/Measurements/PCAL/2015-09-10_PCALY2DARMTF_7to1200Hz_v2.xml
aligocalibration/trunk/Runs/ER8/H1/Measurements/PCAL/2015-09-10_PCALY2DARMTF_7to1200Hz_v3.xml
The final plot, that I have posted above, is from the third measurement in which I have doubled the integration time in order to obtain better signal-to-noise ratio.
DARM paramter file (as reporeted in alog 21386):
aligocalibration/trunk/Runs/ER8/H1/Scripts/DARMOLGTFs/H1DARMparams_1125963332.m
On 2015-09-12 06:30:00, the gain from the DCPD sum to DARM IN1 was 3.477×10⁻⁷ ct/mA. Therefore, using Kiwamu's number of 8.834×10⁻⁷ m/ct, this gives the optical gain as 3.26 mA/pm. (One stage of DCPD whitening.)
Betsy, Hugh
There are some channels which we have identified with SDF that change between lock stretches and should therefore be not monitored. So far, Hugh and I have set the foolwing to not be monitored:
- SR3 CAGE SERVO OFFSET -SR3_M2_TEST_P_OFFSET)
- BSC ISI CPS SETPOINTS_NOW
- IMC PZT P/Y OFFSETS
- LSC PSL-POWER_SCALE_OFFSET
- ALS CAMERA SERVO SETTINGS (ALS_CAM)
- PSL-ISS_REFSIGNAL and PSL-ISS_SECONDLOOP_REF_SIGNAL_ANA
We have not set the alignment sliders to be NOT MONitored so be prepared to set those tonight as needed:
ALL SUS OPTICALIGN P/Y OFFSETS
Again, if you run into problems with red alarms on any SDF screen that is blocking you from hitting the Intent bit, please 1) check with your commissioners to clear any temporary changes and then 2) set the outstanding channels to NOT MON and we will audit them tomorrow when we continue on this work.
In prep for going to Observe this evening, I NOT MONed a few channels. All of these should stay NOT MONed.
In addition, the new epoch of SDF caught something, that we may not have caught without it. See alog 21389 for details, but the LSC-PRCL gain was not correct. It was reverted by hand, and then the guardian bug was fixed. We used to have this channel "NOT MON"ed by SDF (since it is changed by guardian), which is likely why we haven't noticed this before.
Dan, Evan
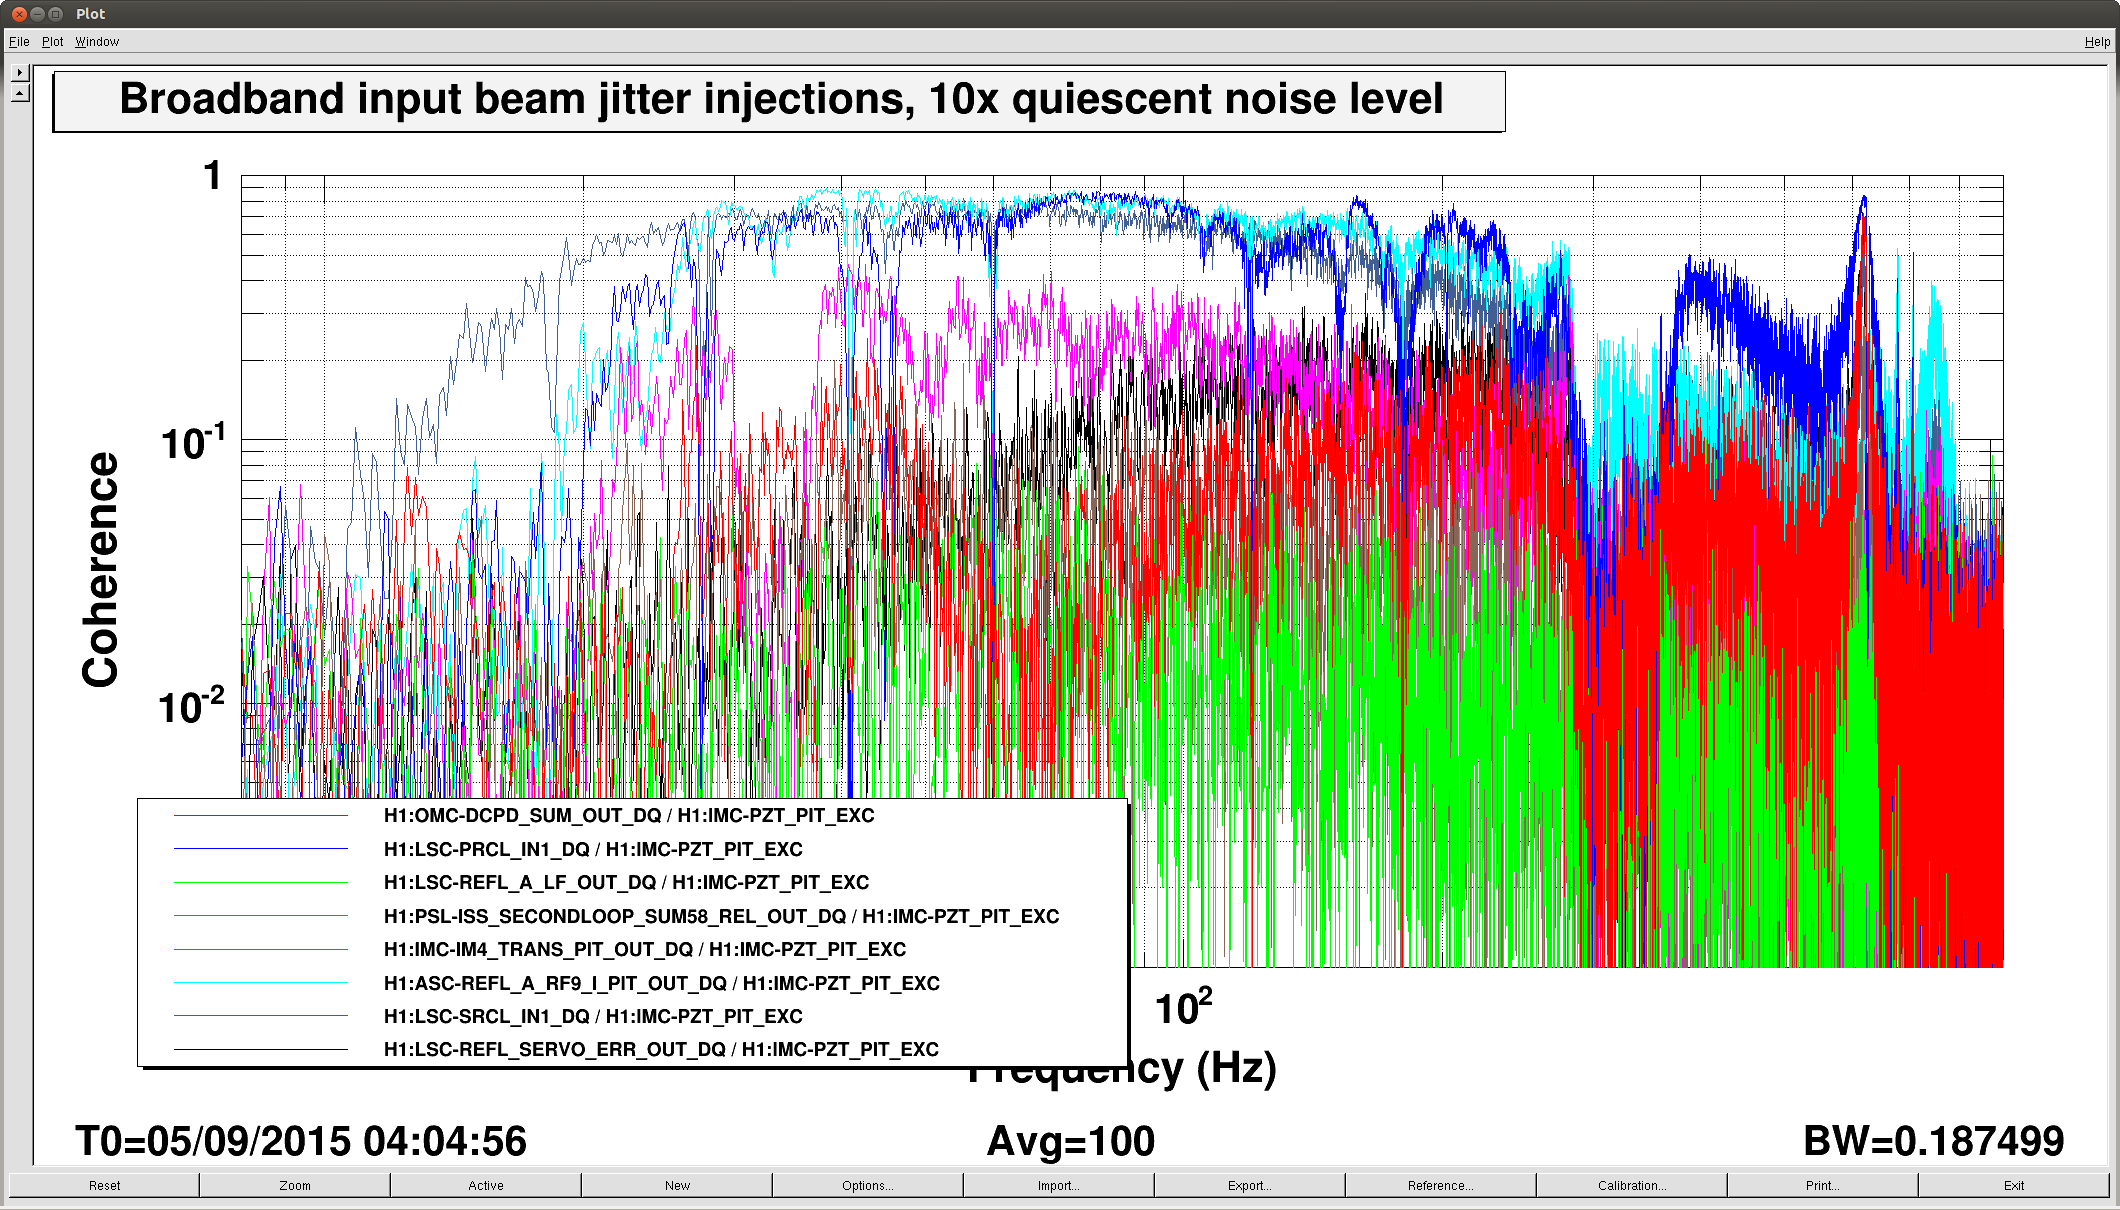
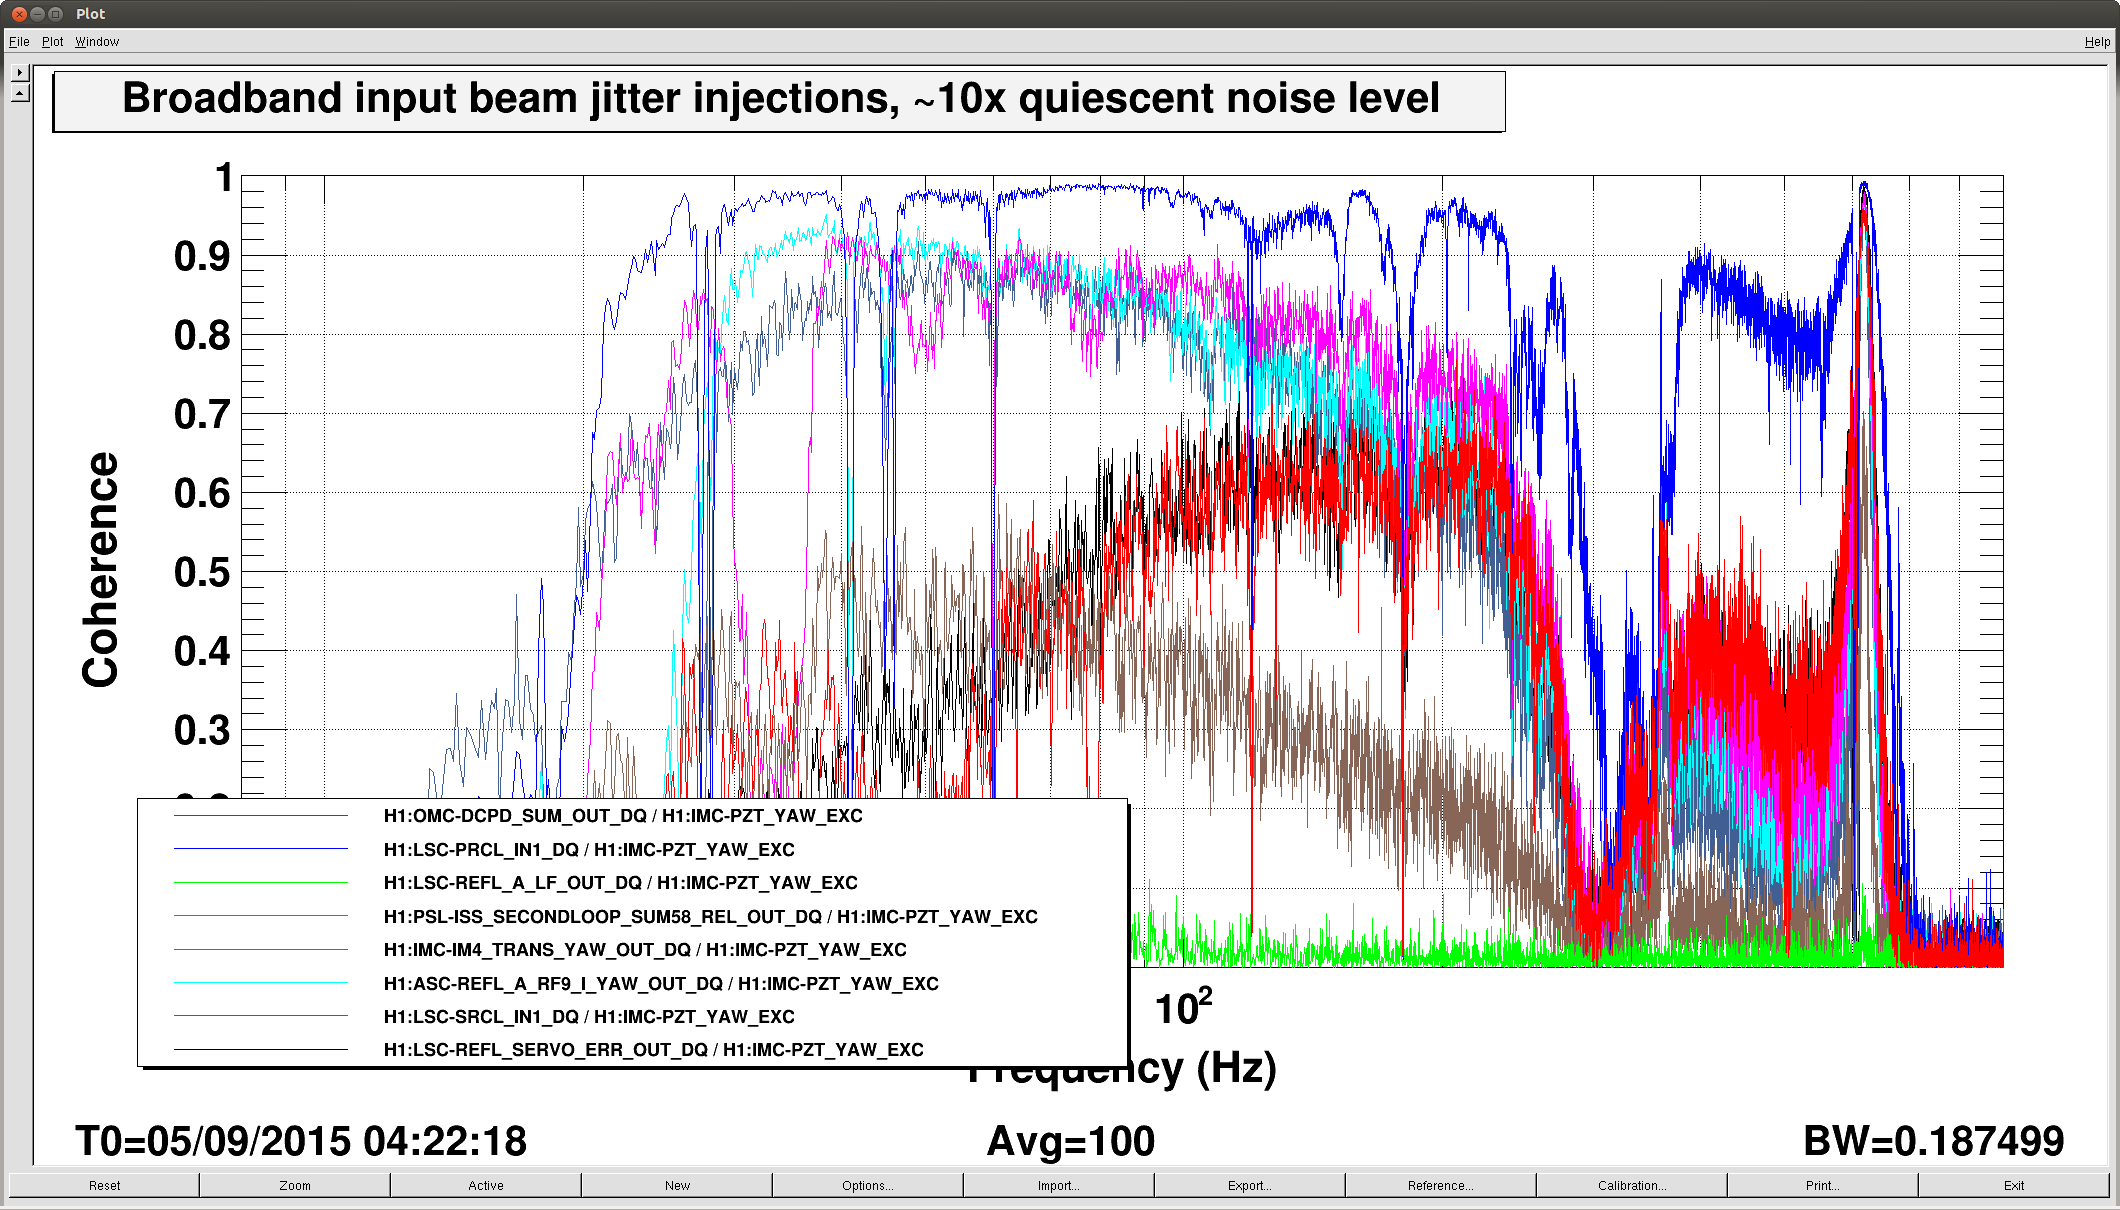
This evening we made a qualitative study of the coupling of beam jitter before the IMC into DARM. This is going to need more attention, but it looks like the quiescent noise level may be as high as 10% of the DARM noise floor around 200Hz. While we don't yet understand the coupling mechanism, this might explain some of the excess noise between 100-200Hz in the latest noise budget.
We drove IMC-PZT with white noise in pitch, and then yaw. The amplitude was chosen to raise the broadband noise measured by IMC-WFS_A_I_{PIT,YAW} to approximately 10x the quiescent noise floor. This isn't a pure out-of-loop sensor, and since we were driving the control point of the DOF3 and DOF5 loops of the IMC alignment channels we will need to work out the loop suppression to get an idea of how much input beam motion was being generated. Unfortunately we don't have a true out-of-loop sensor of alignment before the IMC. We may try this test again with the loops off, or the gain reduced, or calibrate the motion using the IMC WFS dc channels with the IMC unlocked. Recall that Keita has commissioned the DOF5 YAW loop to suppress the intensity noise around 300Hz.
The two attached plots show the coherence between the excitation channel (PIT or YAW) and various interferometer channels. The coupling from YAW is much worse: at 200Hz, an excitation 10x larger than normal noise (we think) generates coherence around 0.6, so the quiescent level could generate a few percent of the DARM noise. Looking at these plots has us pretty stumped. How does input beam jitter couple into DARM? If it's jitter --> intensity noise, why isn't it coherent with something like REFL_A_LF or POP_A_LF (not shown, but zero)?
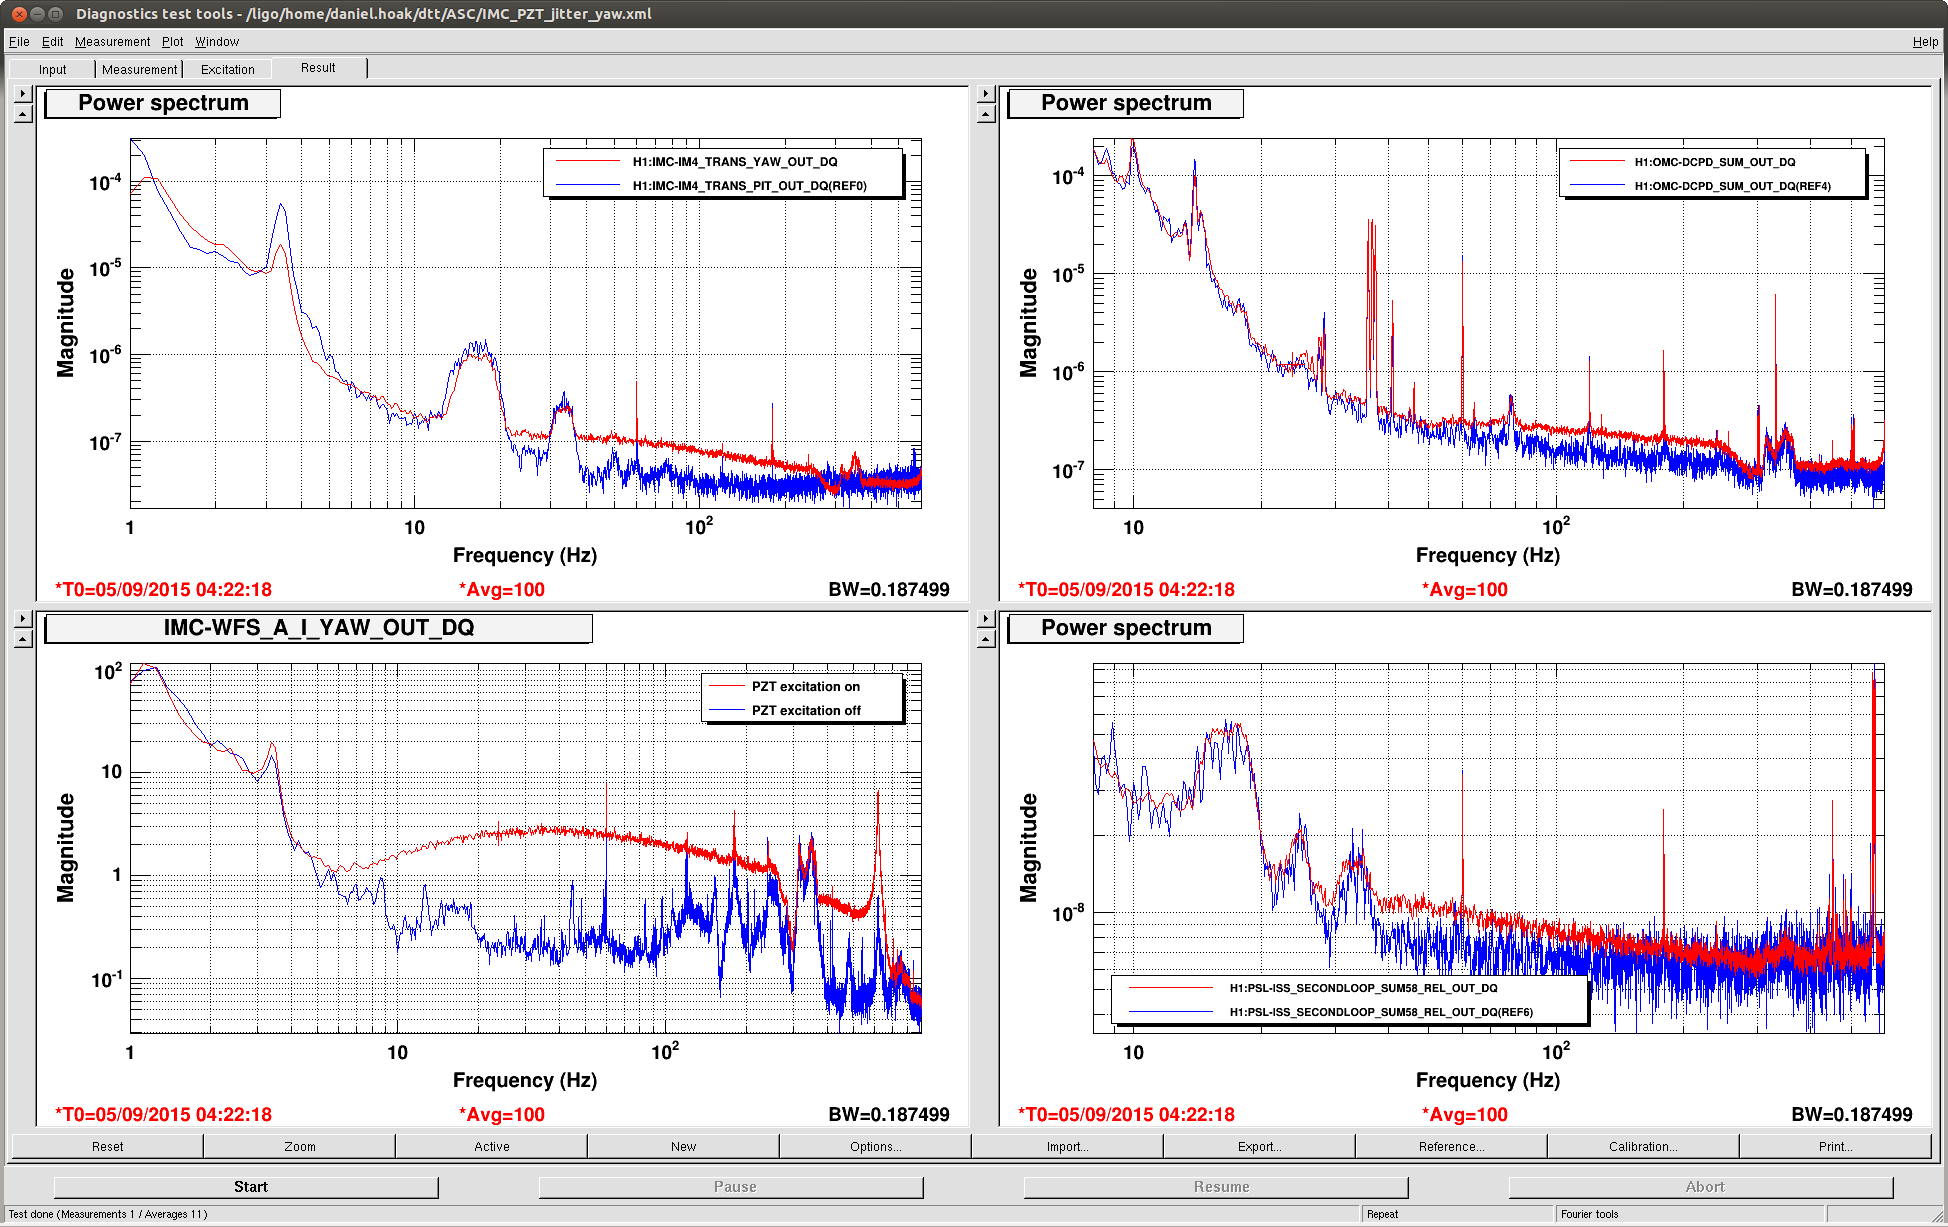
The third plot is a comparison of various channels with the excitation on (red) and off (blue). Note the DCPD sum in the upper right corner. Will have to think more about this after getting some slpee.
Transfer function please.
TFs of the yaw measurement attached.
If the WFS A error signal accurately represents the quiescent yaw jitter into the IMC, the orange TF suggests that this jitter contributes the DCPD sum at a level of 3×10⁻⁸ mA/Hz1/2 at 100 Hz, which is about a factor of 6 below the total noise.
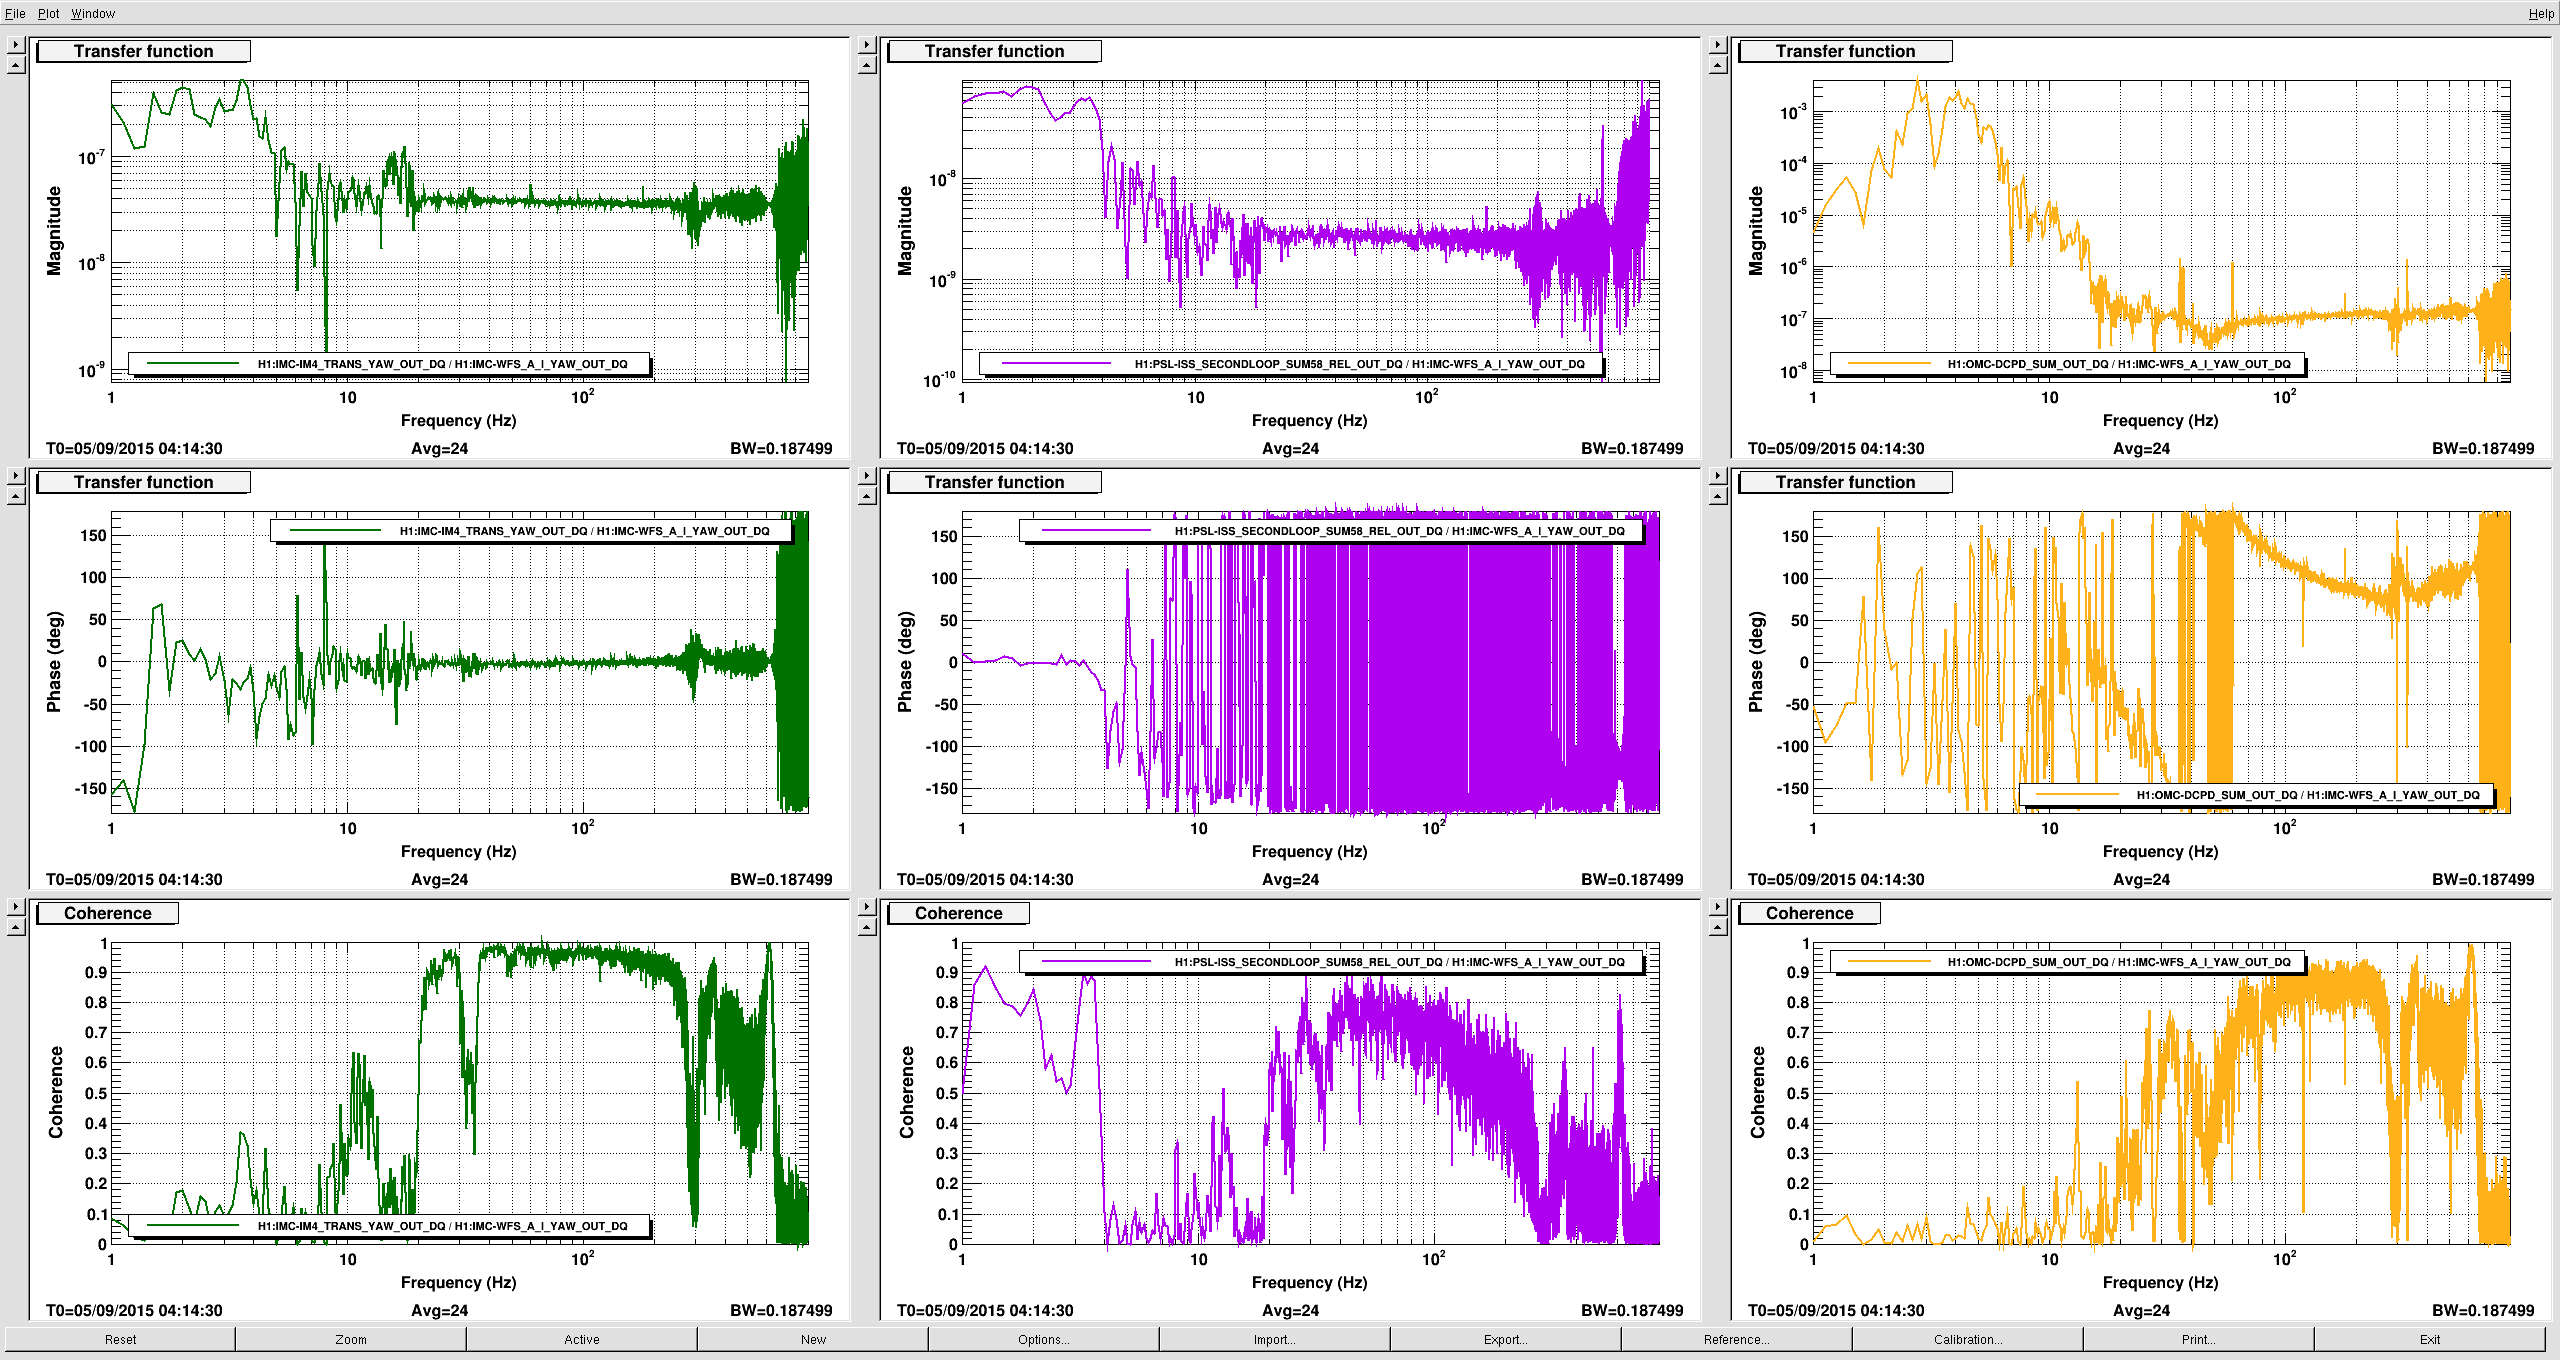
Using this measured WFS A yaw → DCPD sum TF, I projected the noise from WFS A onto the DARM spectrum (using data from 2015-08-27). Since the coupling TF was taken during a completely different lock stretch than the noises, this should be taken with a grain of salt. However, it gives us an idea of how significant the jitter is above 100 Hz. (Pitch has not yet been included.)
PIT coupling per beam rotation angle is a factor of 7.5 smaller than YAW:
https://alog.ligo-wa.caltech.edu/aLOG/index.php?callRep=21212
Re: "How does beam jitter couple to DARM?" : jitter can couple to DARM via misalignments of core optics (see https://www.osapublishing.org/ao/abstract.cfm?uri=ao-37-28-6734).
If this is the dominant coupling mechanism, you should see some coherence between a DARM BLRMS channel where this jitter noise is the dominant noise (you may need to drive jitter with white noise for this) and some of the main IFO WFS channels.
The BLRMS in the input beam jitter region (300-400 Hz) is remarkably stable over each lock (see my entry here), so there seems to be no clear correlation with residual motion of any IFO angular control.
Thanks for the link to that post, I hadn't seen it. It may still be possible though that there's some alignment offset in the main IFO that couples the jitter to DARM (i.e. a DC offset that is large compared to residual motion – perhaps caused by mode mismatch + miscentering on a WFS). This could be checked by putting offsets on WFS channels and seeing how the coupling changes.


