Dan, Daniel, Evan
Summary
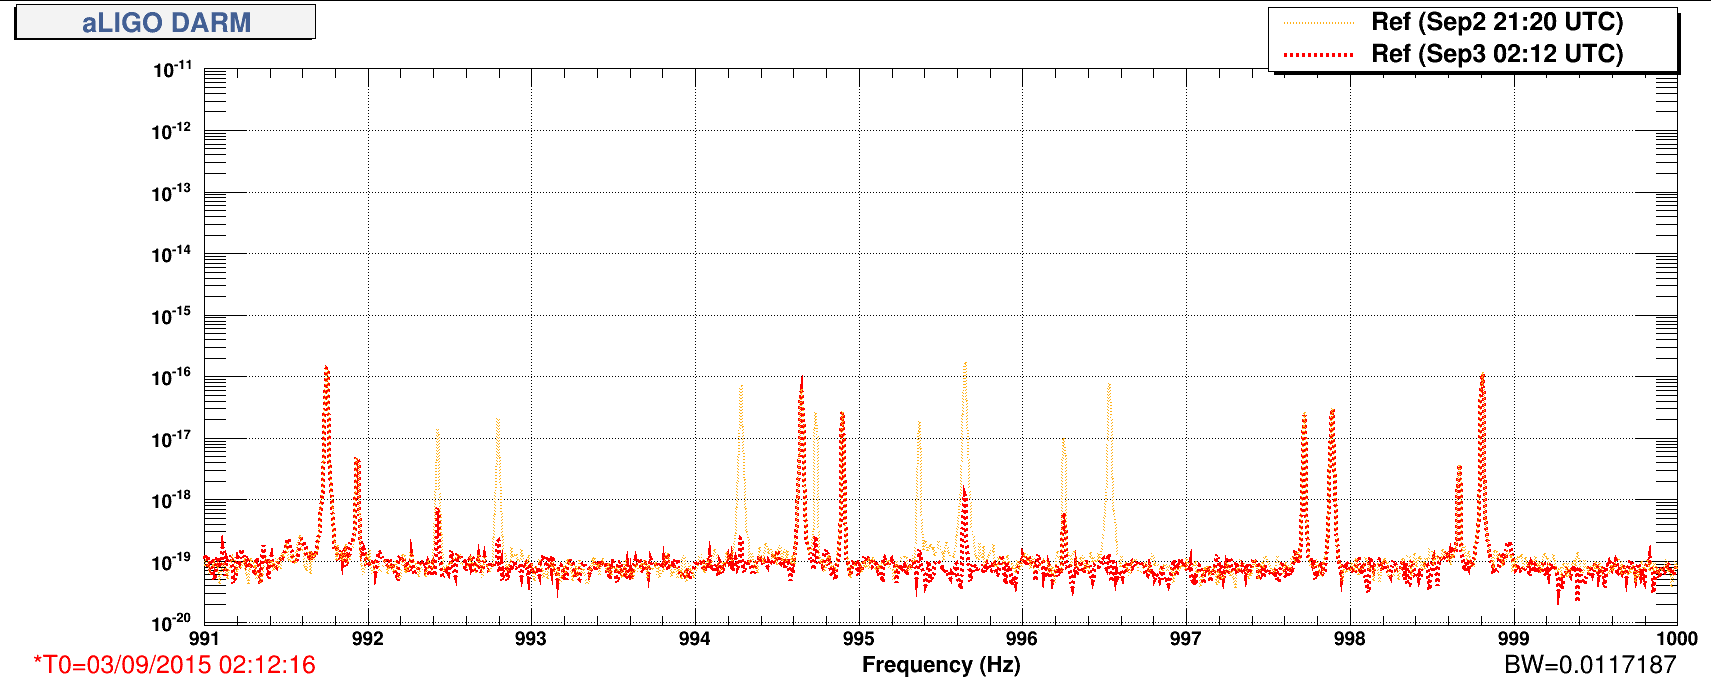
The addition of a 9.1 MHz bandpass on the OCXO output has removed the broadband excess noise between DCPD sum and null. The dashed lines in the figure show the sum and the null as they were three days ago (2015-08-31 7:00:00 Z), while the solid lines show the sum and the null after the filter was inserted.

Details and review
Since at least June (probably longer), we've had a broadband excess noise between the sum and null DCPD streams. Stefan et al. identified this as 45.5 MHz oscillator noise a few weeks ago (20182).
In parallel, we switched the 9 MHz generation from an IFR to the OCXO (19648), and we installed Daniel's RFAM driver / active suppression circuit (20392), but the excess noise remained (20403). For a while we suspected that this was 45.5 MHz phase noise (and hence not supressed by the RFAM stabilization), but the shape and magnitude of the oscillator phase noise coupling (20783) were not enough to explain the observed noise in the DCPDs, under the assumption that the OCXO phase noise is flat at high frequencies (20582). For that matter, the shape and magnitude of the oscillator amplitude noise coupling were also not enough to explain the observed noise in the DCPDs, assuming a linear coupling from the RFAM (as sensed by the EOM driver's OOL detector) (20559).
Daniel et al. looked at the 45.5 MHz spectrum directly out of the harmonic generator in CER, and found that most of the noise is actually offset from the 45.5 MHz carrier by 1 MHz or so (20930), which is above the bandwidth of the RFAM suppression circuit. This suggested that the noise we were seeing in the DCPDs could be downconvered from several megahertz into the audio band.
Yesterday there was a flurry of work by Keita, Fil, Rich, et al. to find the source of this excess noise on the 45.5 MHz (21094 et seq.). Eventually we found circumstantial evidence that this excess noise was caused by baseband noise out of the 9.1 MHz OCXO.
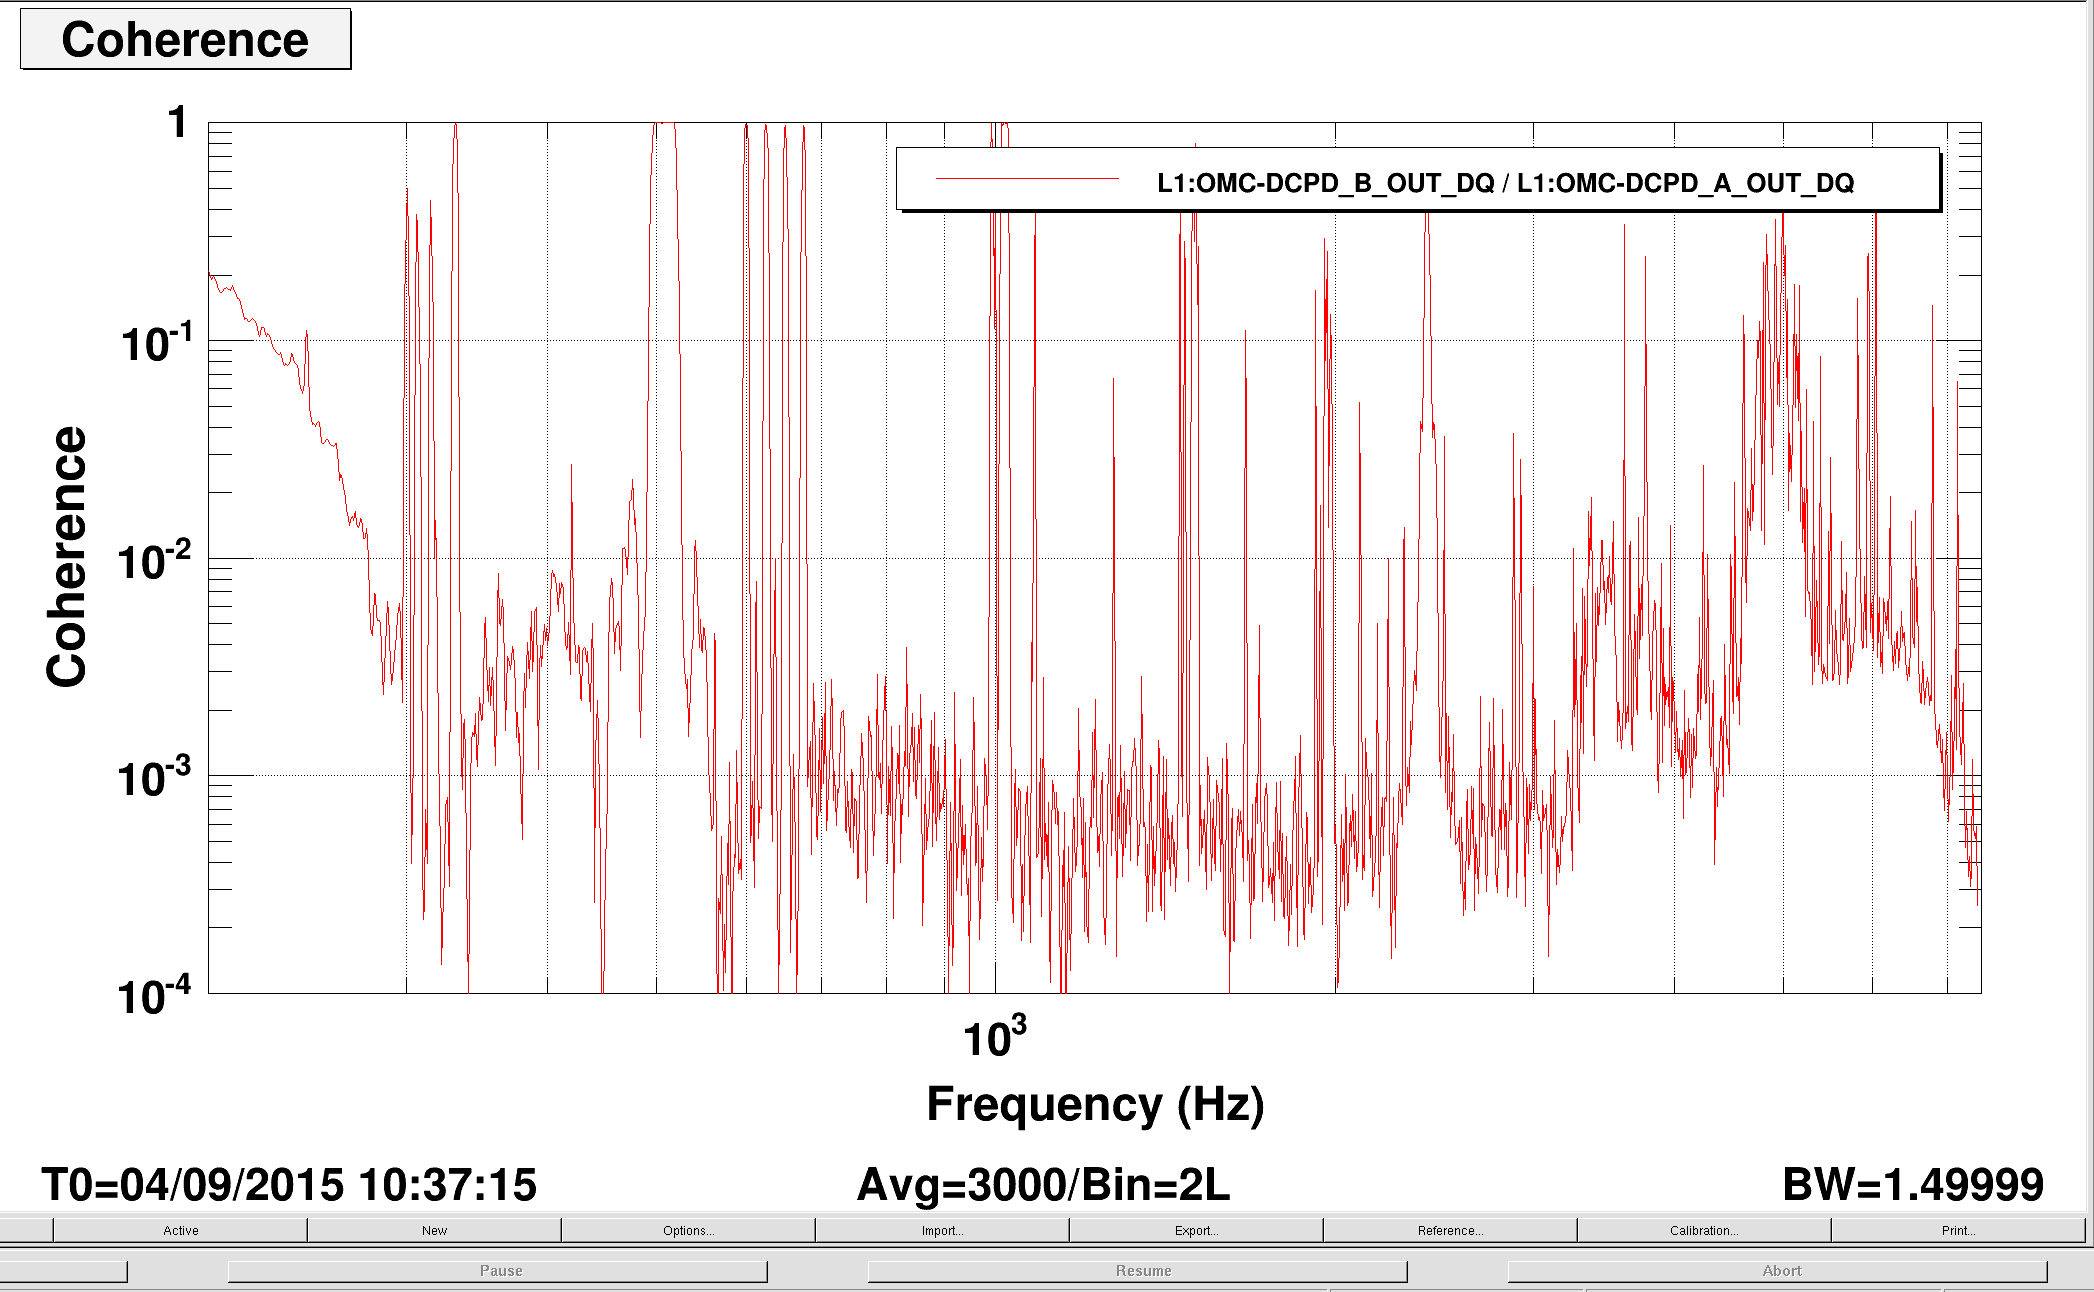
Tonight we installed a 9.1 MHz bandpass filter on the OCXO output. This has removed the huge 1 MHz sidebands on the 45.5 MHz signal, and it also seems to have greatly lowered the coherence between DCPD A and DCPD B above a few hundred hertz.
Loose ends
The chain from OCXO to filter to distribution amplifier currently involves some BNC, since we could not find the right combination of threaded connectors to connect the filter to the amplifier. This should be rectified.
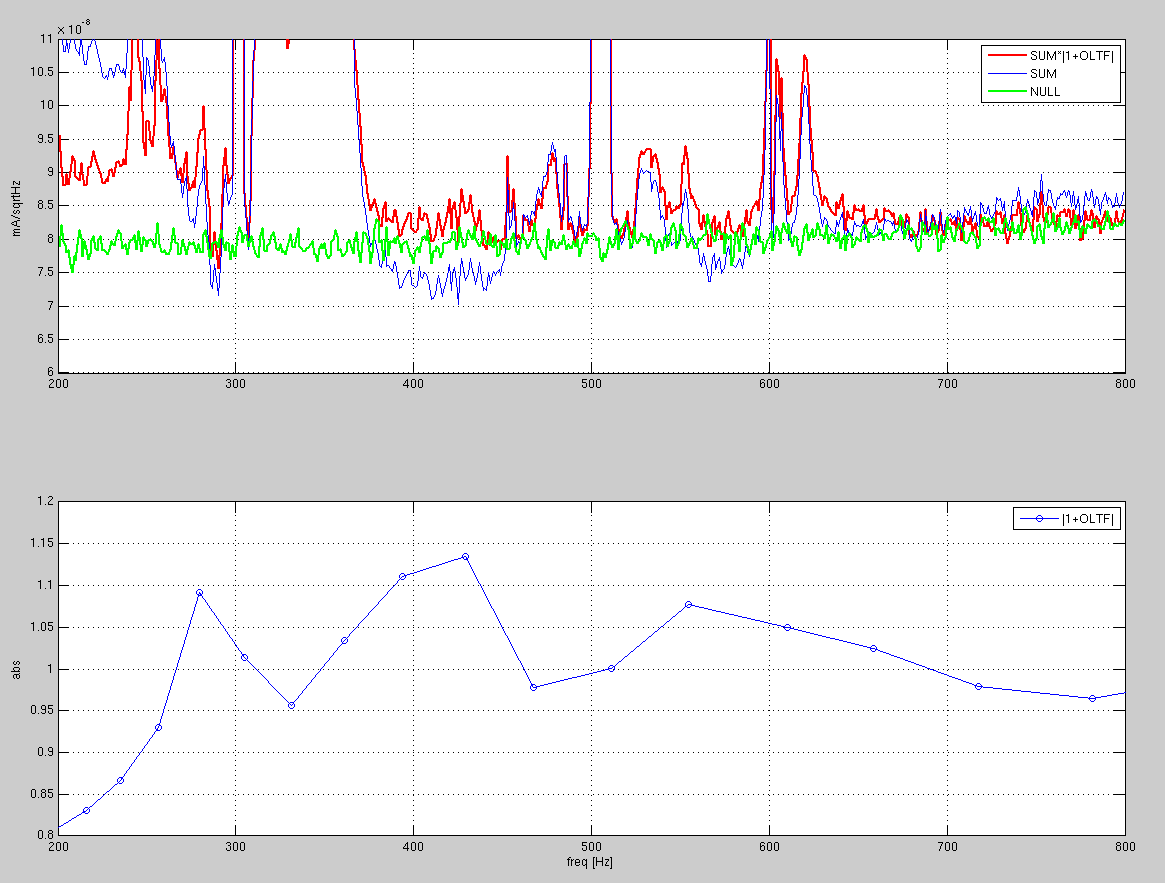
Also, it appears that our sum is lower than our null in a few places (400 Hz in particular), which deserves some investigation.


"NULL>SUM" problem is just DARM loop. You're talking about 10%-ish difference, and DARM OLTF gain is still 0.1-0.2 at 400Hz.
See attached.
I don't know how to obtain official DARM OLTF model, so I just took 2015-08-29_H1_DARM_OLGTF_7to1200Hz_tf.txt in
/ligo/svncommon/CalSVN/aligocalibration/trunk/Runs/ER8/H1/Measurements/DARMOLGTFs/
The coherence for this OLTF measurement was much larger than 0.95 for the entire frequency range shown on the plot.
On the bottom is |1+OLTF|. I interpolated this to the frequency spacing of SUM and NULL spectra, and plotted SUM*|1+OLTF|, SUM, and NULL at the top.
Note that DARM OLTF template measures -1*OLTF.
Nice work. After O1 we can figure things out now you have narrowed it down.
Nice work!
 Great job!

Following up on the discussion during the commissioning meeting today, at LLO Evan's equivalent plot of the coherence between the two OMC PDs is already below 10^-3 (below 3 kHz).
Fil and I replaced the BNC cable with an SMA/N cable.

 .
.