stefan.ballmer@LIGO.ORG - posted 23:50, Saturday 15 August 2015 - last comment - 21:46, Sunday 16 August 2015(20560)
Calibration: Suggestion for ESD drive strangth monitoring
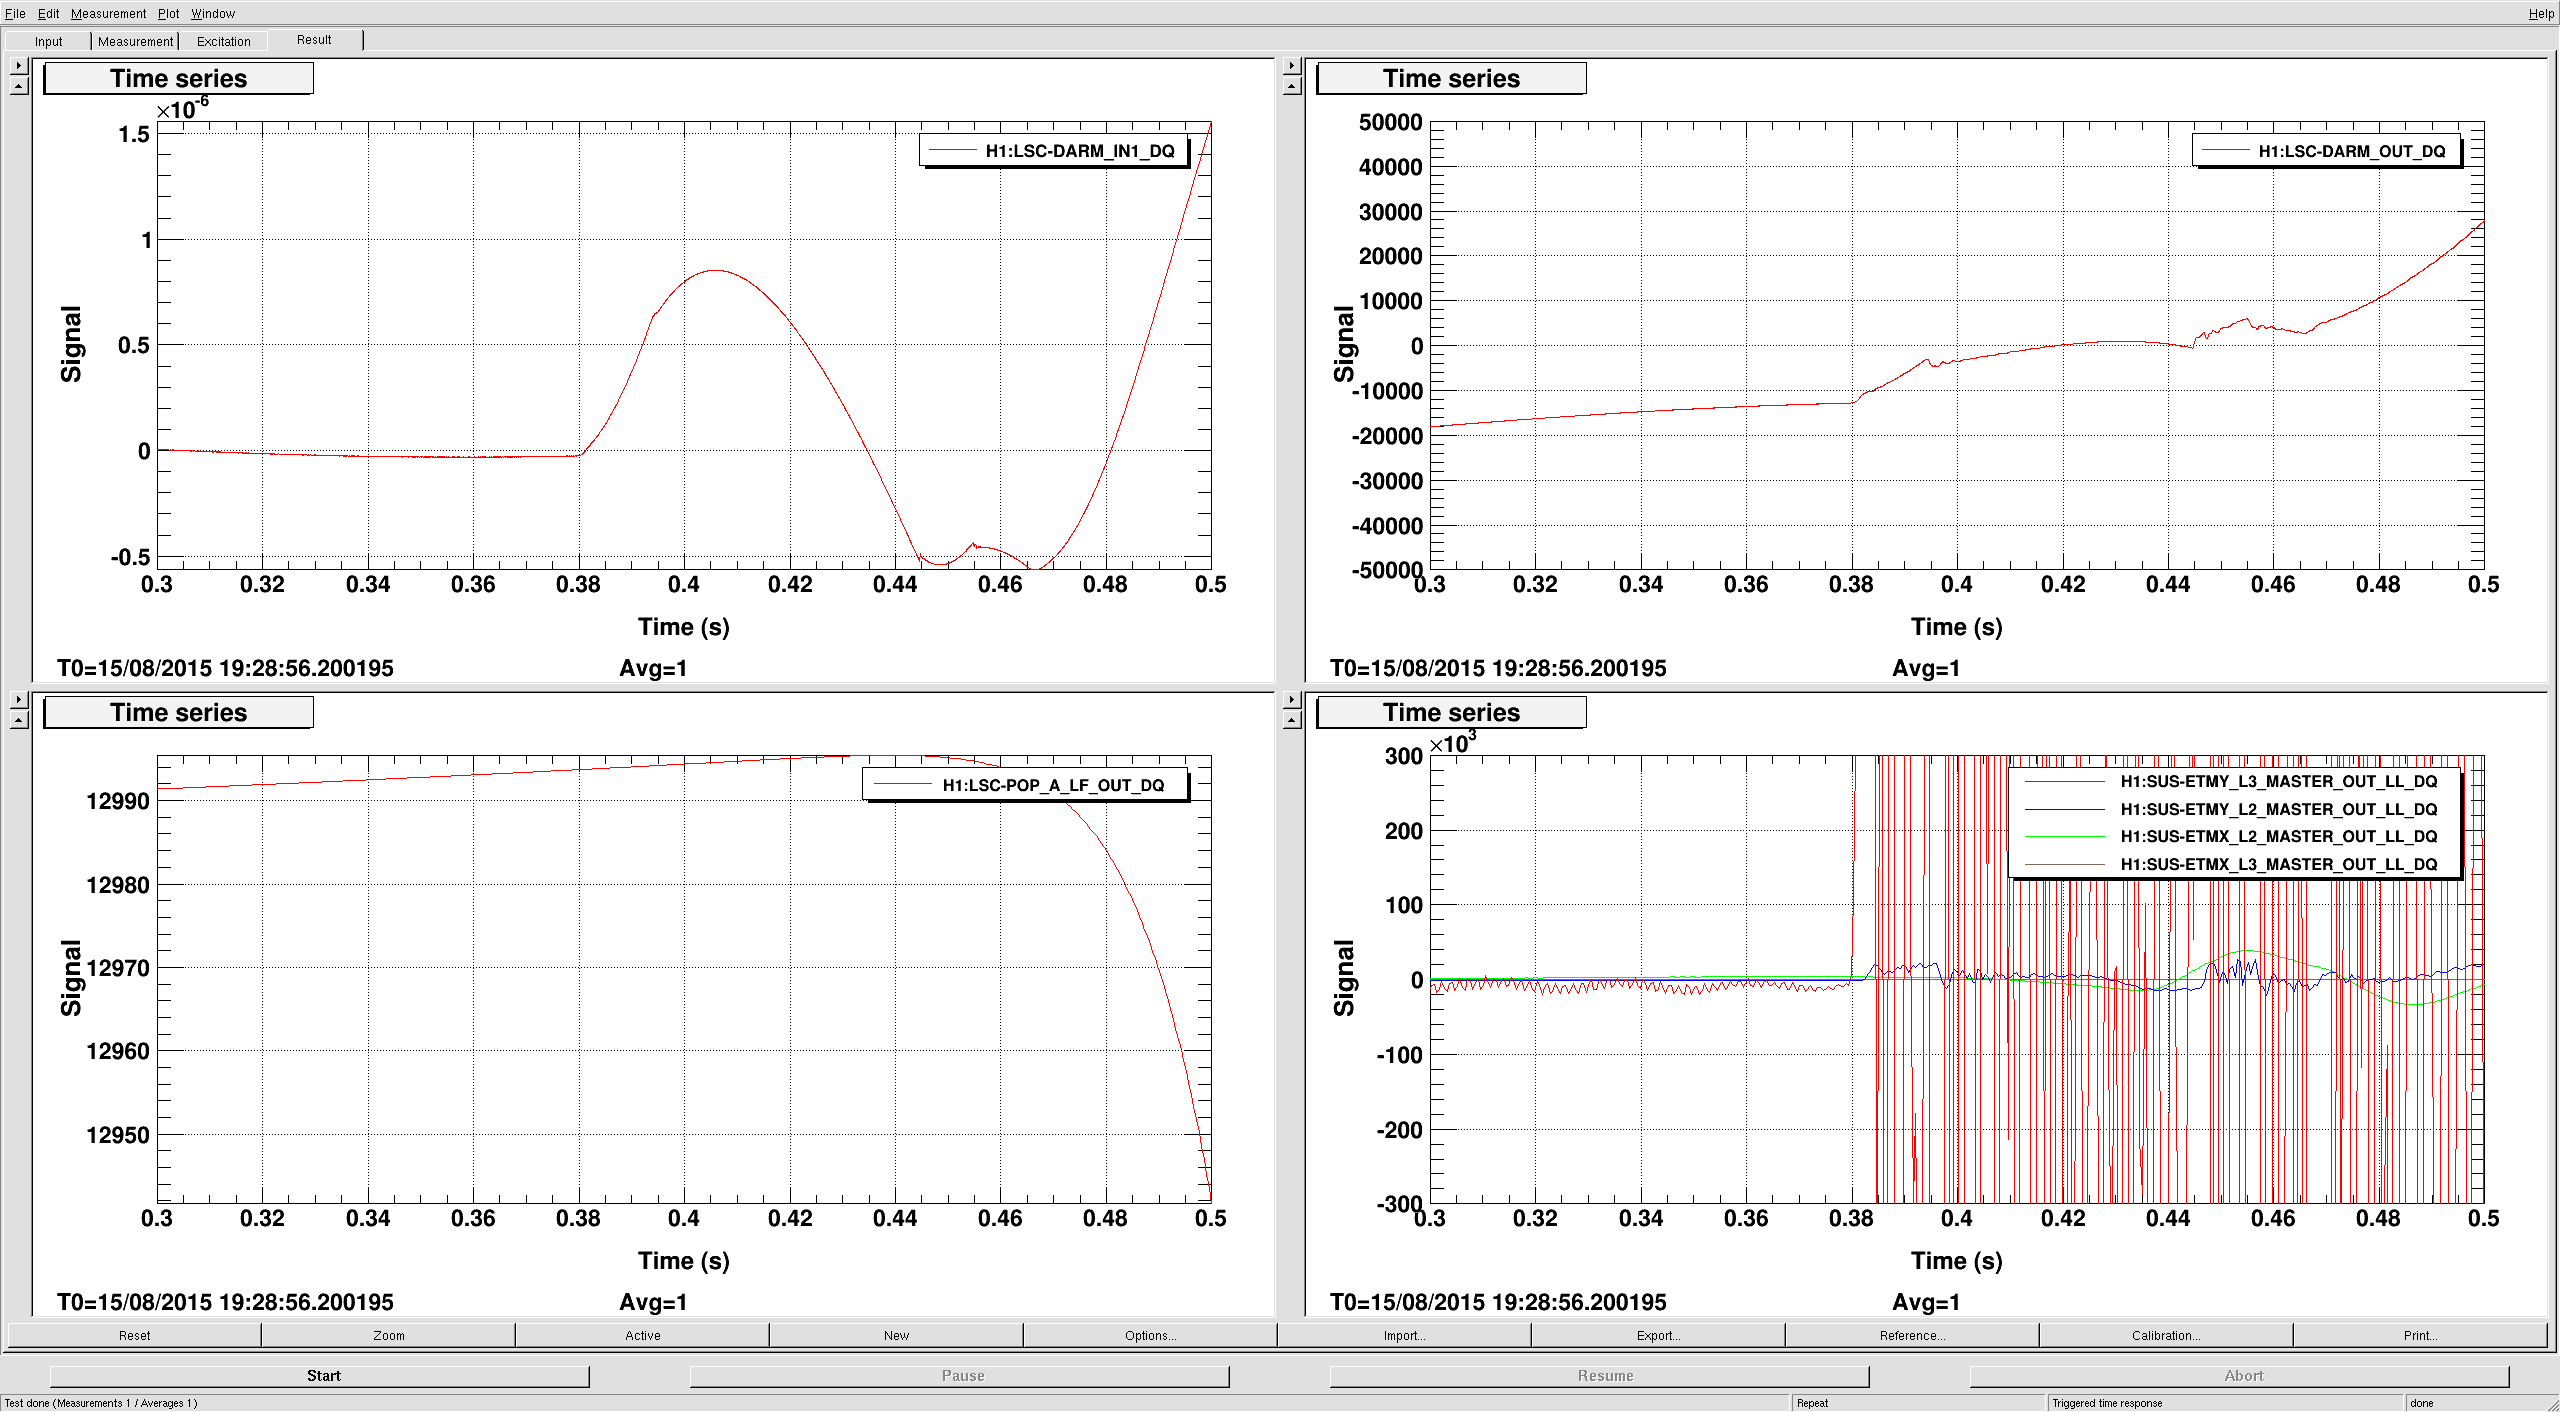
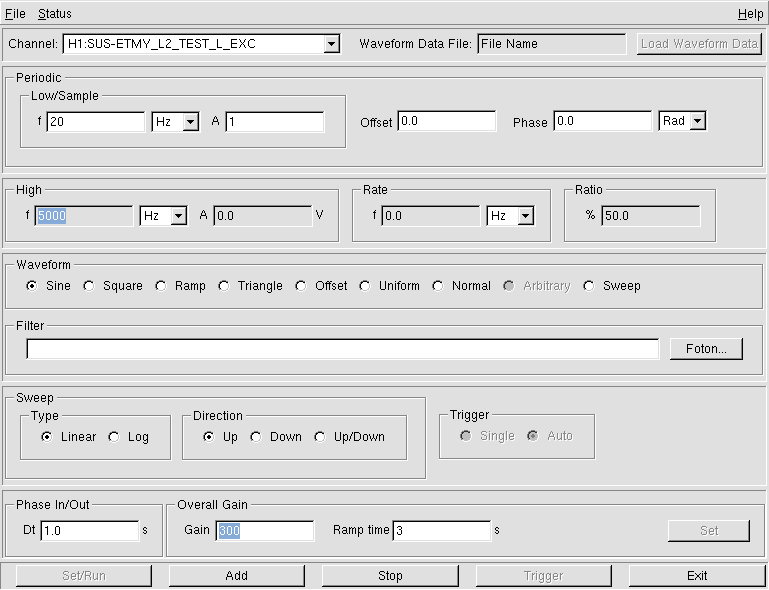
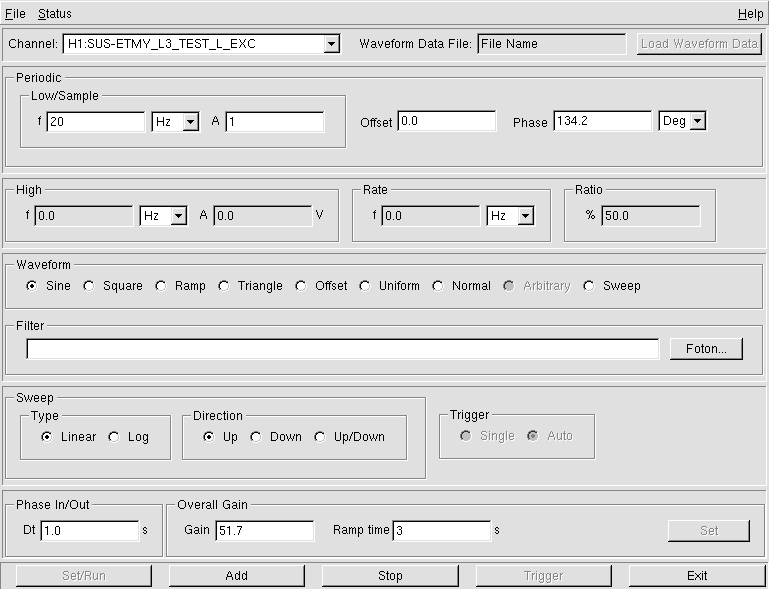
I made the suggestion before, but today I actually tried it:

By driving both L2 and L3 at a fixed frequency, but with a gain and phase such that their contribution cancelers in DARM, we can easily monitor (and servo, if we want) the ESD drive strength, which is expected to vary with charging.

This method has the big advantage that there are NO LARGE cal line resulting in DARM.

Here are the settings I tried:
- H1:SUS-ETMY_L2_TEST_L_EXC: drive with 300 cts at 20Hz, phase   0  deg
- H1:SUS-ETMY_L3_TEST_L_EXC: drive with 51.7cts at 20Hz, phase 134.2deg

The resulting line in DARM is only ~0.016 times the size of the line with only 1 drive. I also used the H1:SUS-ETMY_L2_DAMP_MODE7_BL filter bank to monitor the line strength. This suggests we should get on the order of 1% monitoring precision on a few second time scale - all while only producing the tiniest peak in DARM - with no up-conversion feet.

Also - since the biggest variation we see is on the microseism time scale - we should try the ESD linearization..
Images attached to this report
Comments related to this report
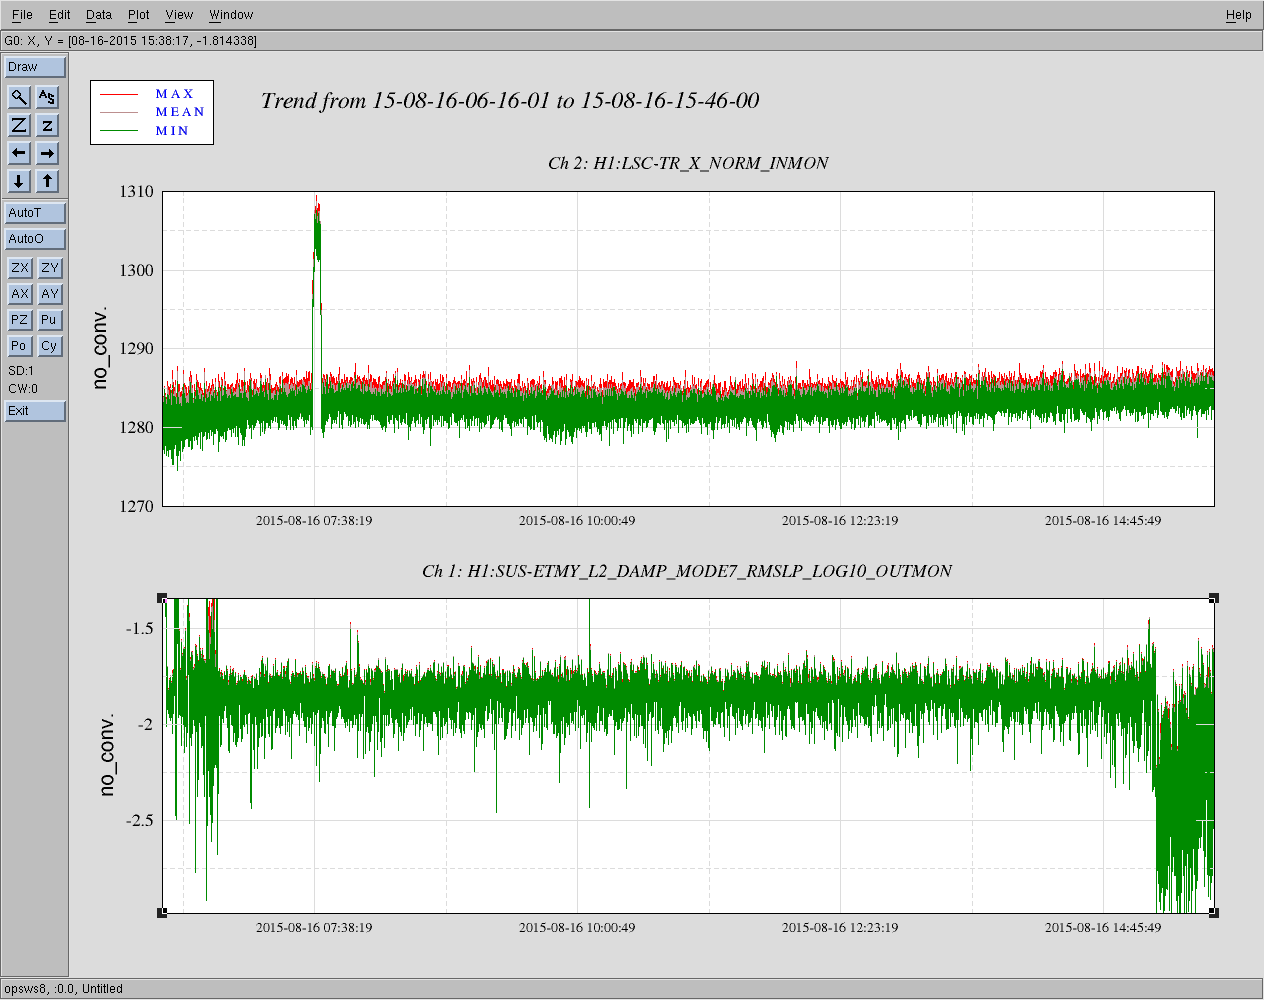
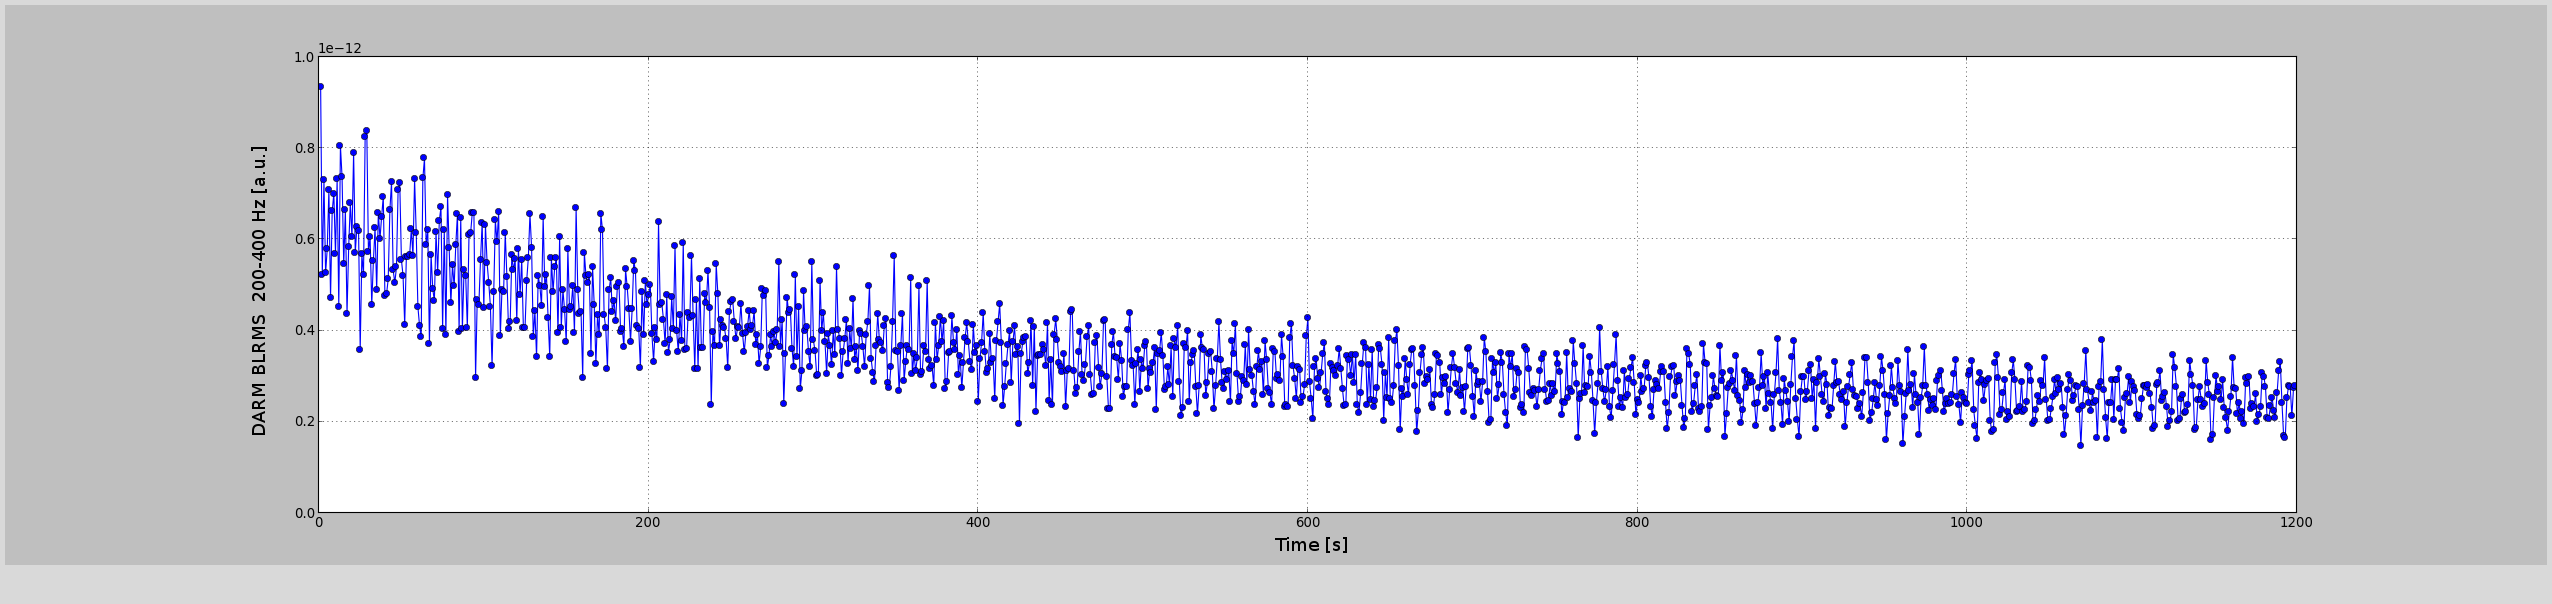
Attached is a time series plot of the logarithmic line strength at 20Hz. The line stayed below 10^(-1.7) for the whole 9h30min of the lock, suggesting the ESD drive never changed more than 2%.

- The surge in arm power early on was due to a test Evan did.
- The odd drop at the end corresponds to when the data got glitchy - not sure what happened there...
Images attached to this comment