JeffreyK, Darkhan
To test new GDS pipeline that estimates DARM parameters kappa_{tst}, kappa_{p/u}, kappa_C and f_c we've updated reference values that were calculated from ER7 model (see LHO alog #20291 for earlier values).
New values entered for ESD line at 35.9 Hz are
H1:CAL-CS_TDEP_ESD_LINE1_REF_C_REAL 1.2896e+06
H1:CAL-CS_TDEP_ESD_LINE1_REF_C_IMAG -189585
H1:CAL-CS_TDEP_ESD_LINE1_REF_C_NOCAVPOLE_REAL 1.30877e+06
H1:CAL-CS_TDEP_ESD_LINE1_REF_C_NOCAVPOLE_IMAG -59171.7
H1:CAL-CS_TDEP_ESD_LINE1_REF_D_REAL 8.8387e+09
H1:CAL-CS_TDEP_ESD_LINE1_REF_D_IMAG 1.12814e+10
H1:CAL-CS_TDEP_ESD_LINE1_REF_A_TST_REAL -4.38814e-17
H1:CAL-CS_TDEP_ESD_LINE1_REF_A_TST_IMAG -3.39859e-17
H1:CAL-CS_TDEP_ESD_LINE1_REF_A_PUM_REAL -2.61782e-17
H1:CAL-CS_TDEP_ESD_LINE1_REF_A_PUM_IMAG 4.21051e-17
H1:CAL-CS_TDEP_ESD_LINE1_REF_A_UIM_REAL -5.14962e-21
H1:CAL-CS_TDEP_ESD_LINE1_REF_A_UIM_IMAG -2.34929e-21
H1:CAL-CS_TDEP_ESD_LINE1_REF_OLG_REAL -1.05327
H1:CAL-CS_TDEP_ESD_LINE1_REF_OLG_IMAG -0.791652
for PCALY line at 36.7 Hz:
H1:CAL-CS_TDEP_PCALY_LINE1_REF_C_REAL 1.28869e+06
H1:CAL-CS_TDEP_PCALY_LINE1_REF_C_IMAG -193725
H1:CAL-CS_TDEP_PCALY_LINE1_REF_C_NOCAVPOLE_REAL 1.30872e+06
H1:CAL-CS_TDEP_PCALY_LINE1_REF_C_NOCAVPOLE_IMAG -60499.8
H1:CAL-CS_TDEP_PCALY_LINE1_REF_D_REAL 8.99945e+09
H1:CAL-CS_TDEP_PCALY_LINE1_REF_D_IMAG 1.15726e+10
H1:CAL-CS_TDEP_PCALY_LINE1_REF_A_TST_REAL -4.2798e-17
H1:CAL-CS_TDEP_PCALY_LINE1_REF_A_TST_IMAG -3.22538e-17
H1:CAL-CS_TDEP_PCALY_LINE1_REF_A_PUM_REAL -2.41611e-17
H1:CAL-CS_TDEP_PCALY_LINE1_REF_A_PUM_IMAG 4.01322e-17
H1:CAL-CS_TDEP_PCALY_LINE1_REF_A_UIM_REAL -4.53934e-21
H1:CAL-CS_TDEP_PCALY_LINE1_REF_A_UIM_IMAG -1.9945e-21
H1:CAL-CS_TDEP_PCALY_LINE1_REF_OLG_REAL -1.03047
H1:CAL-CS_TDEP_PCALY_LINE1_REF_OLG_IMAG -0.772912
for DARM line at 37.3 Hz:
H1:CAL-CS_TDEP_PCALY_LINE1_REF_OLG_IMAG -0.772912
H1:CAL-CS_TDEP_DARM_LINE1_REF_C_IMAG -196826
H1:CAL-CS_TDEP_DARM_LINE1_REF_C_NOCAVPOLE_REAL 1.30868e+06
H1:CAL-CS_TDEP_DARM_LINE1_REF_C_NOCAVPOLE_IMAG -61495.8
H1:CAL-CS_TDEP_DARM_LINE1_REF_D_REAL 9.12151e+09
H1:CAL-CS_TDEP_DARM_LINE1_REF_D_IMAG 1.17888e+10
H1:CAL-CS_TDEP_DARM_LINE1_REF_A_TST_REAL -4.19953e-17
H1:CAL-CS_TDEP_DARM_LINE1_REF_A_TST_IMAG -3.10345e-17
H1:CAL-CS_TDEP_DARM_LINE1_REF_A_PUM_REAL -2.2773e-17
H1:CAL-CS_TDEP_DARM_LINE1_REF_A_PUM_IMAG 3.87215e-17
H1:CAL-CS_TDEP_DARM_LINE1_REF_A_UIM_REAL -4.13563e-21
H1:CAL-CS_TDEP_DARM_LINE1_REF_A_UIM_IMAG -1.76881e-21
H1:CAL-CS_TDEP_DARM_LINE1_REF_OLG_REAL -1.01416
H1:CAL-CS_TDEP_DARM_LINE1_REF_OLG_IMAG -0.759088
H1:CAL-CS_TDEP_DARM_LINE1_REF_A_USUM_INV_REAL -1.12869e+16
H1:CAL-CS_TDEP_DARM_LINE1_REF_A_USUM_INV_IMAG -1.91871e+16
for PCALY line at 331.9 Hz:
H1:CAL-CS_TDEP_PCALY_LINE2_REF_C_REAL 373718
H1:CAL-CS_TDEP_PCALY_LINE2_REF_C_IMAG -890155
H1:CAL-CS_TDEP_PCALY_LINE2_REF_C_NOCAVPOLE_REAL 1.20595e+06
H1:CAL-CS_TDEP_PCALY_LINE2_REF_C_NOCAVPOLE_IMAG -540755
H1:CAL-CS_TDEP_PCALY_LINE2_REF_D_REAL 7.75468e+10
H1:CAL-CS_TDEP_PCALY_LINE2_REF_D_IMAG -8.57657e+09
H1:CAL-CS_TDEP_PCALY_LINE2_REF_A_TST_REAL -9.24752e-19
H1:CAL-CS_TDEP_PCALY_LINE2_REF_A_TST_IMAG -1.86072e-19
H1:CAL-CS_TDEP_PCALY_LINE2_REF_A_PUM_REAL 1.11411e-19
H1:CAL-CS_TDEP_PCALY_LINE2_REF_A_PUM_IMAG 1.83559e-19
H1:CAL-CS_TDEP_PCALY_LINE2_REF_A_UIM_REAL -2.19997e-26
H1:CAL-CS_TDEP_PCALY_LINE2_REF_A_UIM_IMAG -3.04968e-27
H1:CAL-CS_TDEP_PCALY_LINE2_REF_OLG_REAL -0.0175432
H1:CAL-CS_TDEP_PCALY_LINE2_REF_OLG_IMAG 0.0586971
kappa_tst correction factor (- 1 / A_0^tst(f_tst)) * (C_0(f_pcal) / (1 + G_0(f_pcal))) * (C_0(f_tst) / (1 + G_0(f_tst)))^{-1} is
H1:CAL-CS_TDEP_REF_INVA_CLGRATIO_TST_REAL 1.425e+16
H1:CAL-CS_TDEP_REF_INVA_CLGRATIO_TST_IMAG -1.17617e+16
and A(f_ctrl) correction factor (C_0(f_pcal) / (1 + G_0(f_pcal))) * (C_0(f_ctrl) / (1 + G_0(f_ctrl)))^{-1} is
H1:CAL-CS_TDEP_REF_CLGRATIO_CTRL_REAL 1.425e+16
H1:CAL-CS_TDEP_REF_CLGRATIO_CTRL_IMAG -1.17617e+16
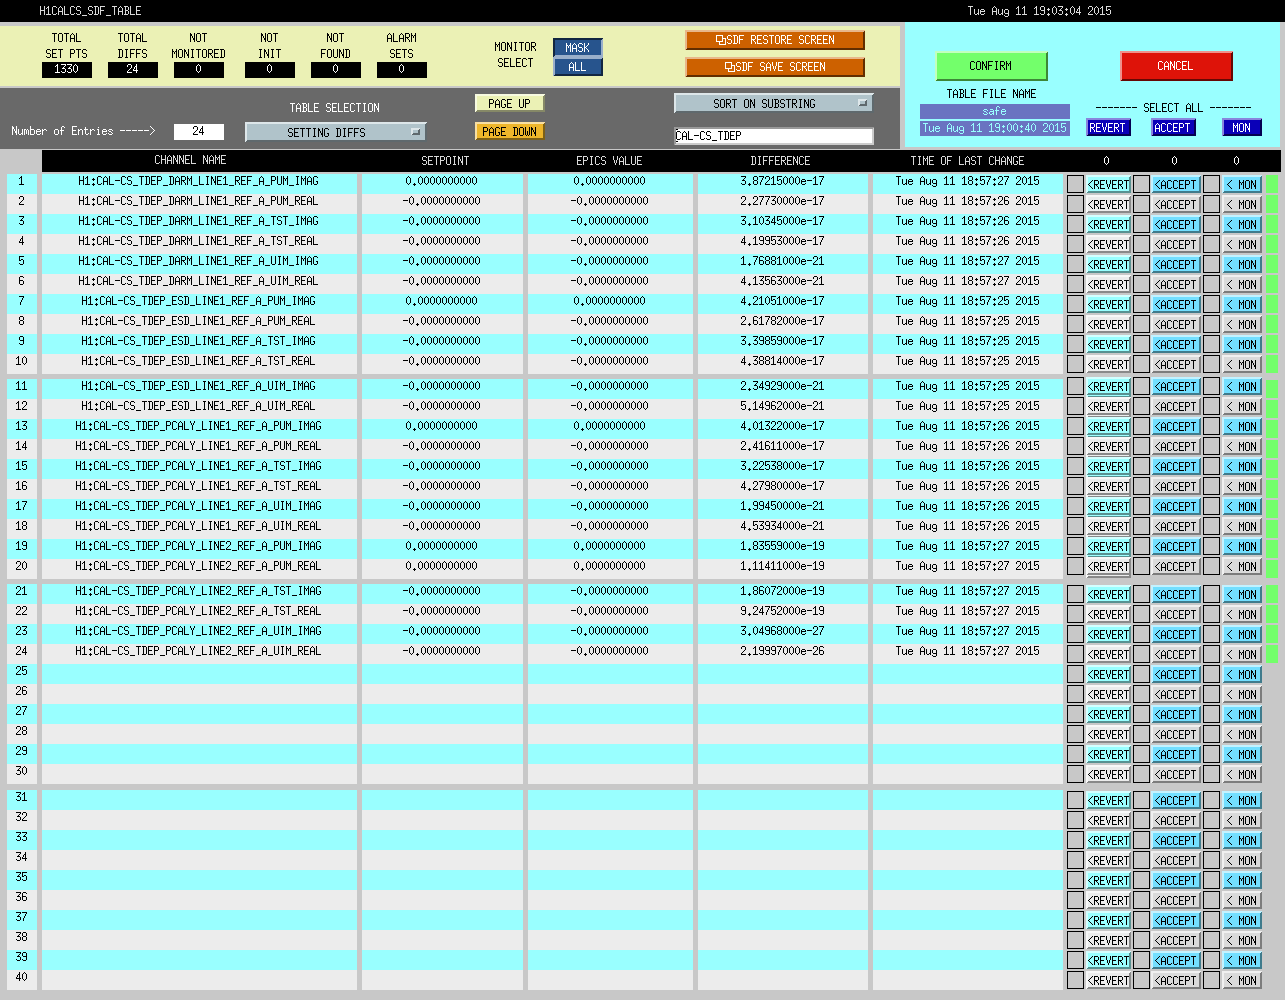
Most of these new values have been accepted in SDF_OVERVIEW table. Some of the values (that are very small) show difference in SDF even after "accept"+"confirm".
Notice that in the A_TST, A_PUM, A_UIM for ESD line (at frequency f_tst) include time delays due to IOP error checking (3 IOP cycles) + IOP computation (1 * IOP cycle) + zero order hold delay (0.5 * IOP cycle), but does not include 1 SUS computation cycle time delay (that was included into respective quantities for other cal lines). This means that when calculating kappa_{tst} in GDS pipeline (see eq. 9 in T1500377-v6), there is no need to account for time delay when using X_tst signal. Other values C, OLG and (G used for CLGRATIO calculations) include full time delays associated with sensing and actuation.