[Jenne, StefanB, Cheryl]
We were having some trouble getting the IMC WFS to converge (WFS came on, looked okay for a while, then started dragging the MC transmitted power down), so we implemented and tested the new global burt restore state, accessible from the ISC_LOCK guardian.
In the end, the specific problem with the IMC WFS was that the ISC input filters on the M3 stage of the MC mirrors (definitely MC1, maybe others) had gain of zero, so the WFS signals weren't getting through to the optics' outputs.
The solution we created, which should solve all kinds of problems, is a guardian state that does a global burt restore to a recent set of autoburt snapshots. This state has a date and time hard-coded in the guardian script, although it is easily change-able if we find a more preferable time. Currently, it is restoring to the autoburts of 28 July 2015, 07:10. To select this state, you need to go to "manual", since there are no edges to get there from any other state. When it has finished the restores, it will immediately go to and run the Down state.
The list of snapshots that are restored is:
-
lsc
-
asc
-
omc
-
alsex
-
alsey
-
iscex
-
iscey
-
pslfss
-
psliss
-
pslpmc
-
ascimc
-
susbs
-
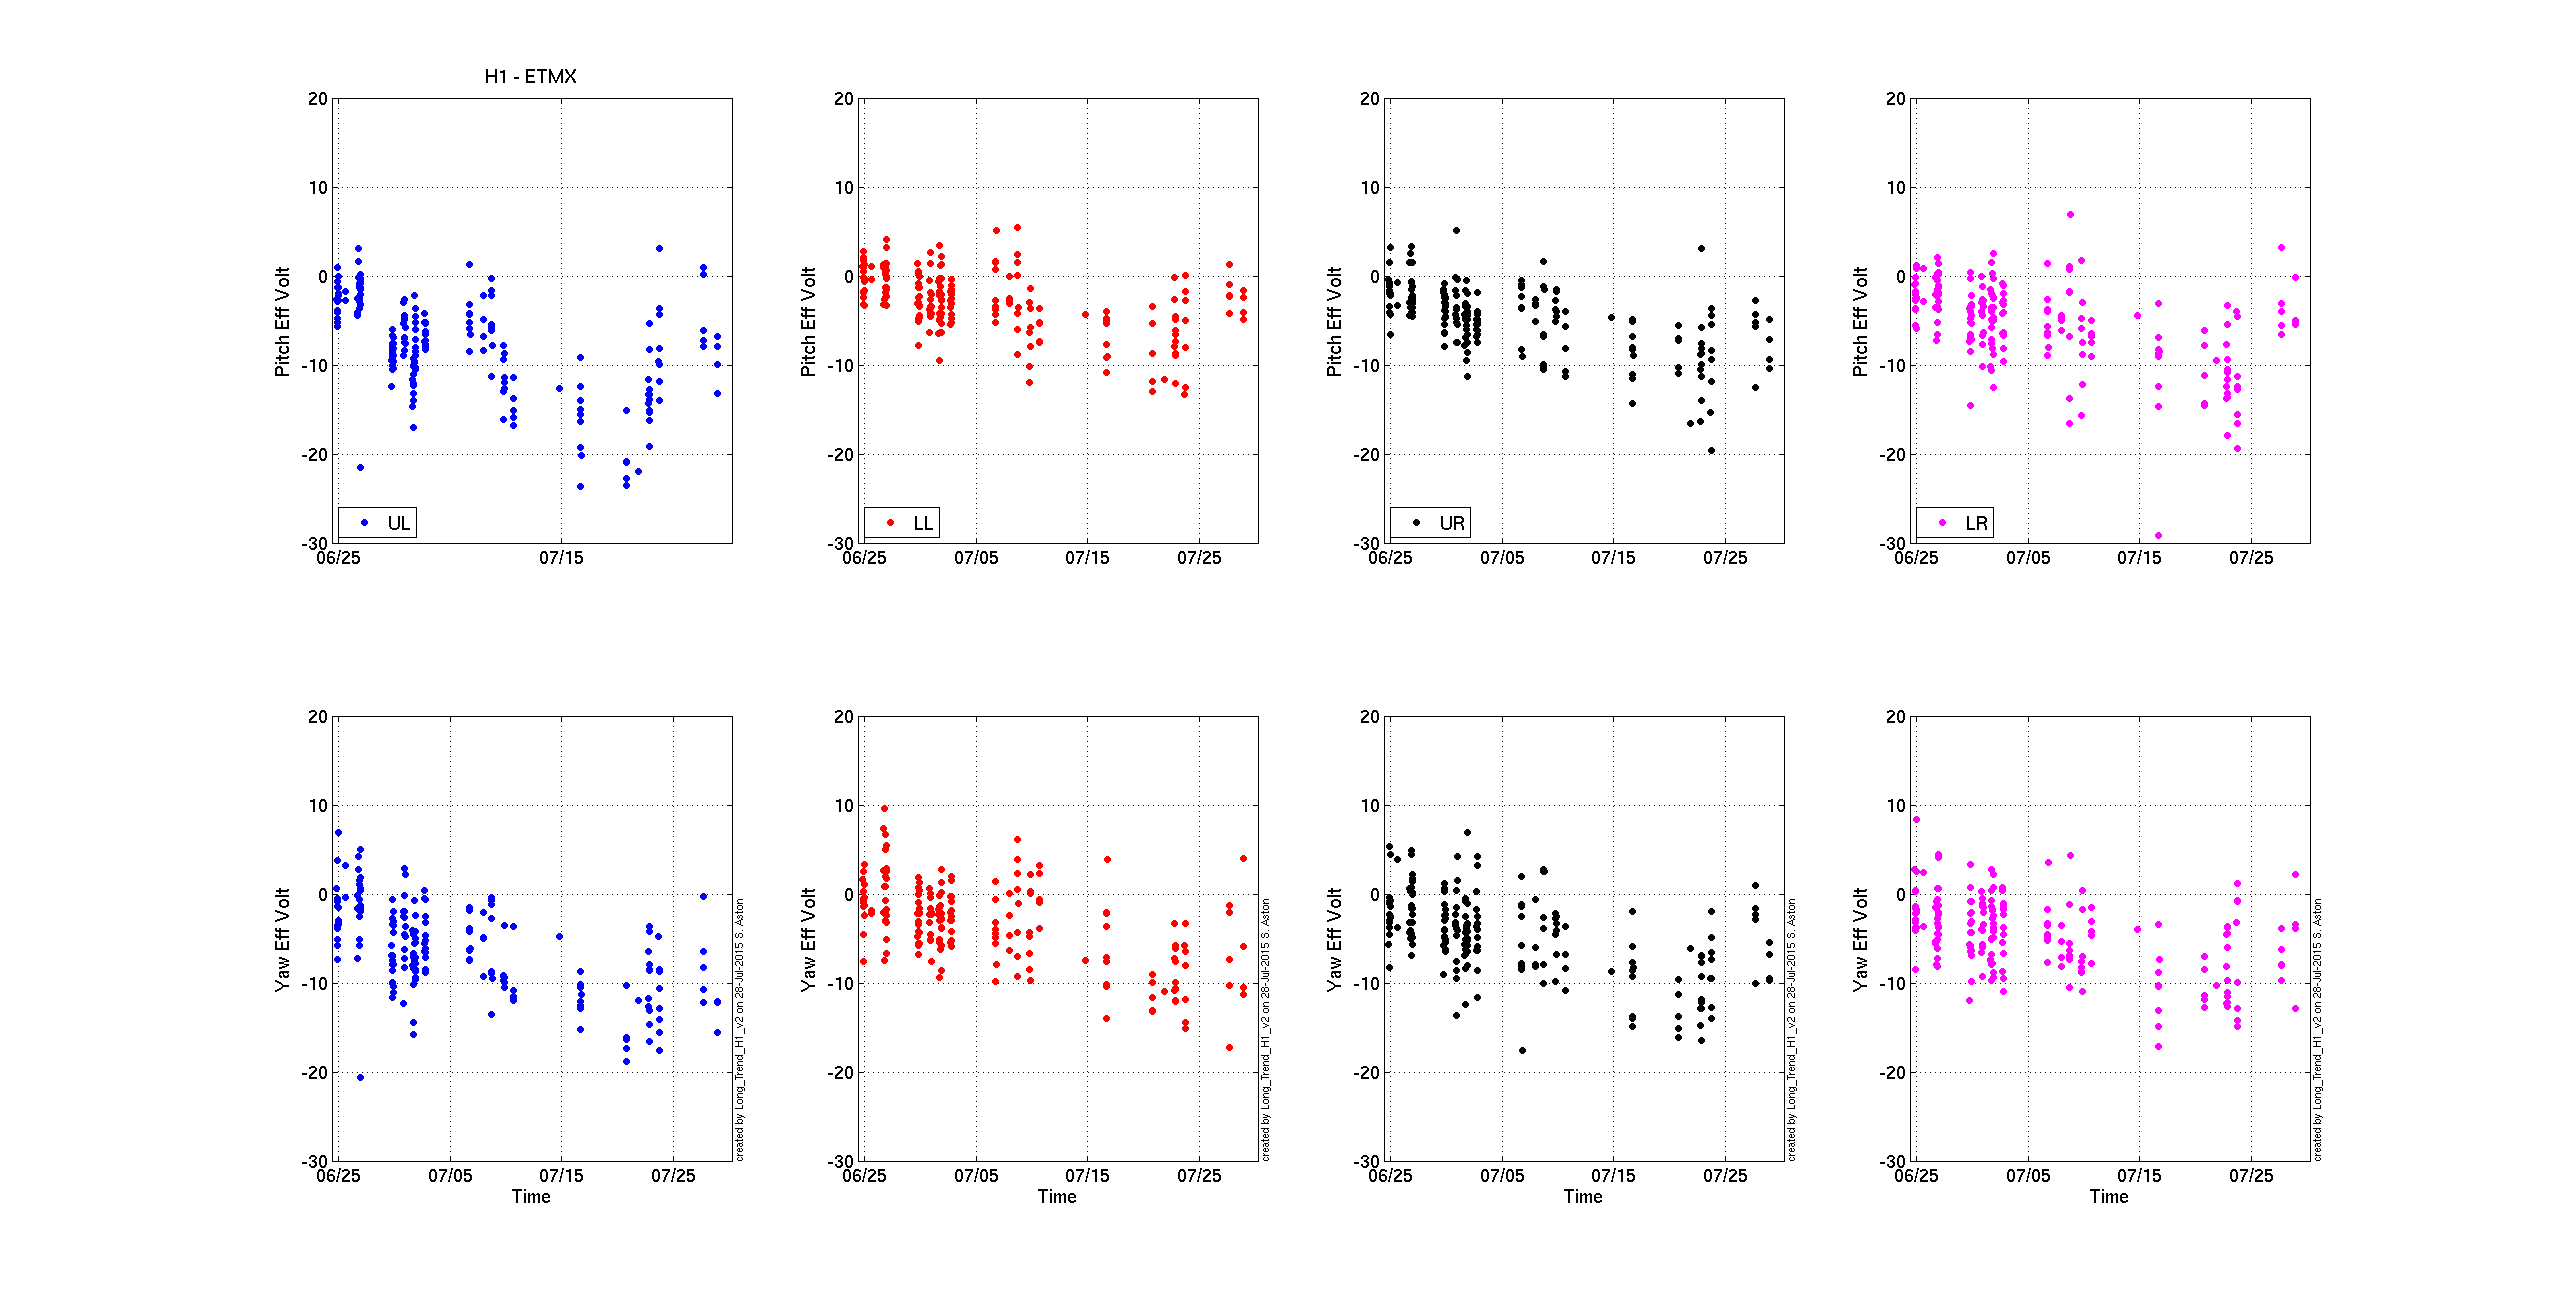
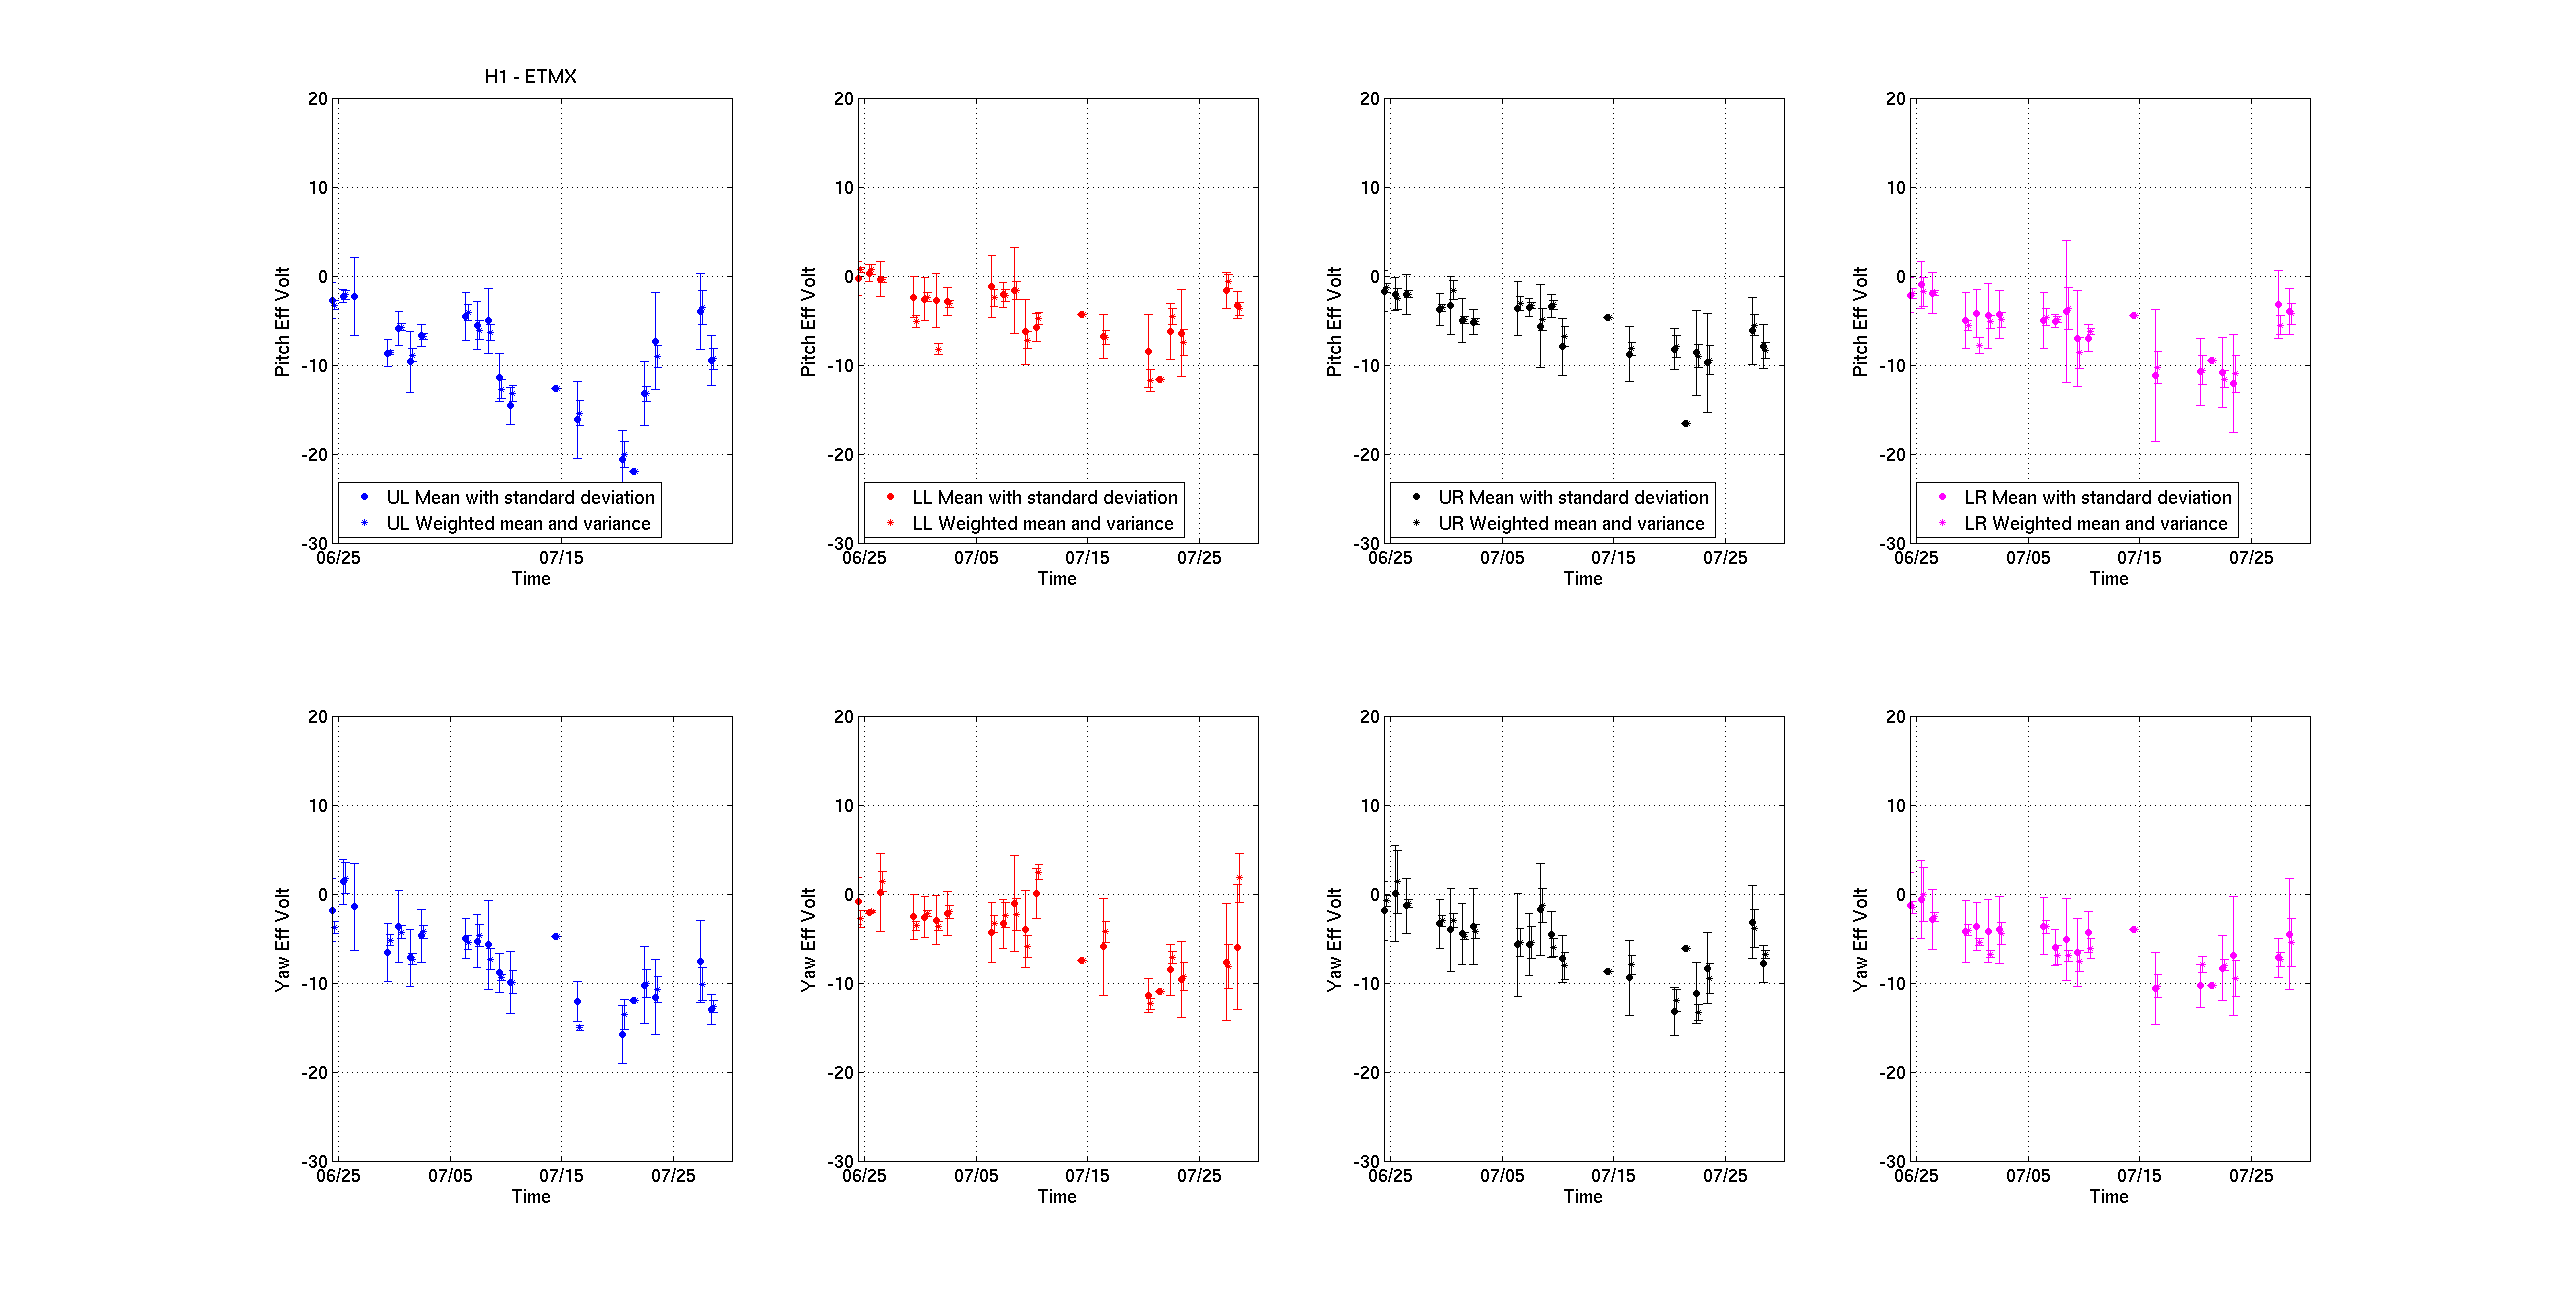
susetmx
-
susetmy
-
susitmx
-
susitmy
-
suspr3
-
suspr2
-
susprm
-
sussr3
-
sussr2
-
sussrm
-
susim
-
susmc1
-
susmc2
-
susmc3
-
sustmsx
-
sustmsy
-
ecatc1plc1
-
ecatc1plc2
-
ecatc1plc3
-
ecatx1plc1
-
ecatx1plc2
-
ecatx1plc3
-
ecaty1plc1
-
ecaty1plc2
-
ecaty1plc3
Perhaps though, we should just restore *every* snapshot that is captured by autoburt?

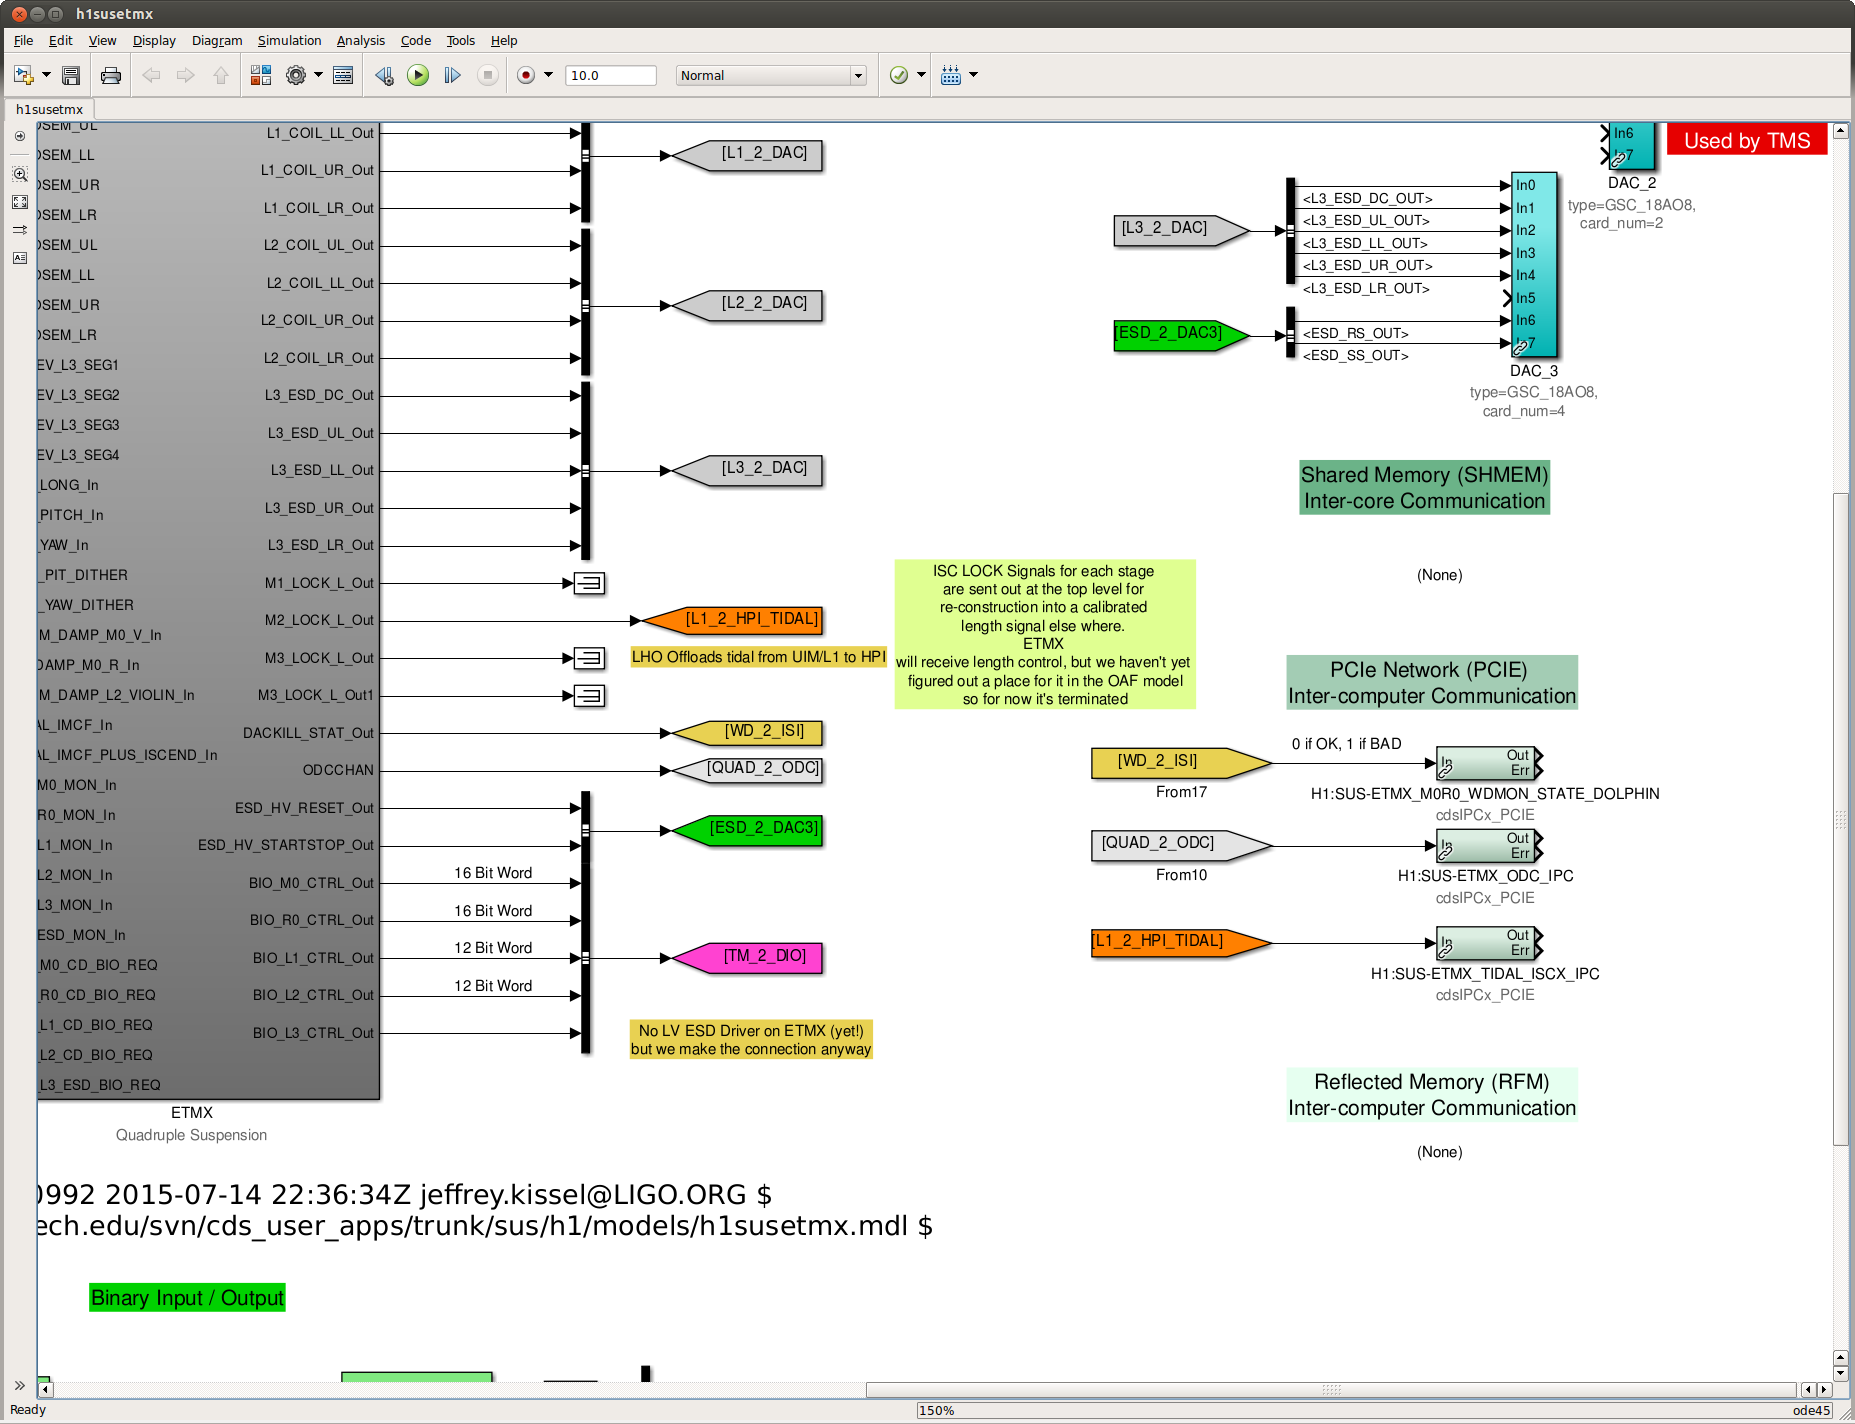
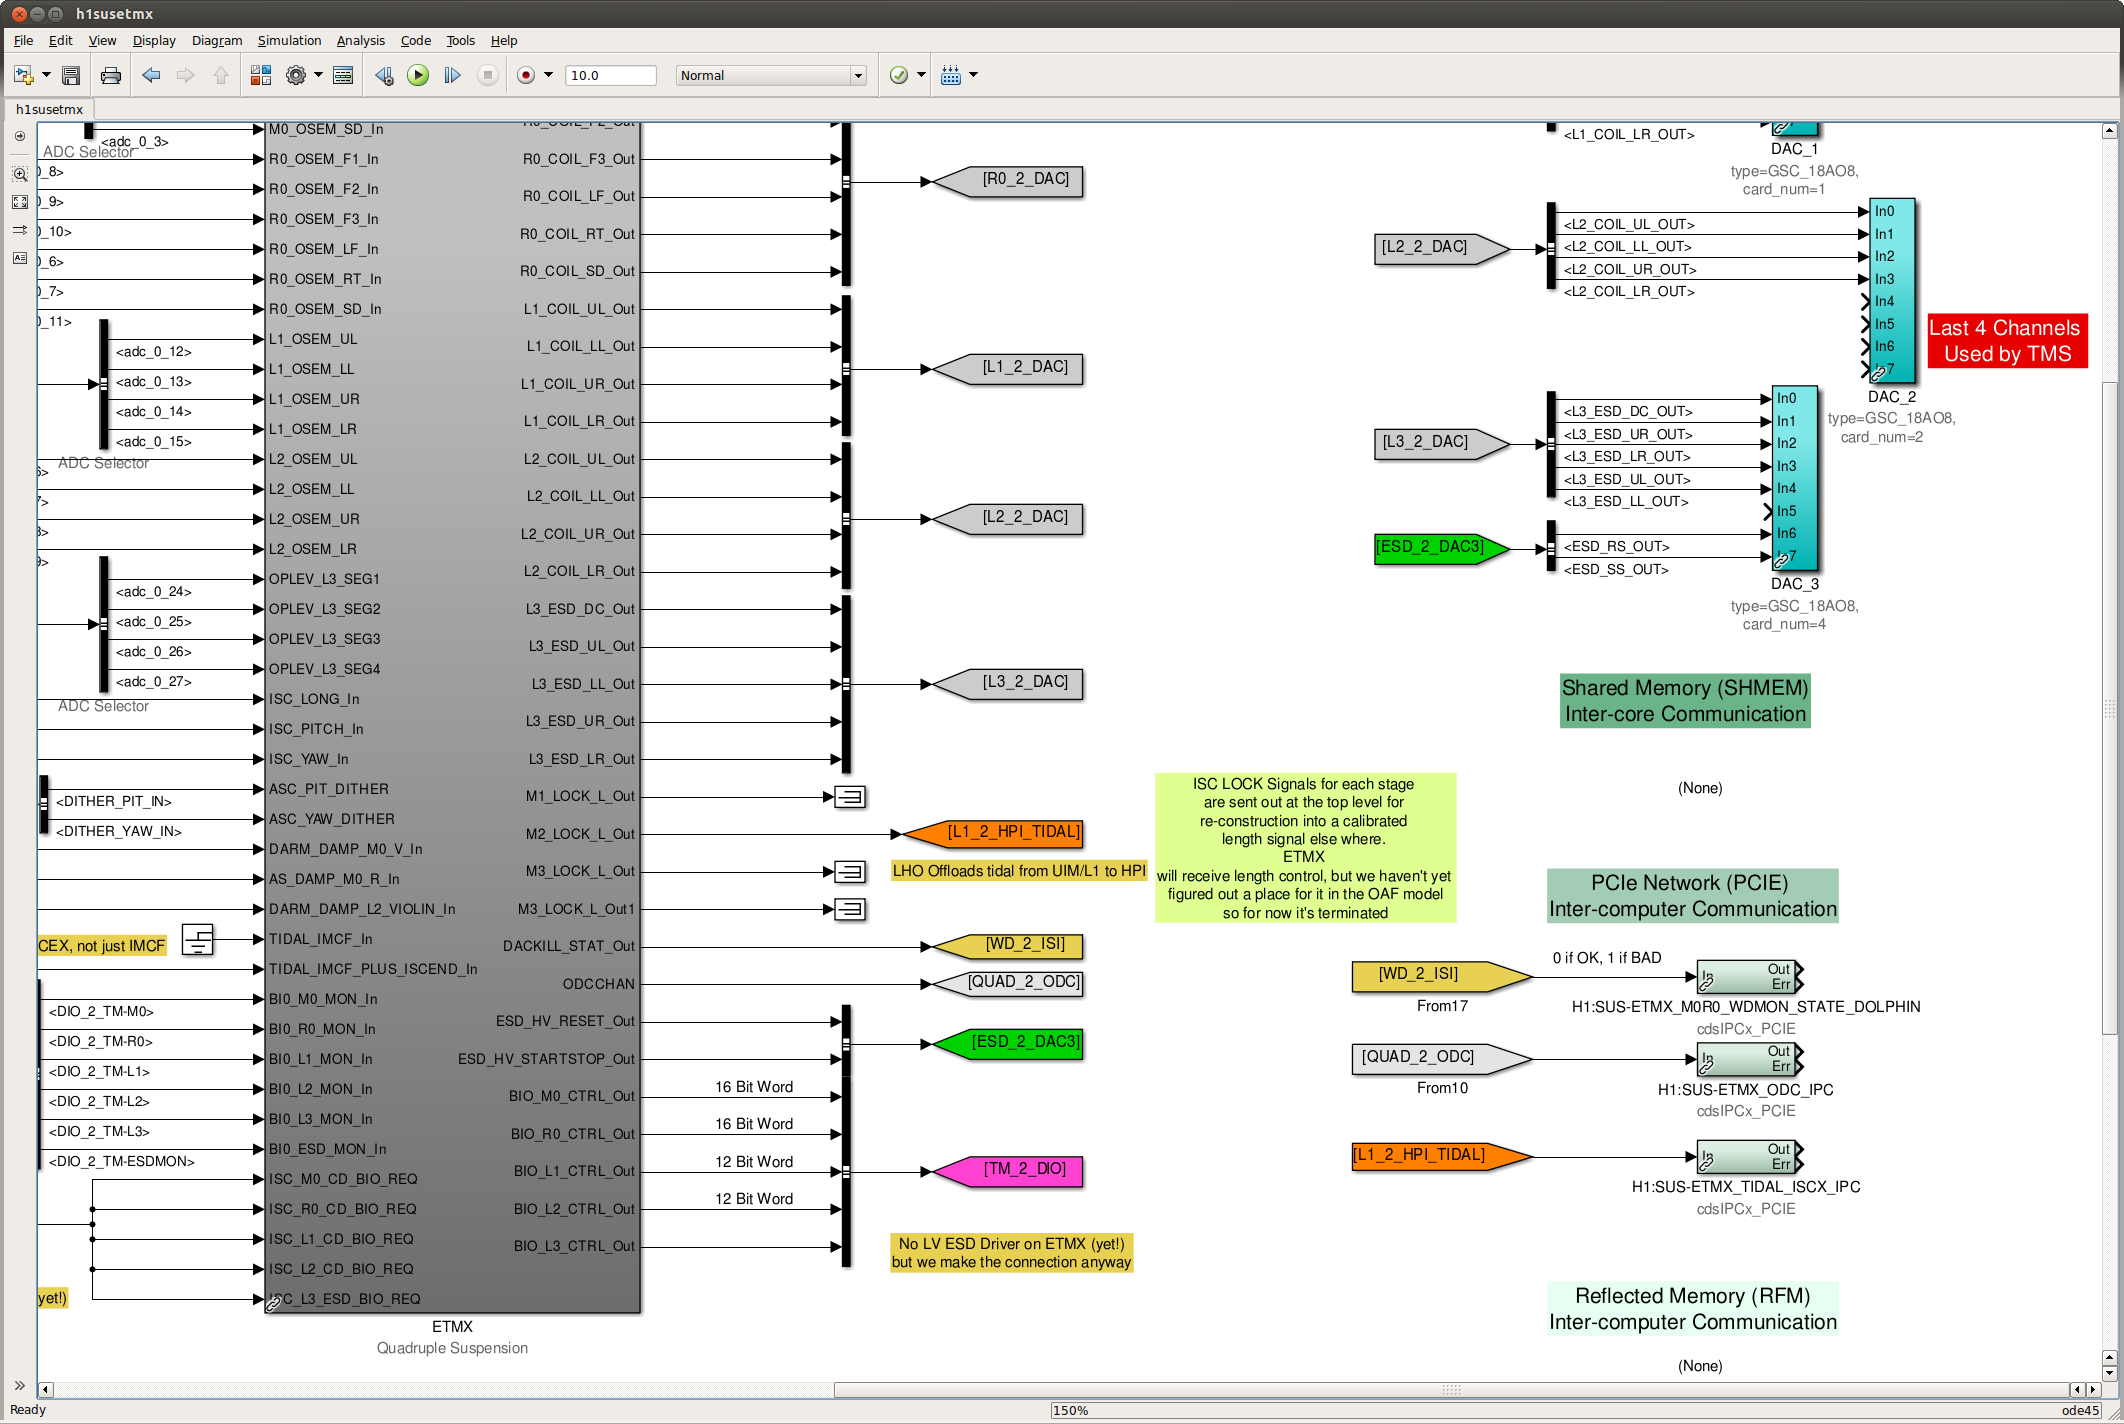
I second what Richard says -- the Beckhoff binary signal that *was* used to control the HV driver on ETMX has now been replaced by similar "fast front-end" binary I/O that's at ETMY. So, for each quadrant, to turn off the high voltage, set the EPICs records
H1:SUS-ETMX_BIO_L3_${QUADRANT}_VOLTAGE_SW to 0 and
H1:SUS-ETMX_BIO_L3_${QUADRANT}_HVDISCONNECT_SW to 0.

This has been true since Richard cabled up the LVLN driver yesterday afternoon (see LHO aLOG 19994).