Calibration team
Introduction
In this analysis we used Pcal lines to estimate frequency dependent changes in sensing function of the LHO interferometer. These changes can affect accuracy of reported displacement from external sources, Delta Lext, that is currently calculated as
Delta Lext = derr / (gamma(t) C0) + A * dctrl
where dctrl and derr are DARM control and DARM error signals;
C0 and A are models of sensing and actuation functions;
gamma(t) is complex correction factor that should take into account changes in sensing function of particular LIGO interferometer.
Method
At a Pcal line frequency DARM error signal can be written as
derr = [ C / (1 + G) ] * Xpcal
where G - DARM loop gain G = A * D * C;
Xpcal - displacement of ETM due to Pcal radiation pressue (see
DCC T1500206);
C is DARM sensing function; in this analysis we do not use gamma(t), since conventional definition of gamma(t) used as complex correction factor, C = gamma(t) * C0, is not a frequency dependent quantity.
Solving it for C gives
C = 1 / [ Xpcal / derr - A D ]
In the DARM model (see
LHO aLOG 18769), sensing function of the interferometer is represented in terms of optical gain, cavity pole frequency, AA filters, OMC whitening, and time delays. For the purpose of this analysis we assume that all of the parameters of DARM control loop, except for optical gain and cavity pole frequency, are not changing over ER7.
Taking these assumptions into account, the following value is calculated to estimate optical gain and cavity pole frequency:
Ao / [ 1 + i (f / fp ) ] = 1 / [Xpcal/derr - A D ] * 1 / [ AA * OMCDCPD * delay ] = Cifo
We saw that in derr phase differences of high frequency Pcal lines (534.7 Hz and 540.7 Hz) are over 140 degrees off of lower frequency lines (33.1 Hz and 36.7 Hz). To account for all phase differences (uncompensated delays etc.), first we can take a reasonably stable lock stretch and use only magnitude of Cifo from two different Pcal lines (one at low and another at high frequency) to estimate initial cavity pole frequency:
fp2 = [ |Cifo,hi|2 * fhi2 - |Cifo,lo|2 * flo2 ] / [ |Cifo,lo|2 - |Cifo,hi|2 ]
and from that, estimate phase shifts of each of the Pcal lines independently.
After that we can calculate trend of the DARM cavity pole frequency and the optical gain from a single Pcal line in a following way:
fp = - Re(Cifo) / Im(Cifo)
Ao = |Cifo|2 / Re(Cifo)
With the method used in this analysis Pcal lines that are closer to cavity pole frequency (534.7 Hz and 540 Hz) are more sensitive for changes in fp than lower frequency lines (33.1 Hz and 36.7 Hz).
Data
During ER7 at LHO Pcal calibration lines were injected at following frequencies:
-
PCALX 33.1 Hz and 534.7 Hz
-
PCALY 36.7 Hz and 540.7 Hz
In this analysis we used 1 minute FFTs of H1:LSC-DARM_IN1_DQ for derr.
Channels H1:CAL-PCALX_TX_PD_OUT_DQ, H1:CAL-PCALY_TX_PD_OUT_DQ and calibration factors from DCC T1500283 were used to calculate Xpcal.
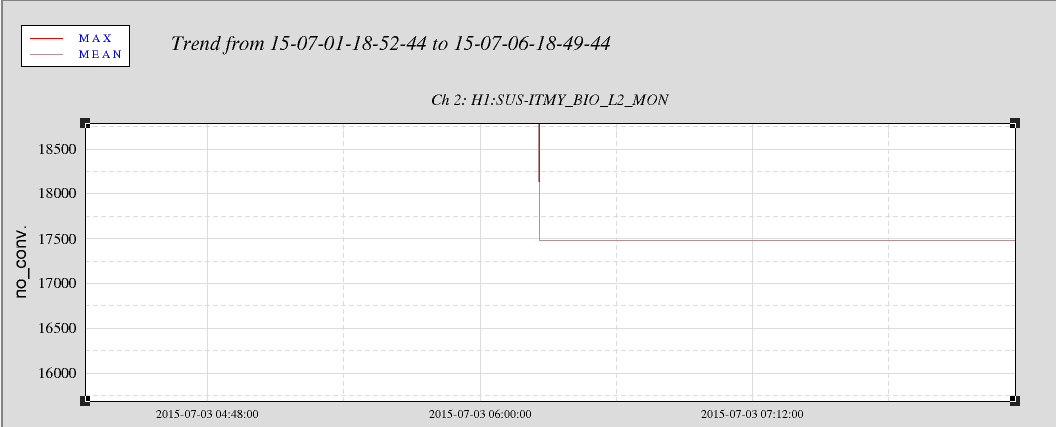
Only data within lock stretches listed in
LHO aLOG 19275 were processed.
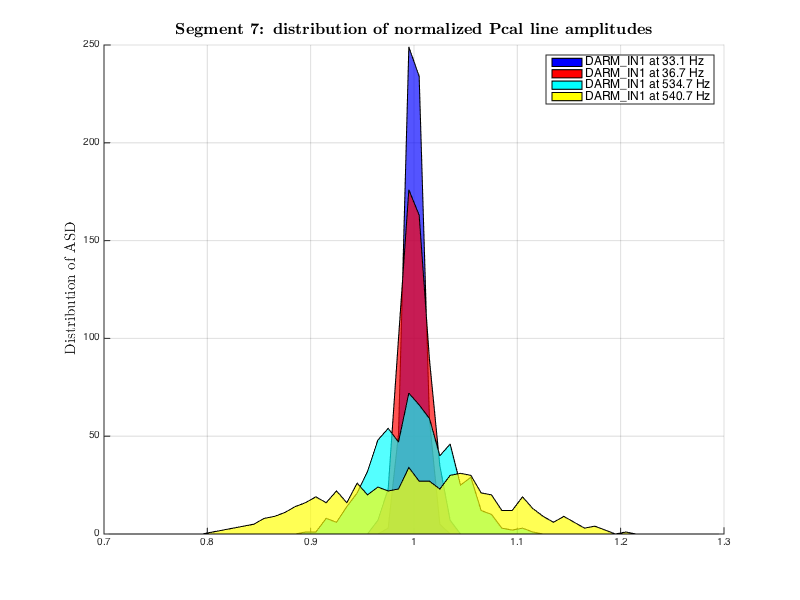
Segment 7 (highlighted in figure 1) was used to calculate initial estimates of phase shifts at 4 line frequencies. Cavity pole frequency was separately calculated using 2 PCALX lines and 2 PCALY lines, and the weighted average of the two was taken as an initial value of fp for that lock stretch. For this segment fp,seg7 = 345.87 Hz (+/-5 % statistical uncertainty).
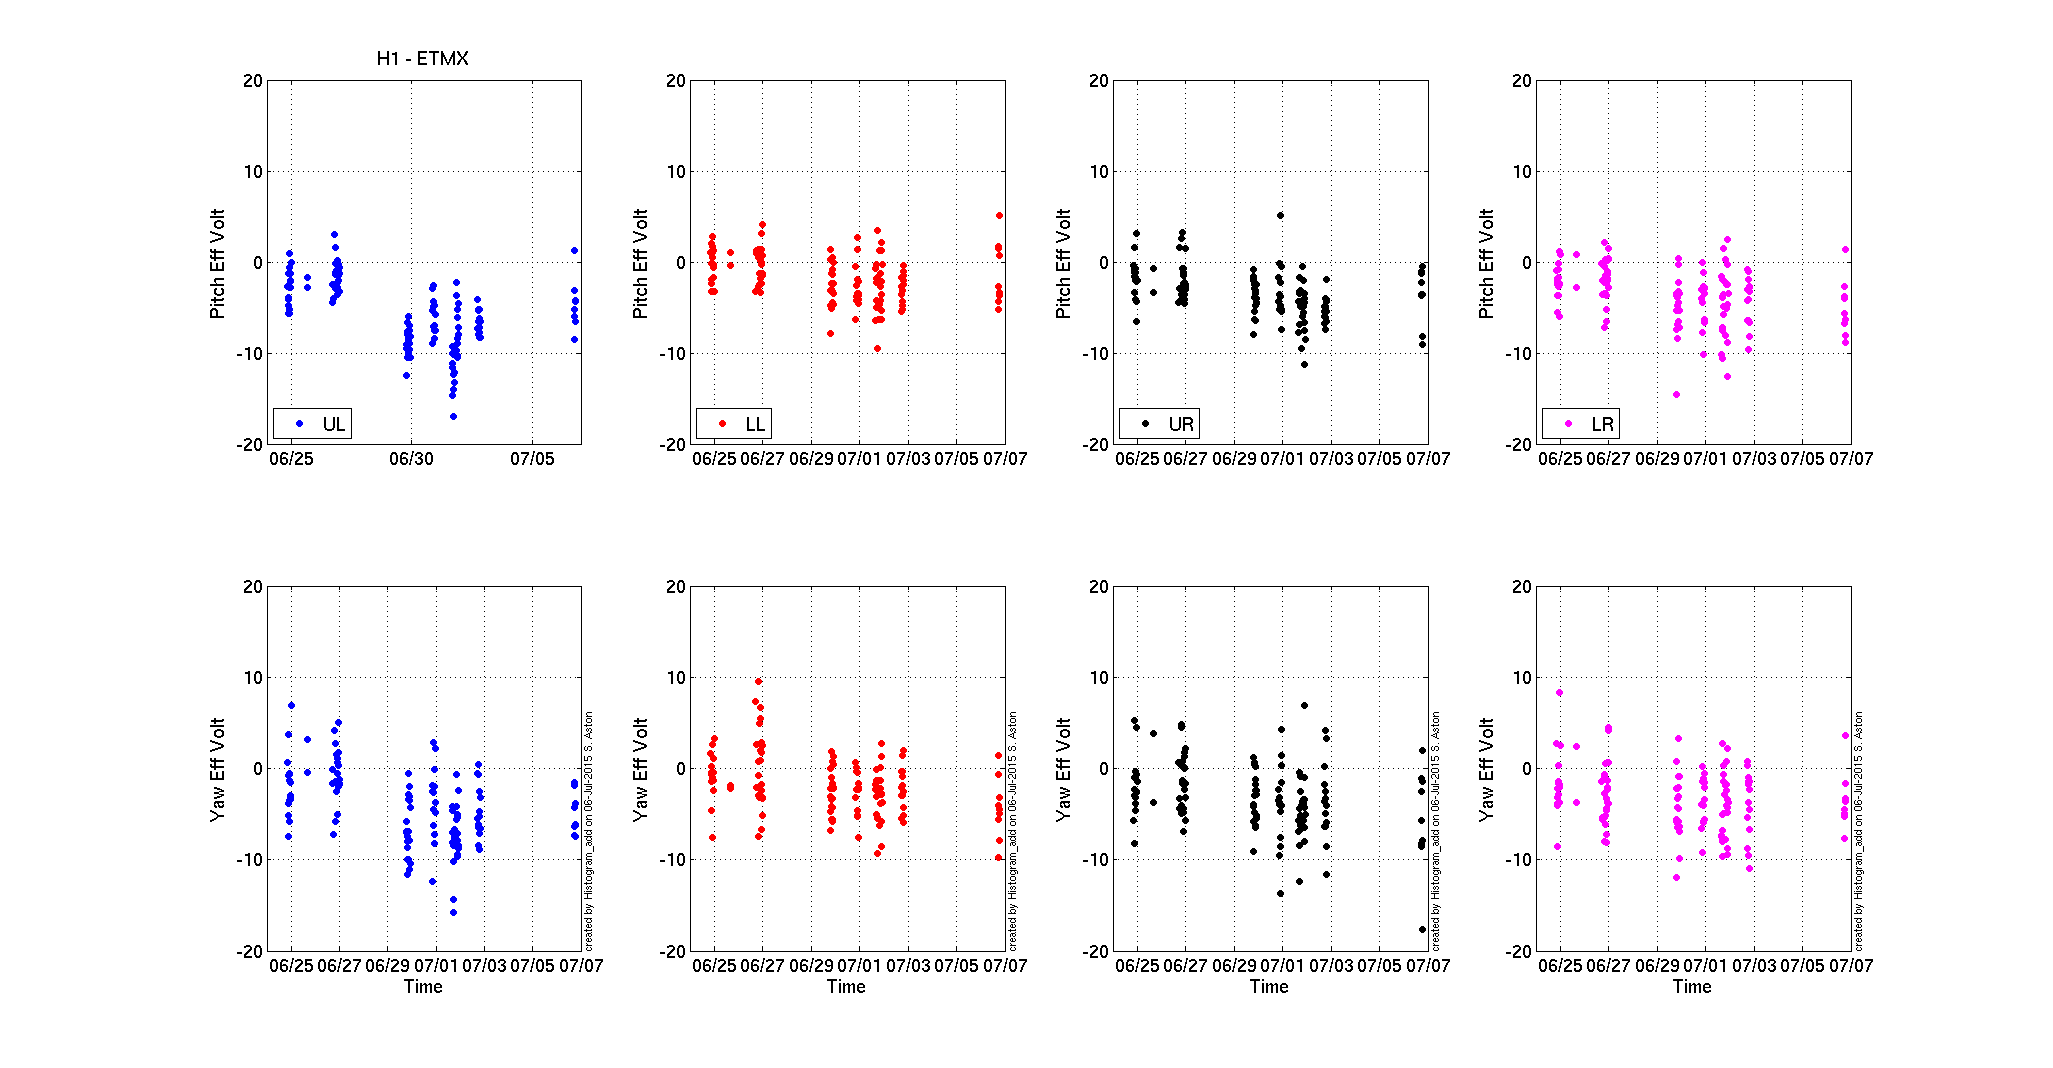
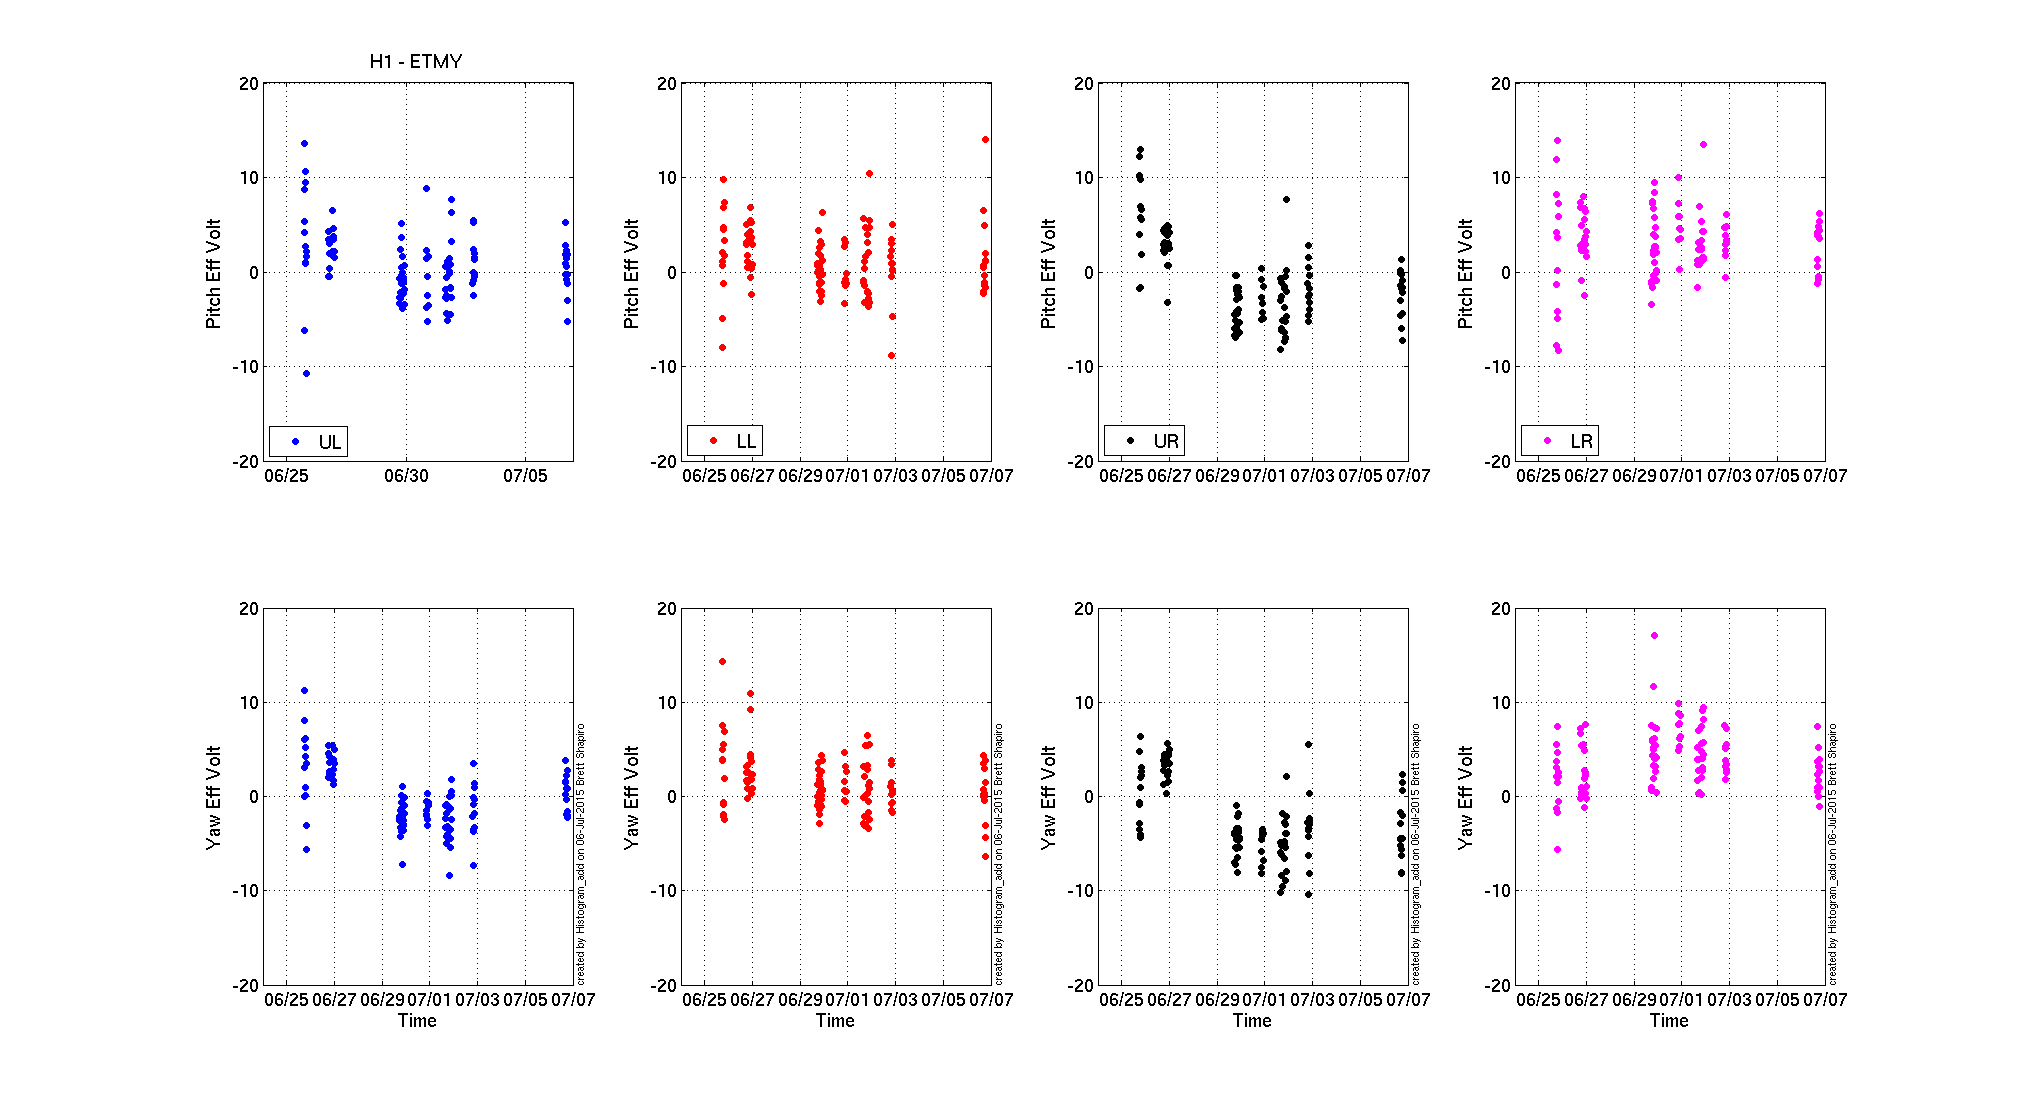
As we can see from the normalized histogram, the signal levels mostly stayed a constant level within +/-10 %. However, both of the low frequency lines show wider distribution compared to high frequency lines, that mainly could caused by low SNR of these lines.
Results
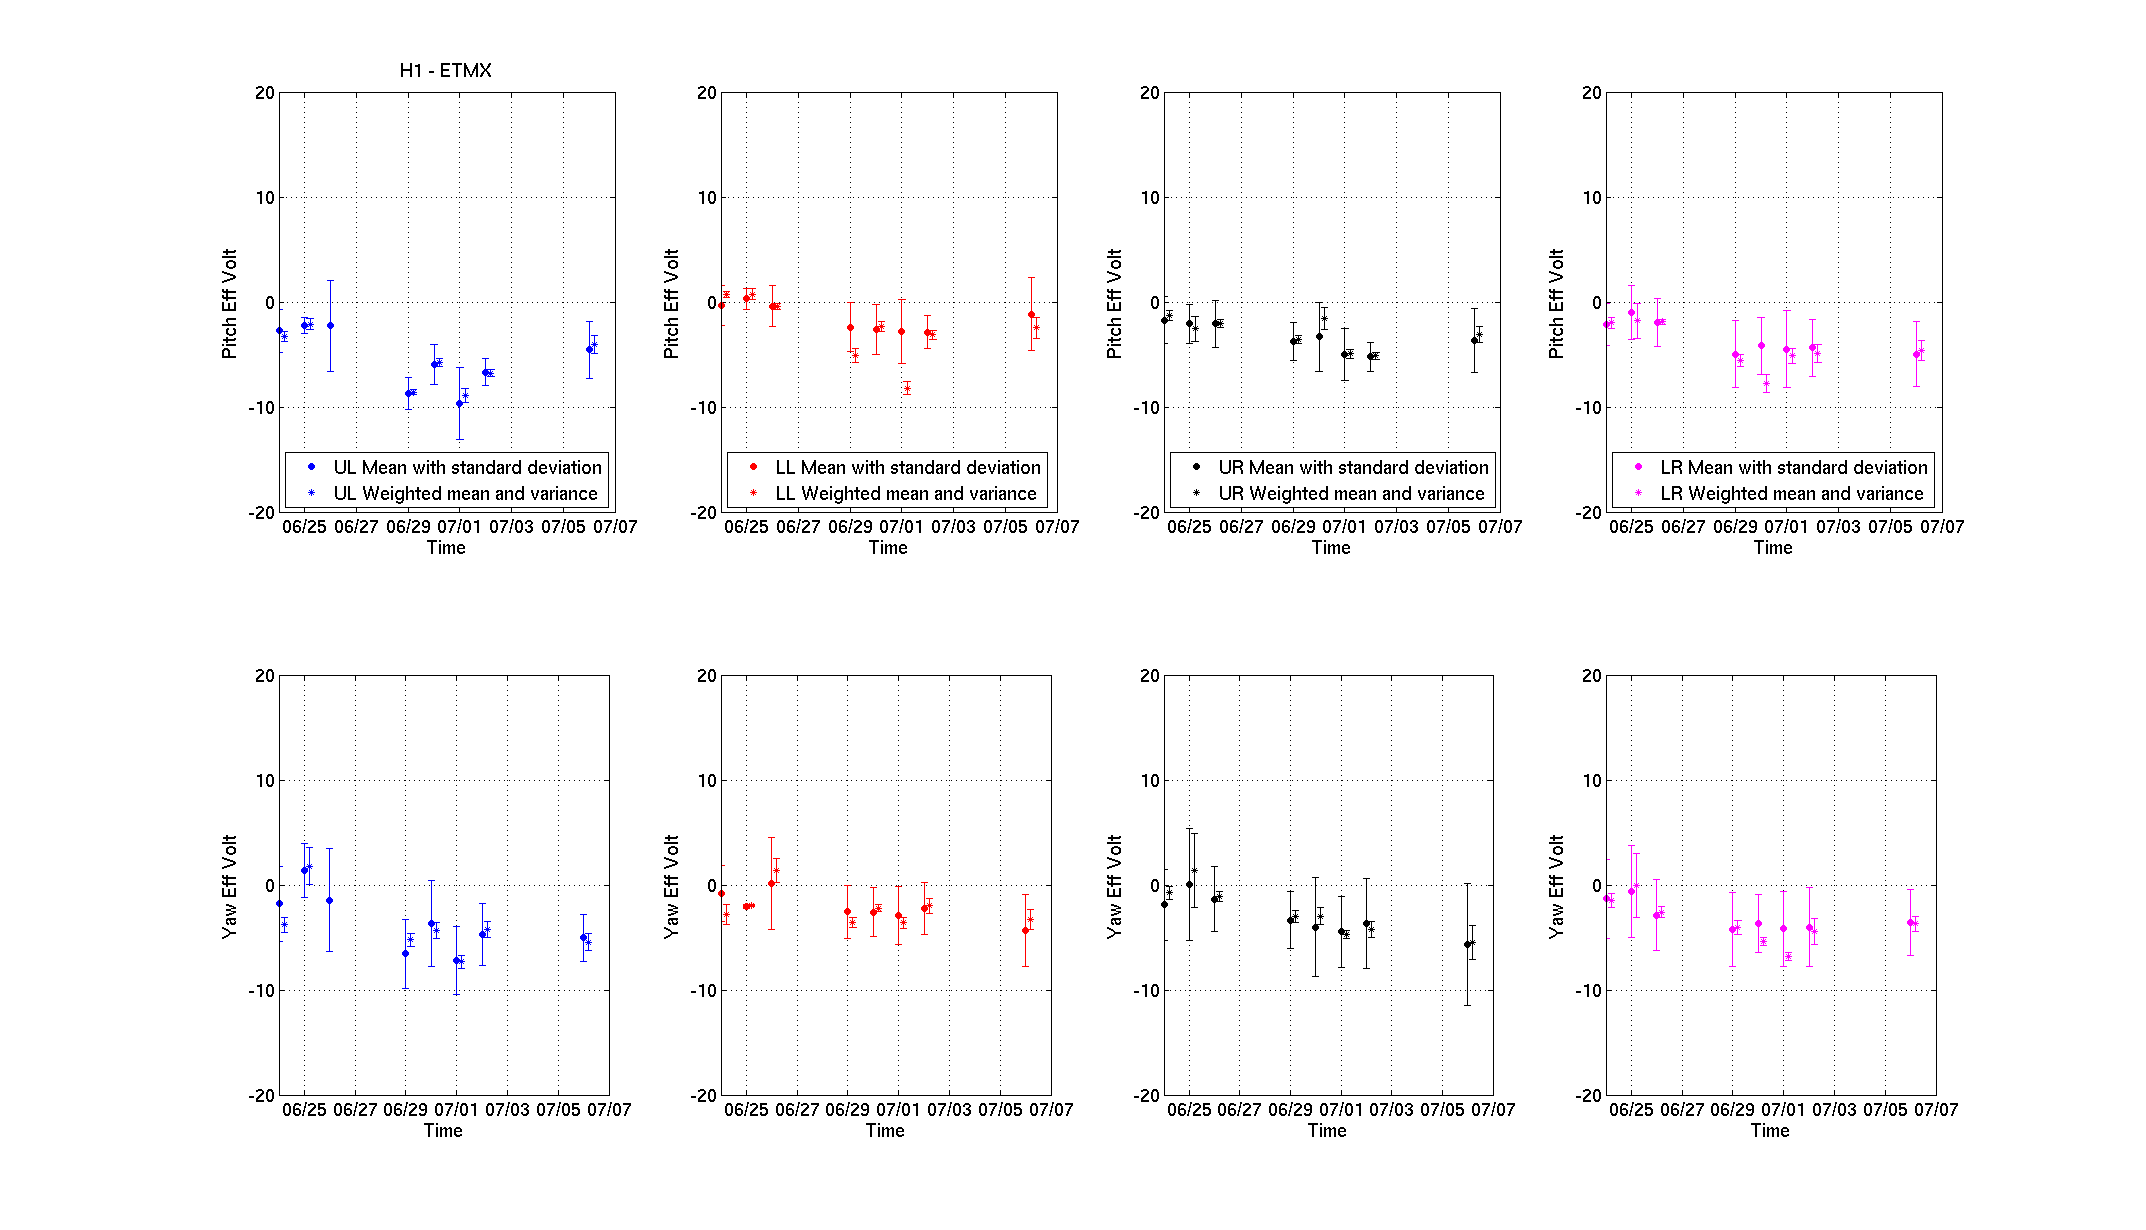
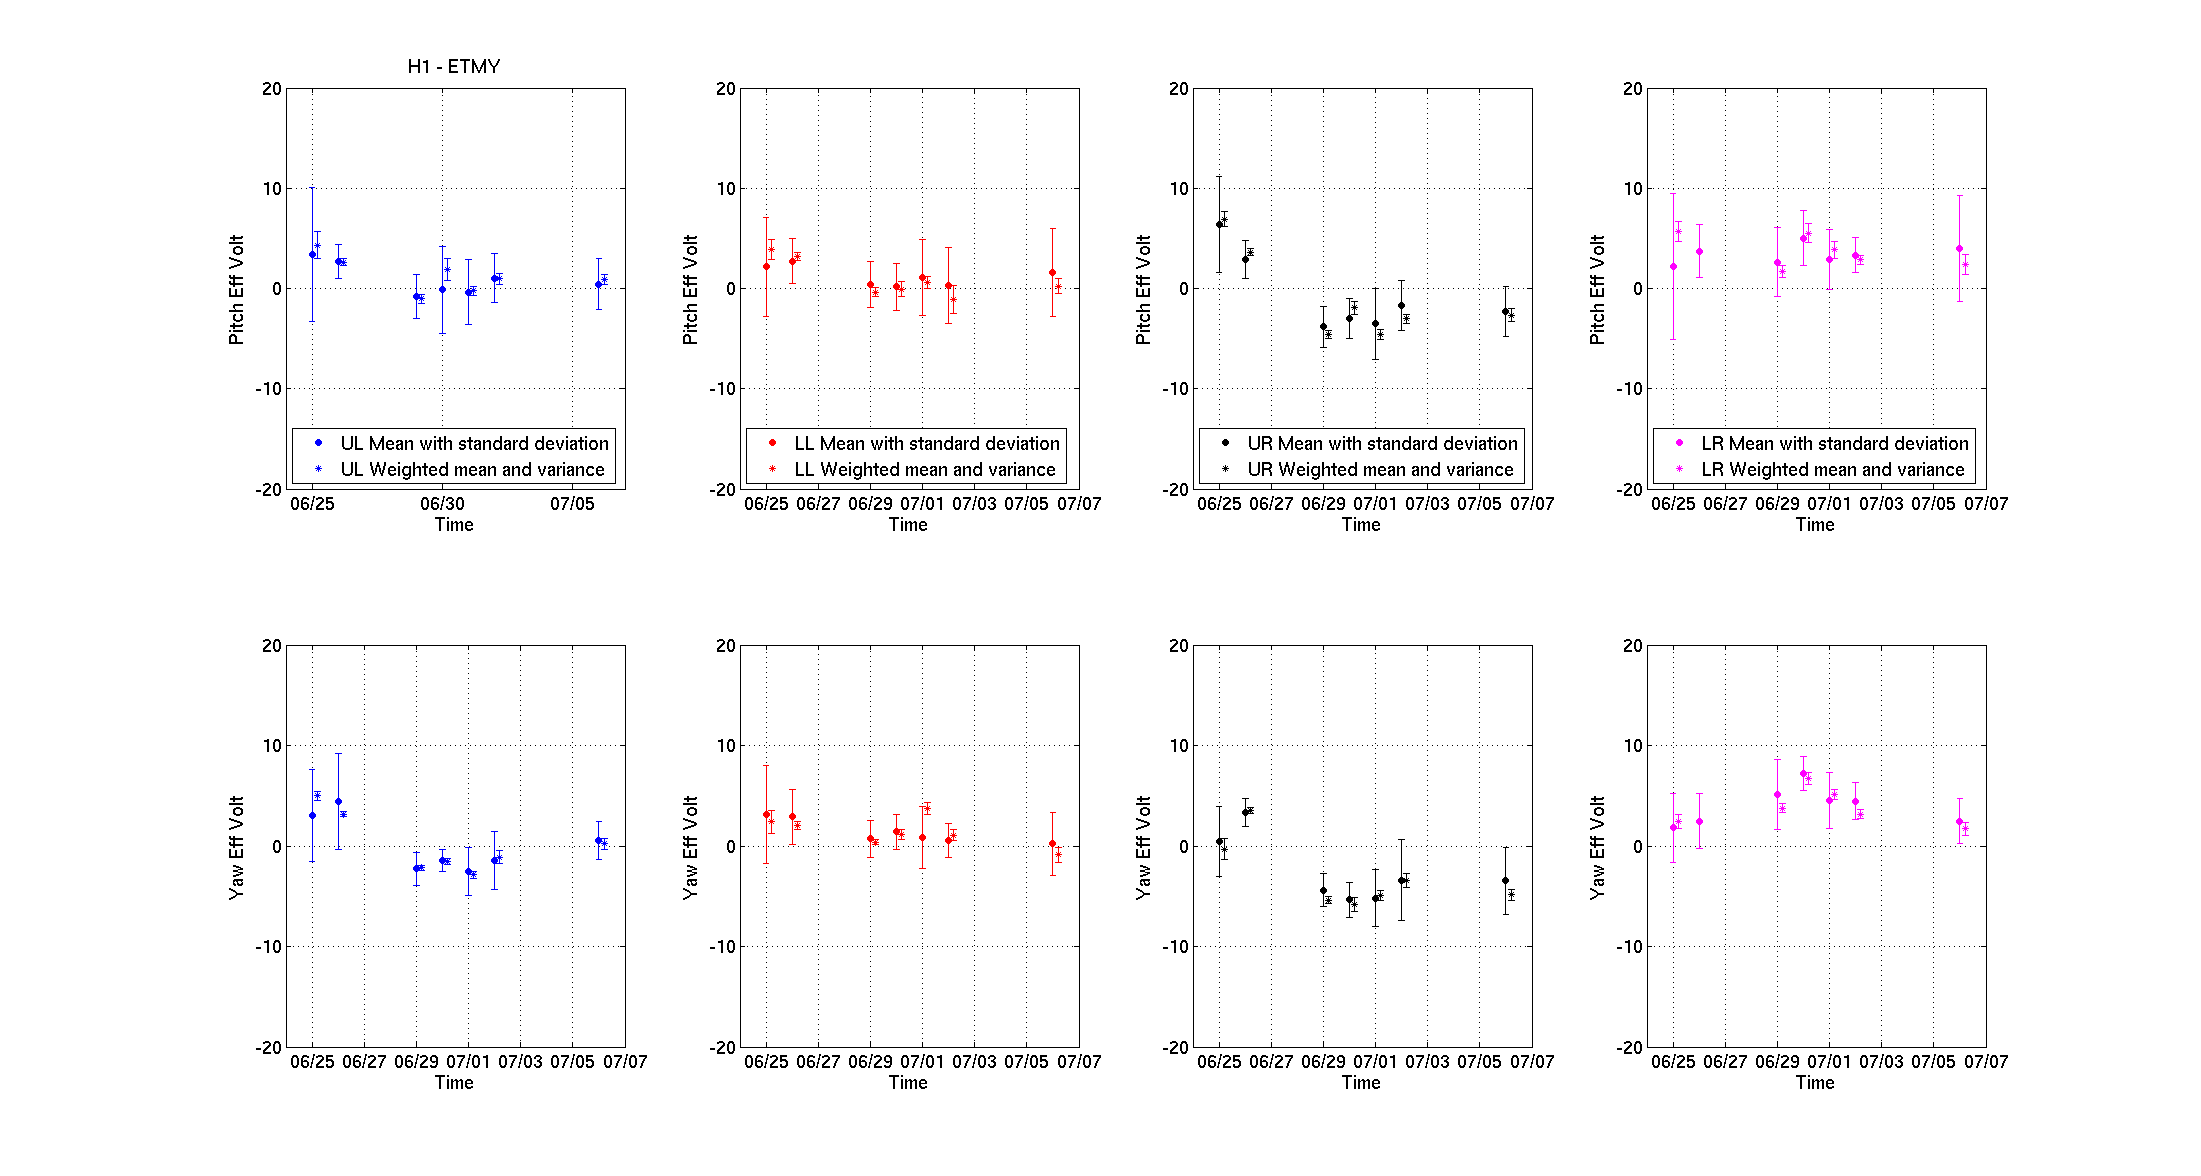
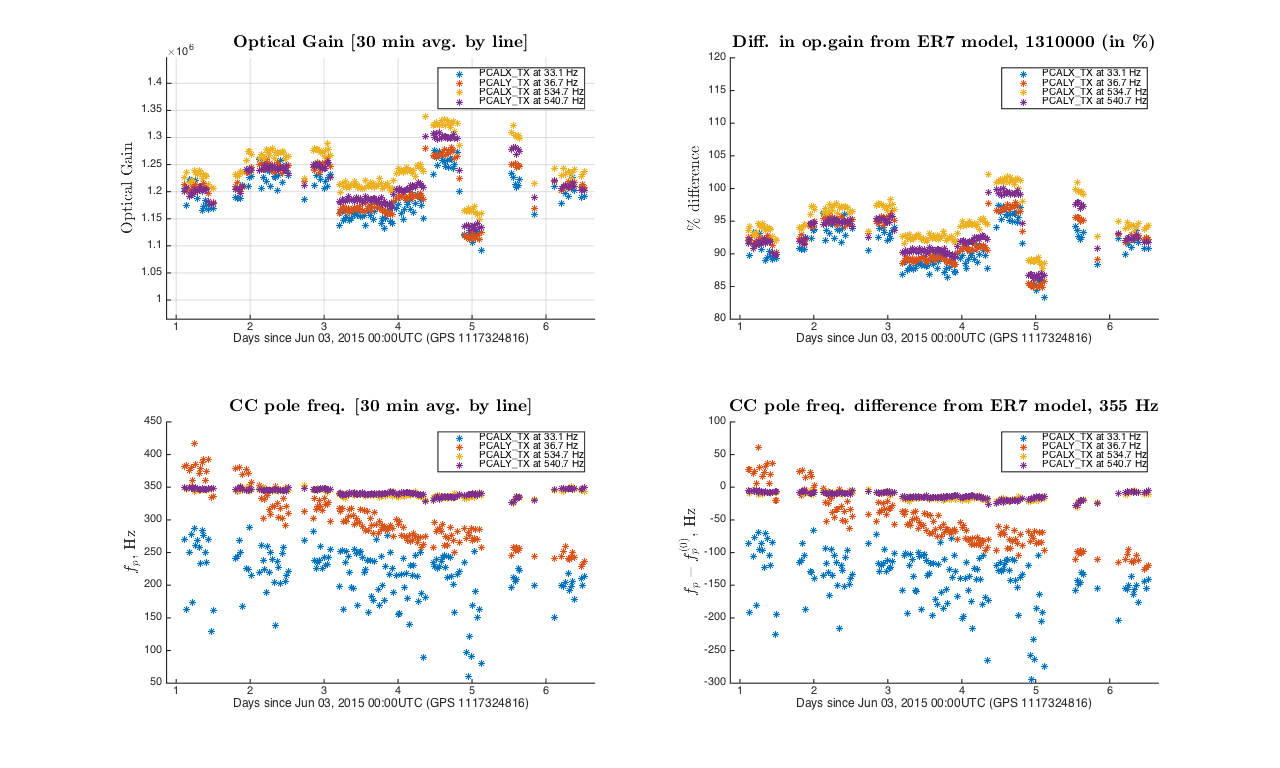
From cavity pole frequency and optical gain weighted average trends calculated individually for each of the Pcal lines we see that lower frequency lines show dramatically decreasing cavity pole frequency with higher standard deviation, that might have been caused by more complex changes in DARM control loop than simple change in cavity pole frequency.
*Note that data points with cavity pole frequencies over 100% off of model cavity pole frequency were not included into 30 minute weighted averages by setting wheir weights to 0.
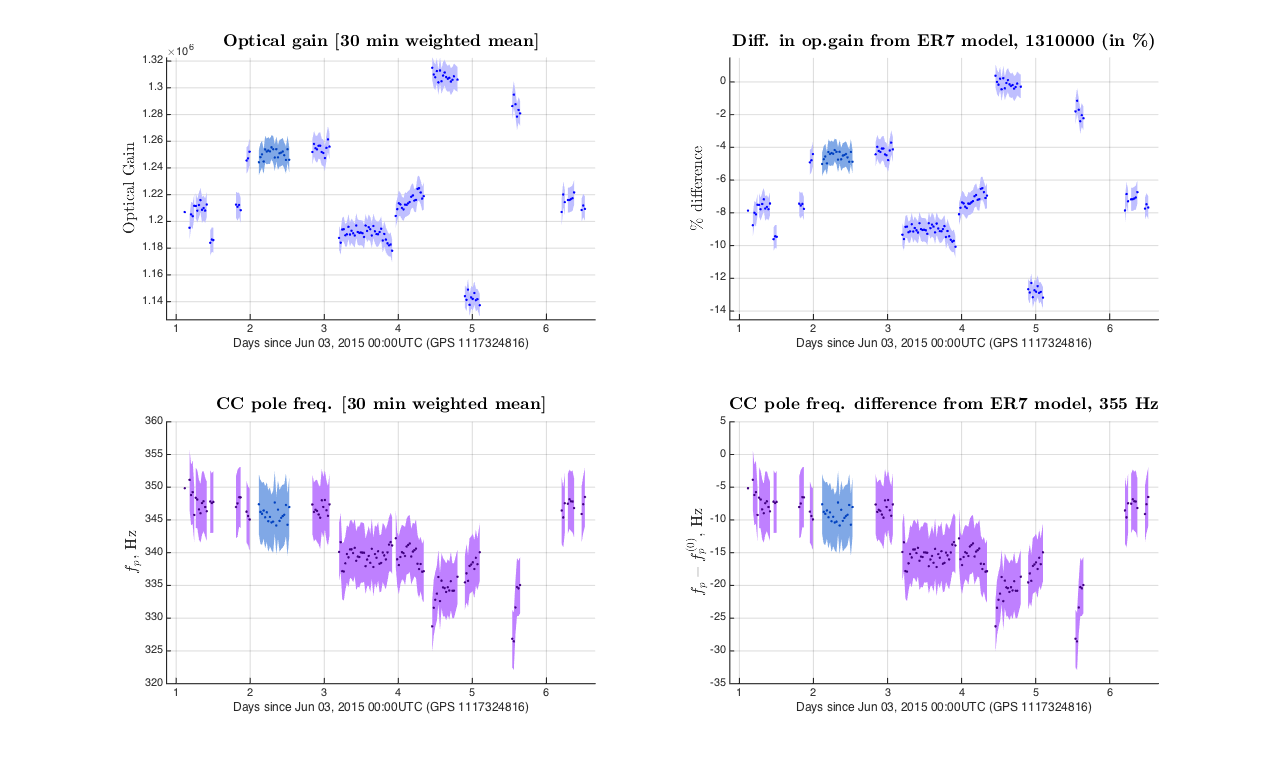
Figure below shows 30 minute weighted mean values of optical gain and cavity pole frequency calculated from 2 Pcal lines: PCALX 534.7 Hz and PCALY 540.7 Hz. Subplots on the left show absolute quantities and 1 sigma statistical uncertainties, subplots on the right show fractional devation of optical gain and absolute deviation of cavity pole frequency from ER7 model. Segment 7, that was initially used to obtain phase corrections, that are not compensated by DARM model, is highlighted in different color.
Note that two low frequency PCAL lines were excluded from this averages to avoid bias from trends from these lines, that probably represents more complex changes in overall gain in DARM loop.
According to this method during first 6 days of ER7
-
optical cavity pole frequency was changing between about 335 and 350 Hz;
-
optical gain was lower compared to ER7 model from 0 to about 11%.
Additional notes (to be studied)
The time delay of 125 us between Pcal and DARM signals (see LHO aLOG 19186) should cause phase delay of high frequency lines of about 24.3 degrees, but not over 140 degrees as we saw in our analysis. The question, why phases of high frequency lines are rotated by 140 degrees compared to phases of low frequency lines, needs to be studied.
Changes in actuation function, A, can confuse results produces by this method. This issue can be avoided by applying a time dependent A in calculation of Cifo.
An estimation of how much changes in CC pole frequency can increase uncertainty in calculation of external length strain need to be studied.
We plan to repeat this analysis with LLO data.
Delta Lext = derr / (gamma(t) C0) + A * dctrl
Delta Lext = derr / (gamma(t) C0) + A * dctrl
Delta Lext = derr / (gamma(t) C0) + A * dctrl