Sheila, Evan
The SR3 pitch oplev servo appears to be causing interferometer instability, so it is now turned off.
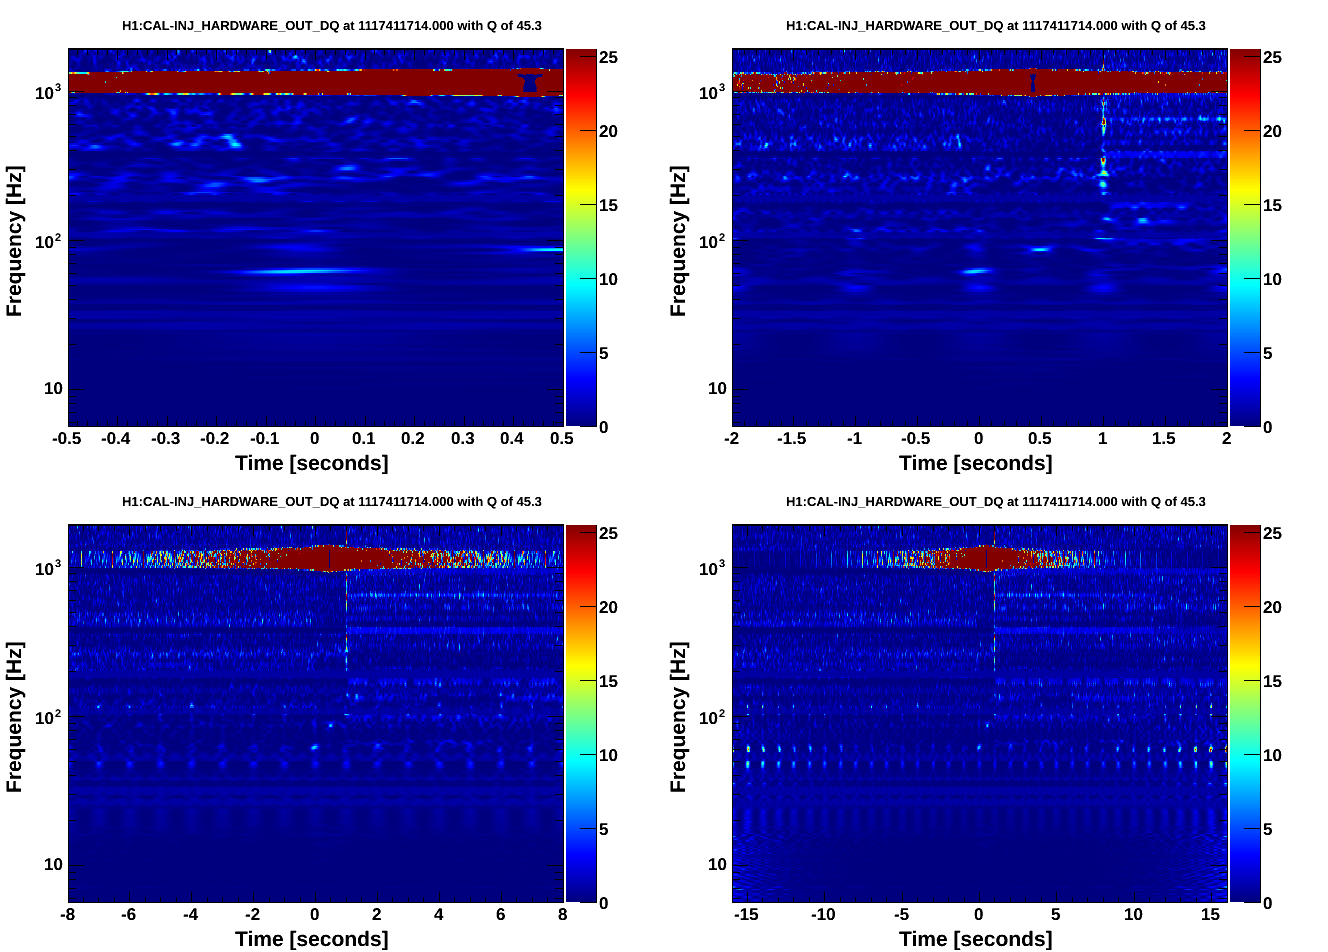
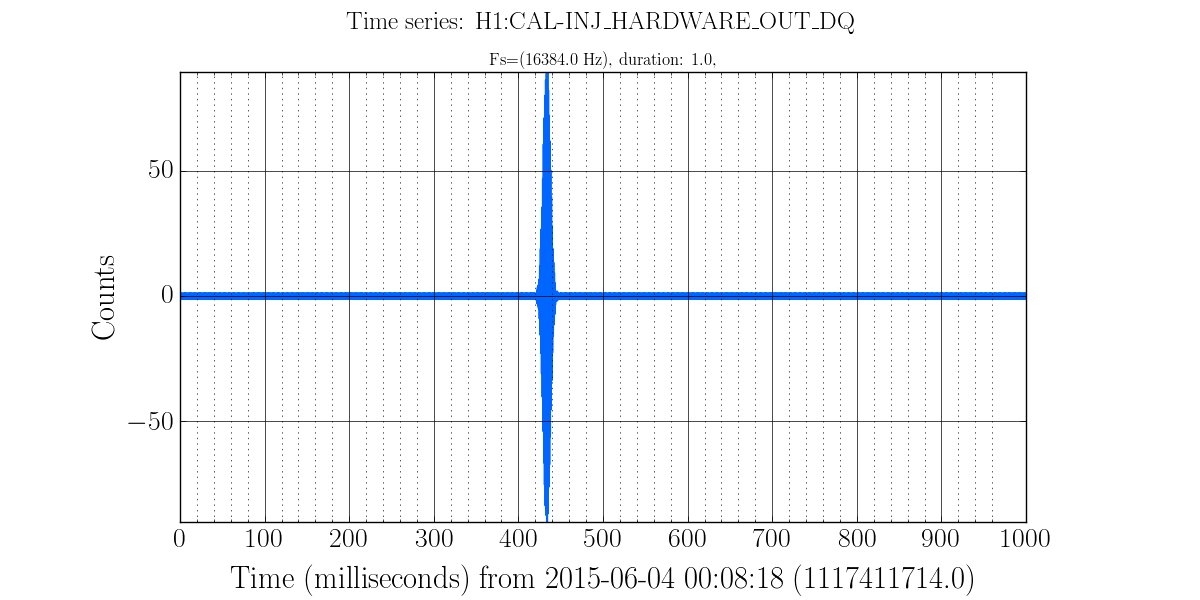
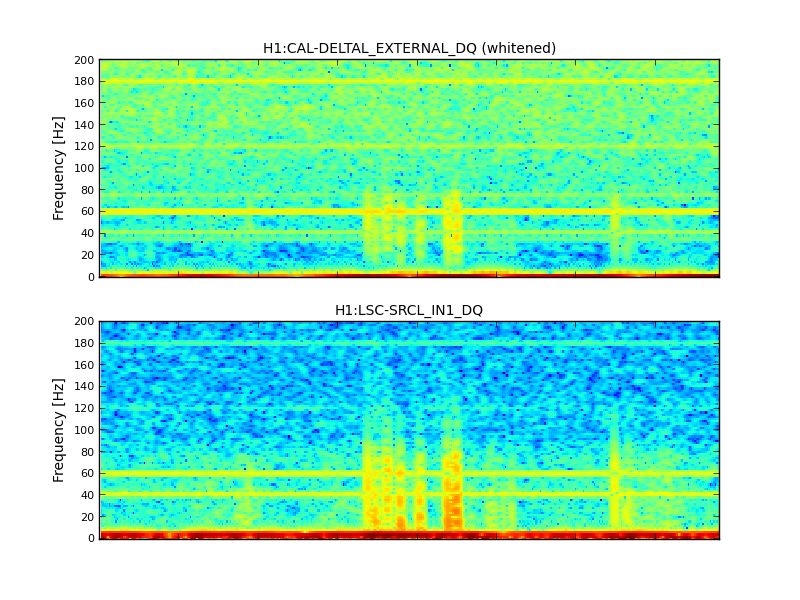
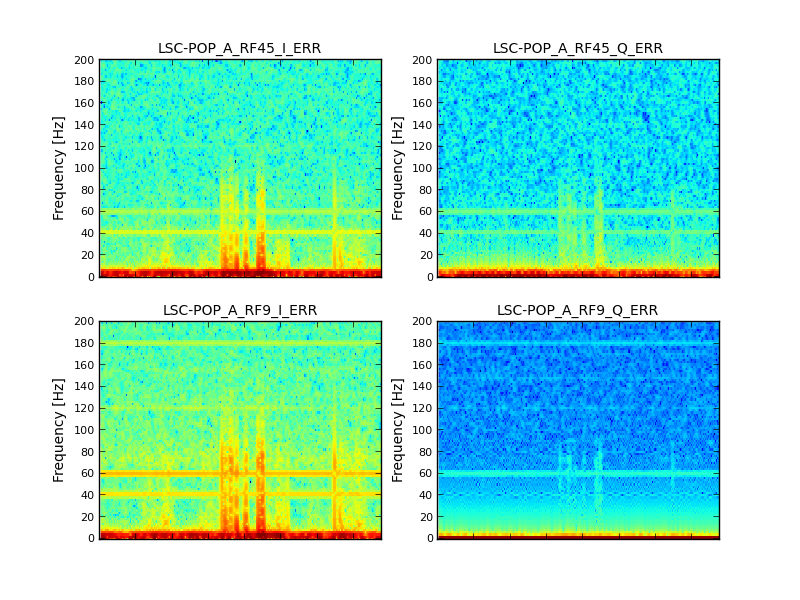
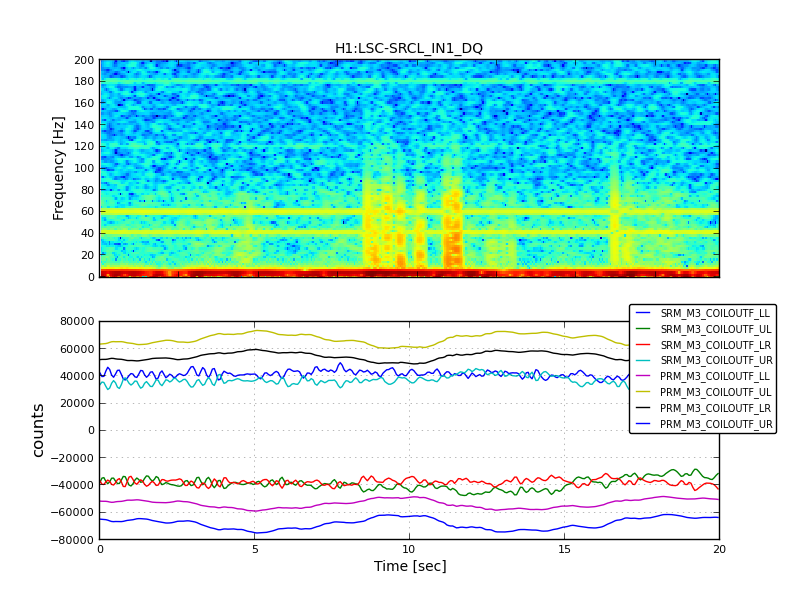
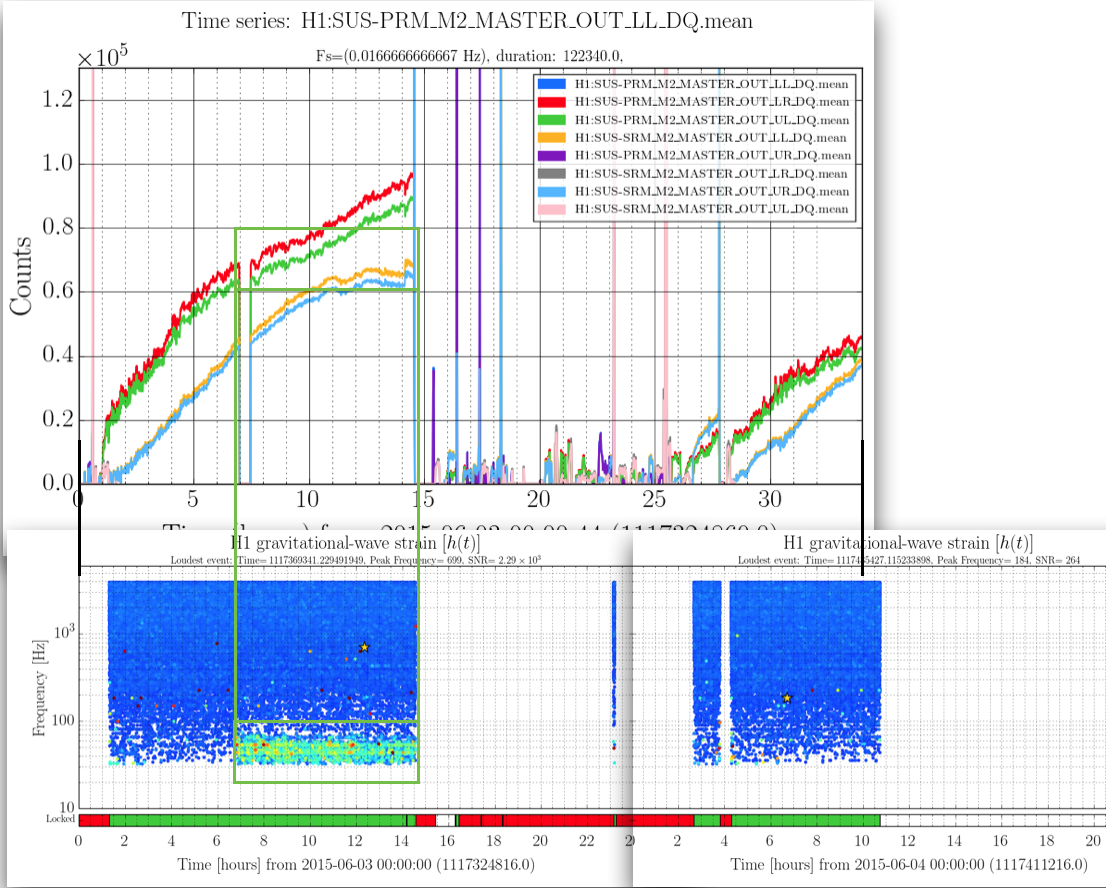
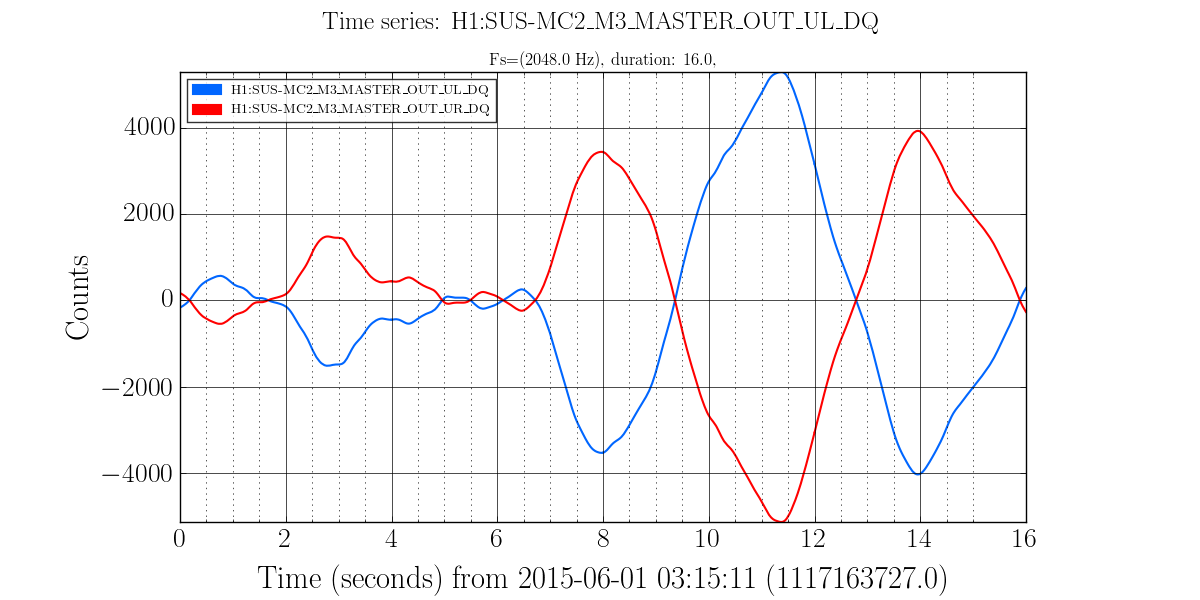
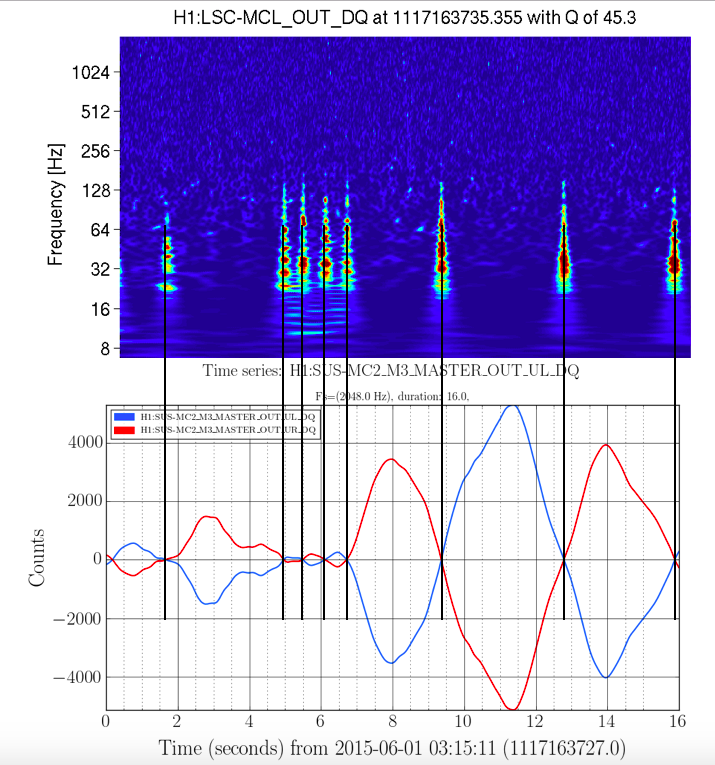
Starting this morning, we found that we could not lock the interferometer for more than 15 minutes or so, even at 3 W with DARM controlled with AS45Q. The symptom was that irregular spikes would start to appear in POP90 a few minutes after acquiring lock. One could also see the effect as 0.9 Hz ASC oscillation in the BS, SRM, SR2, dETM, and sometimes cETM loops.
We initially did not suspect the SR3 oplev servo, since it worked fine during last night's 10 hour lock. We instead tried turning off our ASC loops, but that did not solve the issue. We then sat in the DRMI configuration with arms off resonance and no ASC, but that did not solve the issue. We turned off ITM oplev damping servos, but that did not solve the issue. Then finally we turned off the SR3 pitch oplev servo, and we also disabled the top-stage PRM and SRM LSC offloading. This seems to have solved the issue.
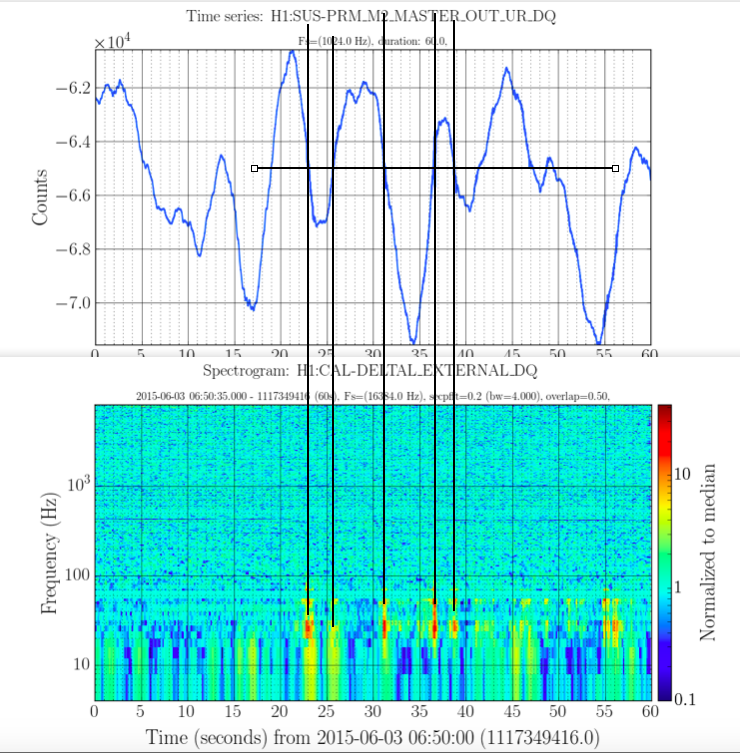
Because Sheila and Elli had at one point today turned off the offloading but still were not able to achieve a long lock, we suspect this means that the SR3 oplev servo is at fault. However, it is not obvious to us why it takes a few minutes for this spiking to start happening (one would think that if it is caused by oplev glitching, then one would see the spikes immediately). Also, at first glance there does not seem to be glitching in the oplev sum.