oli.patane@LIGO.ORG - posted 10:53, Tuesday 17 February 2026 (89168)
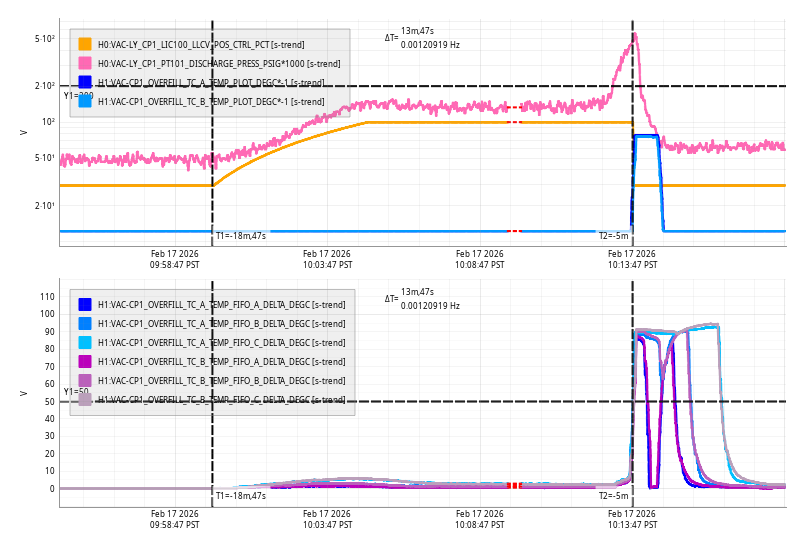
TCS Chiller Water Level Top-Off FAMIS
Closes FAMIS#28228, last checked 88988
TCSX: 30.5 - Did not add water
TCSY: 10.4 - Did not add water
Flow and filters looked good, but had to remove a notification about preventative maintenance for the filter for both chillers (TCSX, TCSY) in order to see the flow rates.
No leak in water cup
Images attached to this report