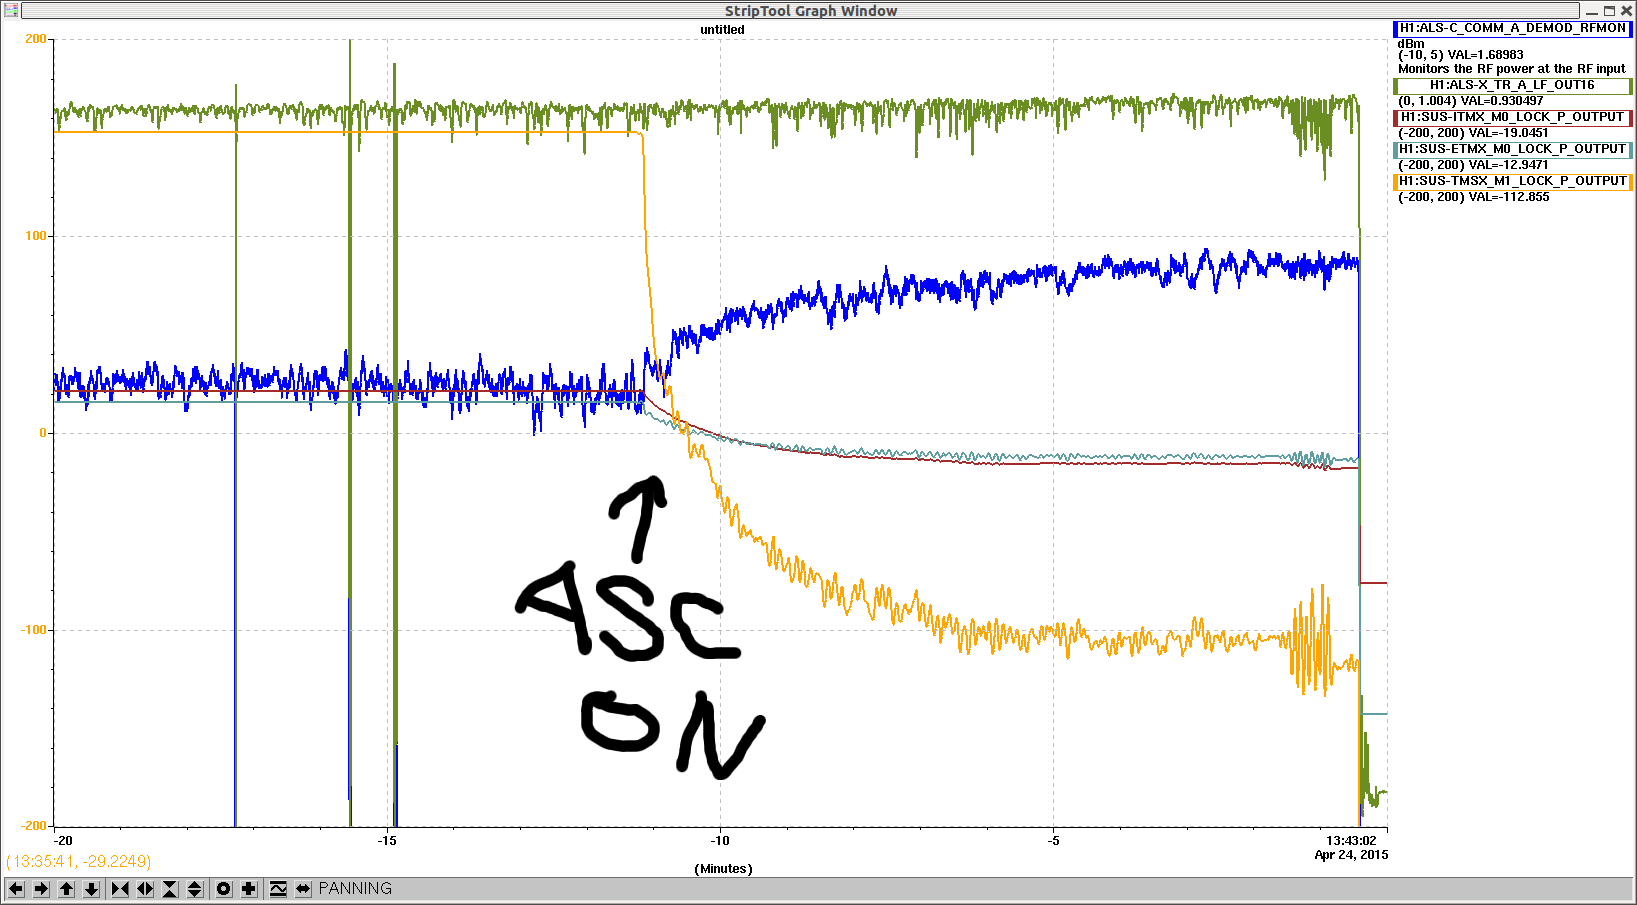
Building on Friday's work, I finished closing the ITM QPD loops. Settings are given in the attached screenshots. The pitch loops respond to a step at the error point with a 5 s time constant or so; the yaw loops respond with a 30 s time constant.
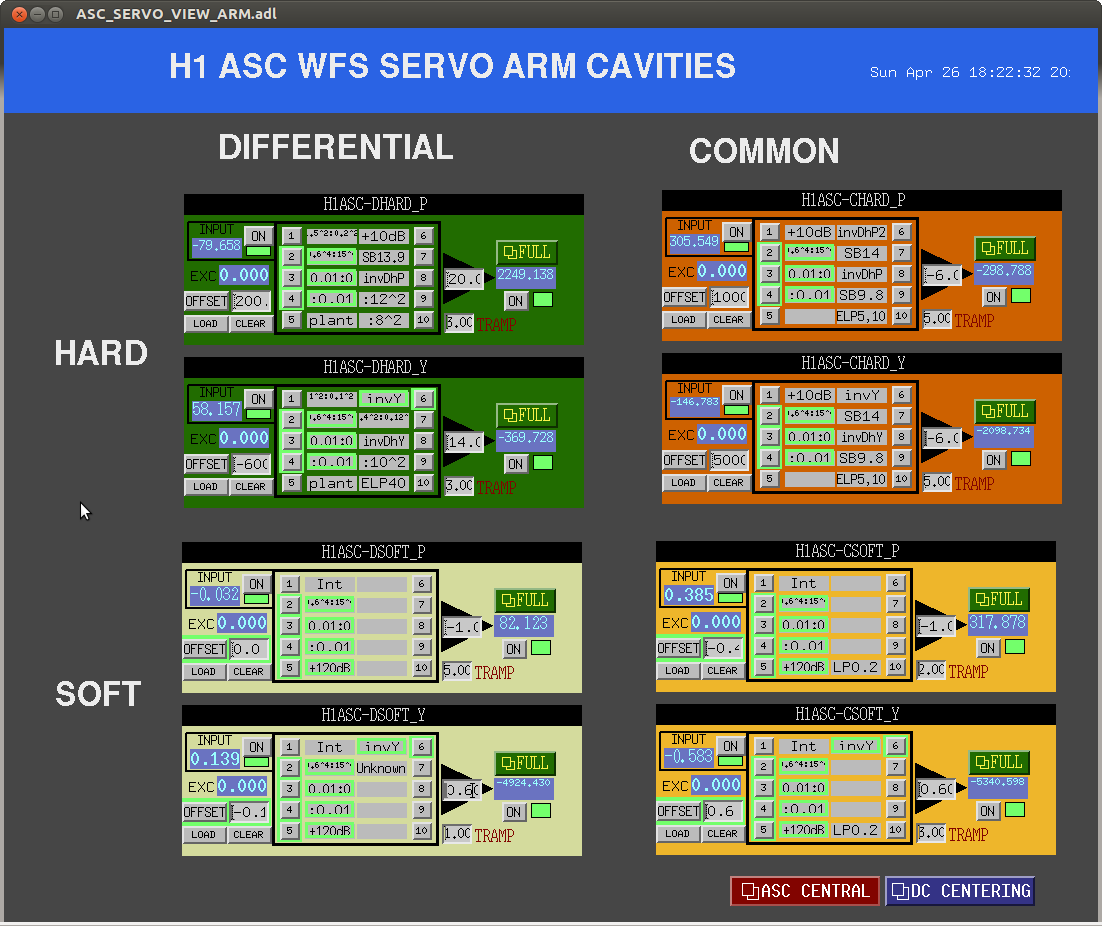
I installed 100000 ct limiters on the ITM ASC loop outputs (dSoft and cSoft), and 100 ct limiters on the TMS QPD A and QPD B pitch/yaw outputs. This prevents an infinitude of counts from being pushed onto the ITMs when the interferometer unlocks. [Failing to do this is punishable by 1 hour of roll mode damping.]
By adjusting the error point offsets, I was able to bring the recycling gain up to 38 W/W at 3 W of PSL power. I did not try super hard to push it up to 40 W/W this time.
I tried powering up to 6 W, but the recycling gain dropped to <30 W/W, the sideband buildups took a nosedive, and the ASC loops ran away. This unlocked the interferometer. I've seen this a couple times before (i.e., without the ITM loops). One story we could tell ourselves here is that the recycling gain became so low that the PR2 ASC error signals flipped sign and thereby made the loop unstable (my recollection is that the sign flip happens around a recycling gain of 30 W/W or so).
By trending the test mass oplevs (except ETMY's, which is not functional right now), one can see that most of the test mass motion during power up is usually in pitch. E.g., for a lock from a few days ago (2015-04-26 06:55:00 UTC, from 2.3 W to 11 W) I found IX moved by 0.61 µrad in pitch and 0.15 µrad in yaw, and EX moved by 0.20 µrad in pitch and -0.09 µrad in yaw.
I tried powering up a few times with the ITM loops off. The interferometer went from a recycling gain of 37 at 3 W to 35 at 10 W to 33 at 14 W. I tried moving the ITMs, PR3, and PRM in various combinations but could not seem to improve the recycling gain at 14 W.
I did not experience the 0.4 Hz instability today. The ITM oplev damping was on the whole time. Additionally, I tried powering up a few times with dc-coupled oplev loops feeding back to the ITM L1 stages (with the QPD loops off). This may have helped marginally in keeping the recycling gain from dropping too much, but it's hard to say.
Additional CDS work to Tuesday maintenance: upgrade end station ALS models to RCG branch2.9, use new RFM_DELAY feature for all ALS RFM senders to remove ASC receive errors.
Correction on injection work, no upgrade of the hardware injection machine, new h1calcs model to be installed.