Sheila, Gabriele, Evan, Koji, Dan, Alexa, Elli
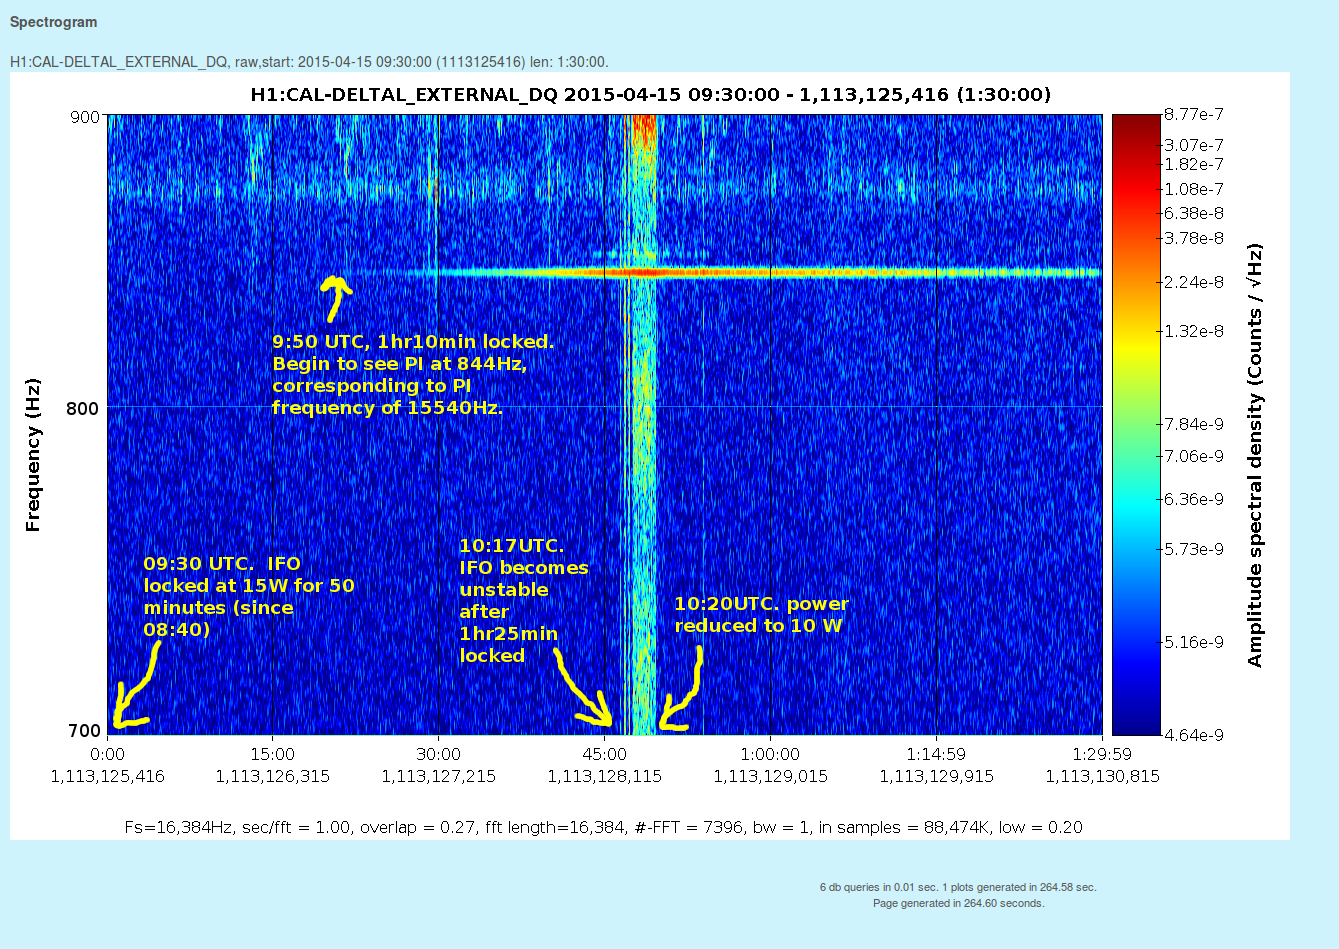
Yesterday Koji, Evan and Sheila locked at 15W, and after an hour and a half the lock became unstable and they reduced they power due to suspected PI. A spectrogram ('darmspectrogram3_1.png ') of last night's lock shows a 844Hz line grow in the DARM spectrum (see attached spectrogram from 2015-04-15 09:30:00 UTC). This corresponds to a PI at frequency 15540Hz, which is the first PI LLO saw (LLO alog 15934). The line appears about an hour after the 15W lock began and the power was reduced after 1hr25min. Once the power was reduced to 10W the line got smaller.
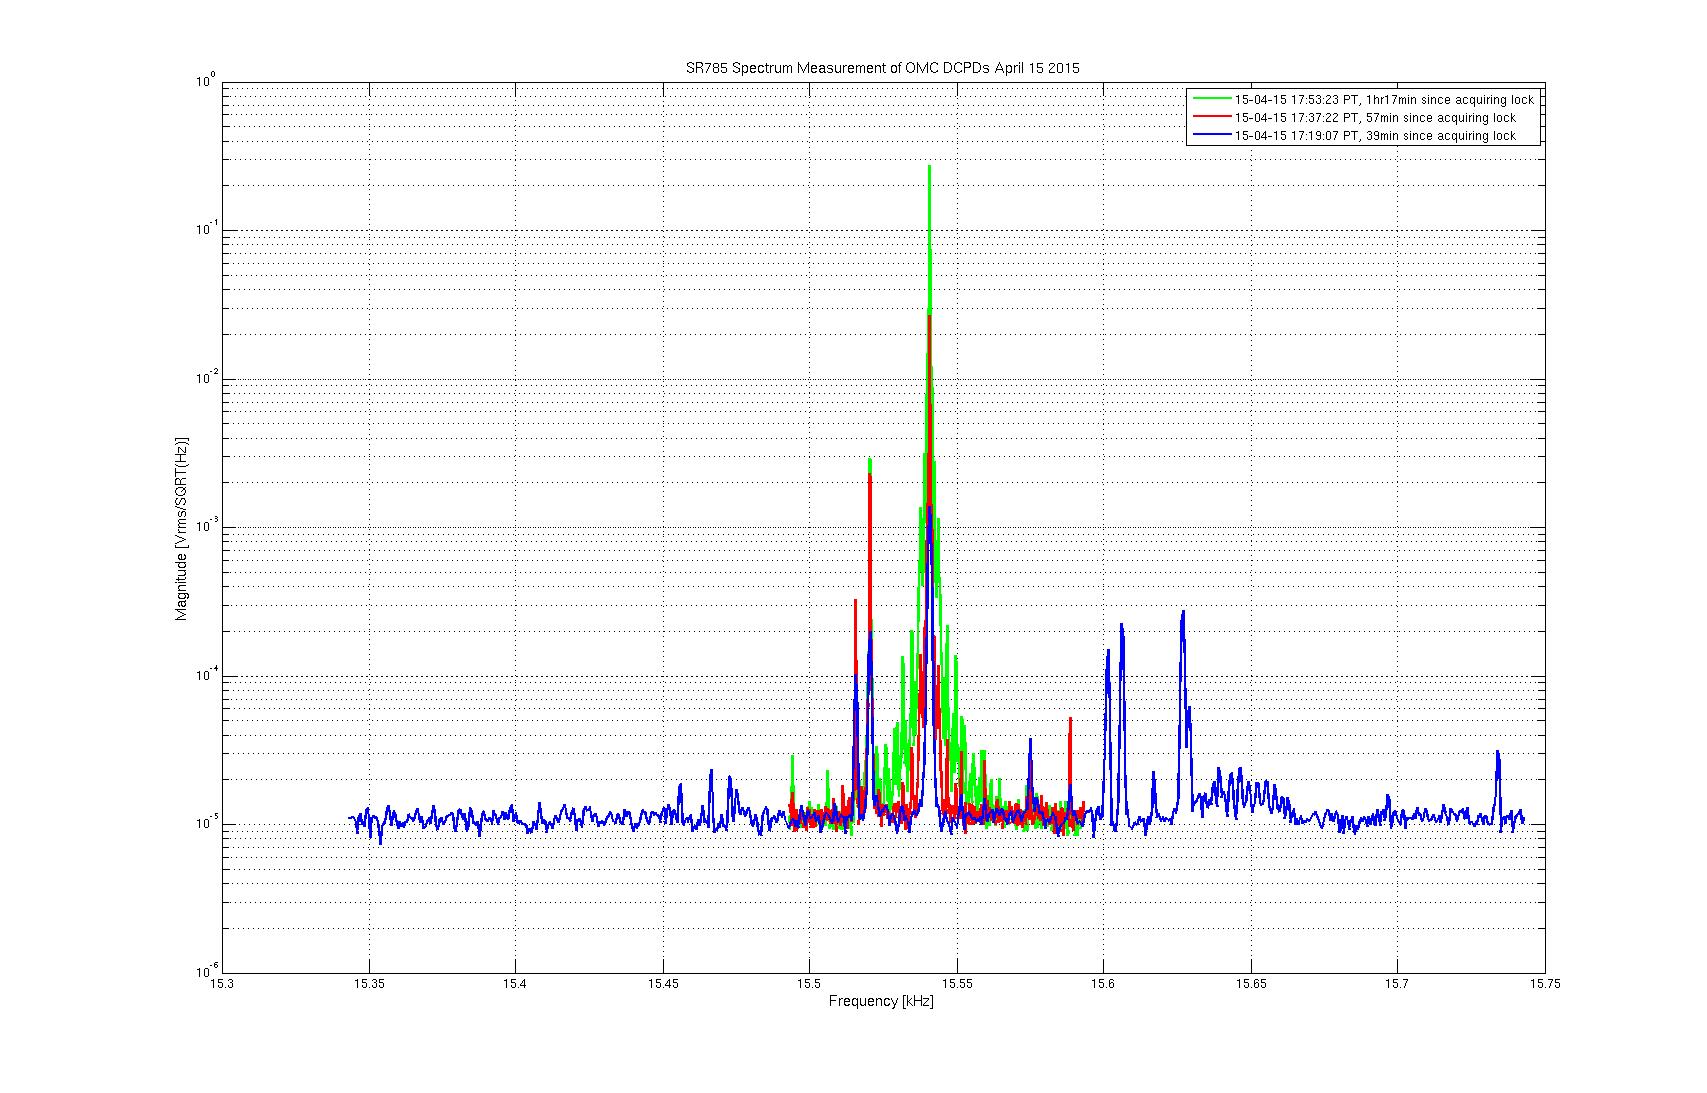
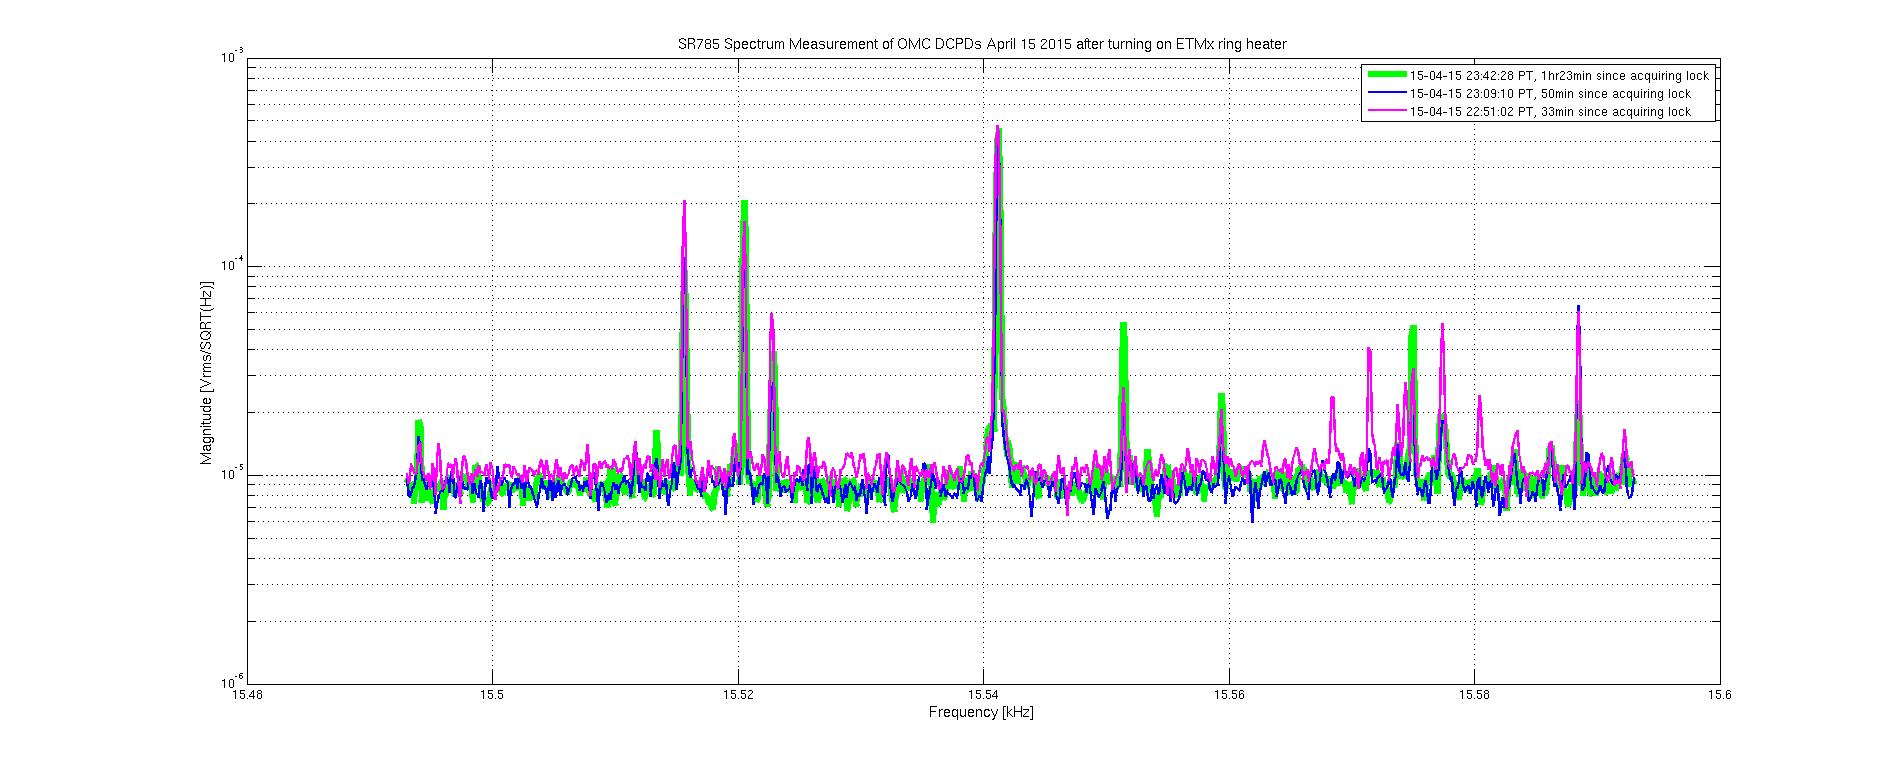
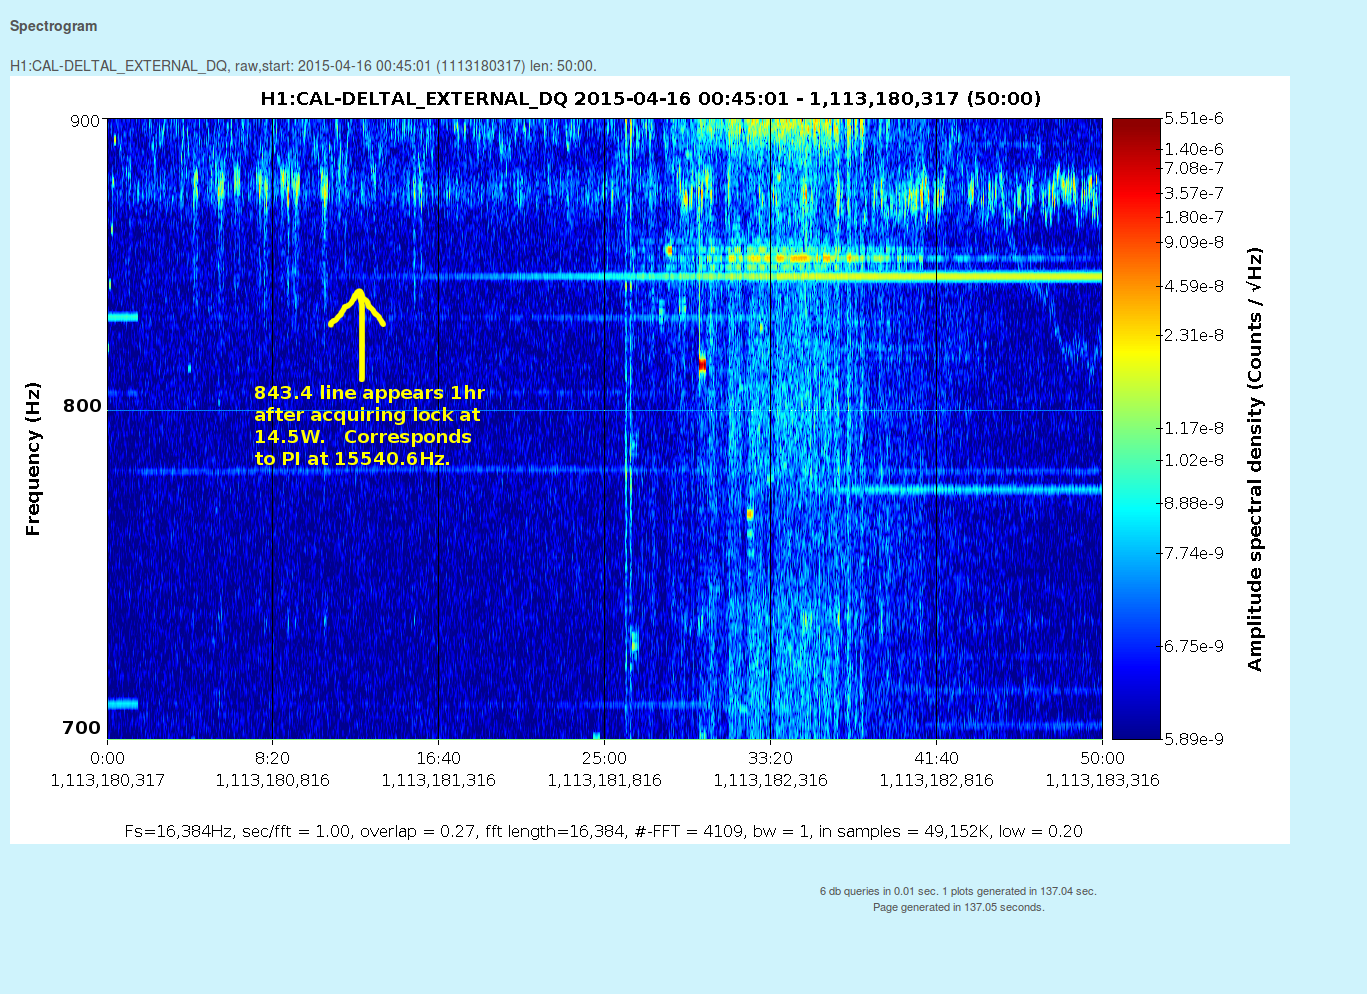
This evening we locked at 15W at 2015-04-15 23:40:00 UTC and we saw the same line grow at 843.4Hz, corresponding to a PI at 15540.6Hz (see spectrogram 'spectrogram16April_843HzPI.png '). This line grew untill we lost the lock at 1hr55 mins later ~ 2015-04-14 01:35:00 UTC (not due to the PI). We measured the DARM spectrum around 15.5kHz using the SR785. Attached is a plot '16AprilDARMSpectrum.jpg ' of the growing 15.54kHz line.
Grabriele saw that the 843Hz line was coherent between between the X-arm ASC QPDs and Darm, so we turned on the ETMx ring heater (see alog 17899). The ring heater is requesting 1W total, or 0.5W each on the upper and lower segments. We locked for a second time tonight at 15W at 2015-04-16 05:18:10 UTC. With the ETMX ring heater running, we didn't see any growth in the 15.54kHz line, as measured by the SR785. See 2nd plot '16AprilDARMSpectrum_withETMXRH.jpg '.
Measurement notes:
-Spectrogram generated at LigoDV https://ldvw.ligo.caltech.edu/ldvw using channel H1:CAL-DELTAL_EXTERNAL_DQ.
-Spectrum meaurement taken with SR785 connected to OMC DCPD readout. There is a script in /ligo/home/eleanor.king/netgib/SR785/SPSR785omcdcpds.yml that is used to take the spectrum (use the command < ./SRmeasure SPSR785omcdcpds.yml > to take a measurement).
-Dan points out there are also OMC DCPD 64kHz testpoints which are channels H1:IOP-LSC0_MADC0_TP_CH12 and H1:IOP-LSC0_MADC0_TP_CH13, which correspond to DCPD_A_INMON and DCPD_B_INMON.

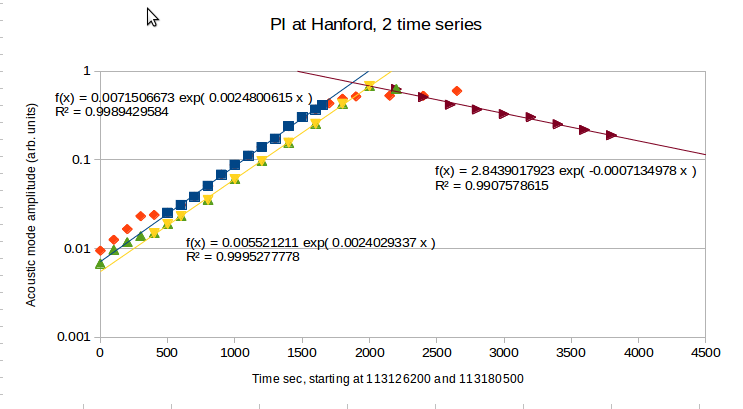
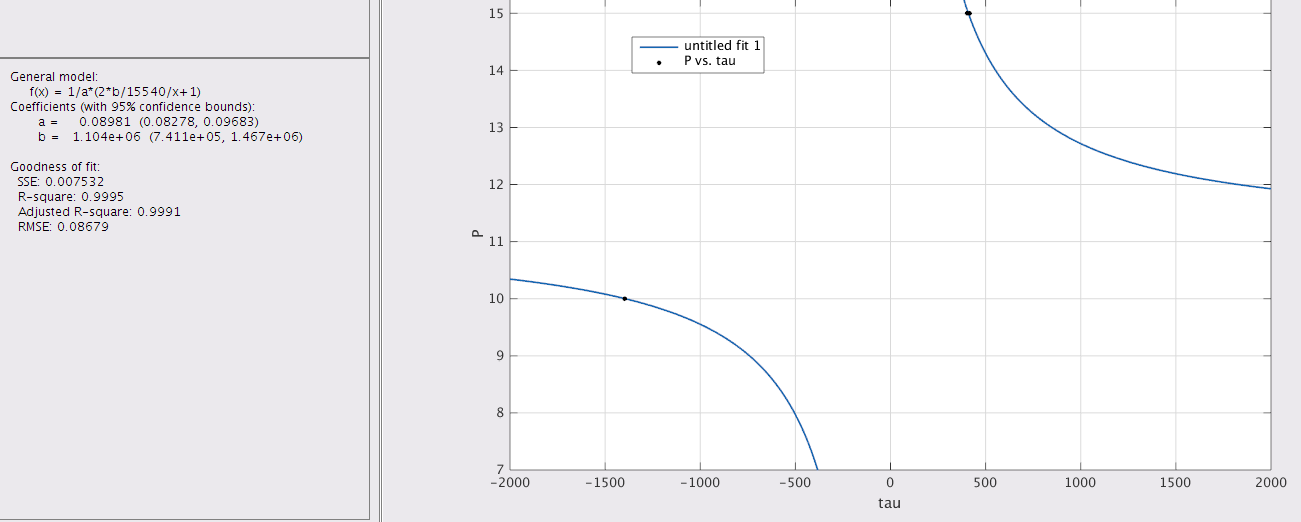
How exciting!  We have found that 0.4W per segment is best at present.  At 0.55W there is another mode that rings up in a very short time, it appears around 1360, or 15004 in the IOP channels.
You get a lot earlier warning looking at the IOP channels as mentioned, The IOP ASC_TR_ channel test points at are also nice as they have a lot less mess.
Fitting this data as was done by Mathew Evans with in the PI observation paper results in a mechanical Q of 6.9M, the fit is not very good though with essentially 2 data points.
Specifically the equation for the fit is τm = 2Qm / (ωm(Rm − 1))
τm - time constant of ring up, Qm - mechanical mode Q, ωm - mechanical mode frequency, Rm mechanical mode parametric gain = const * Power
where 'const' is dependent on frequency overlap condition, spatial overlap, Q factors and some other stuff.  So it assumes generally the only thing that is varied is the Power.