edmond.merilh@LIGO.ORG - posted 10:21, Wednesday 06 May 2015 (18272)
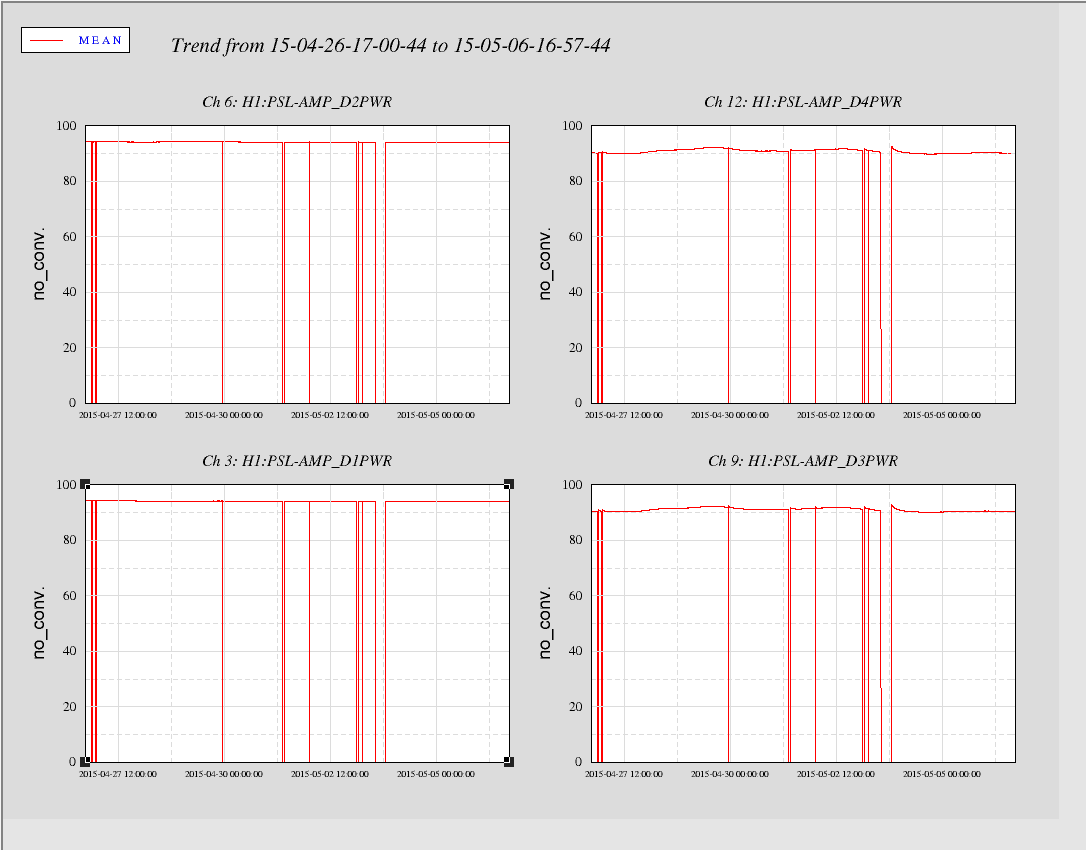
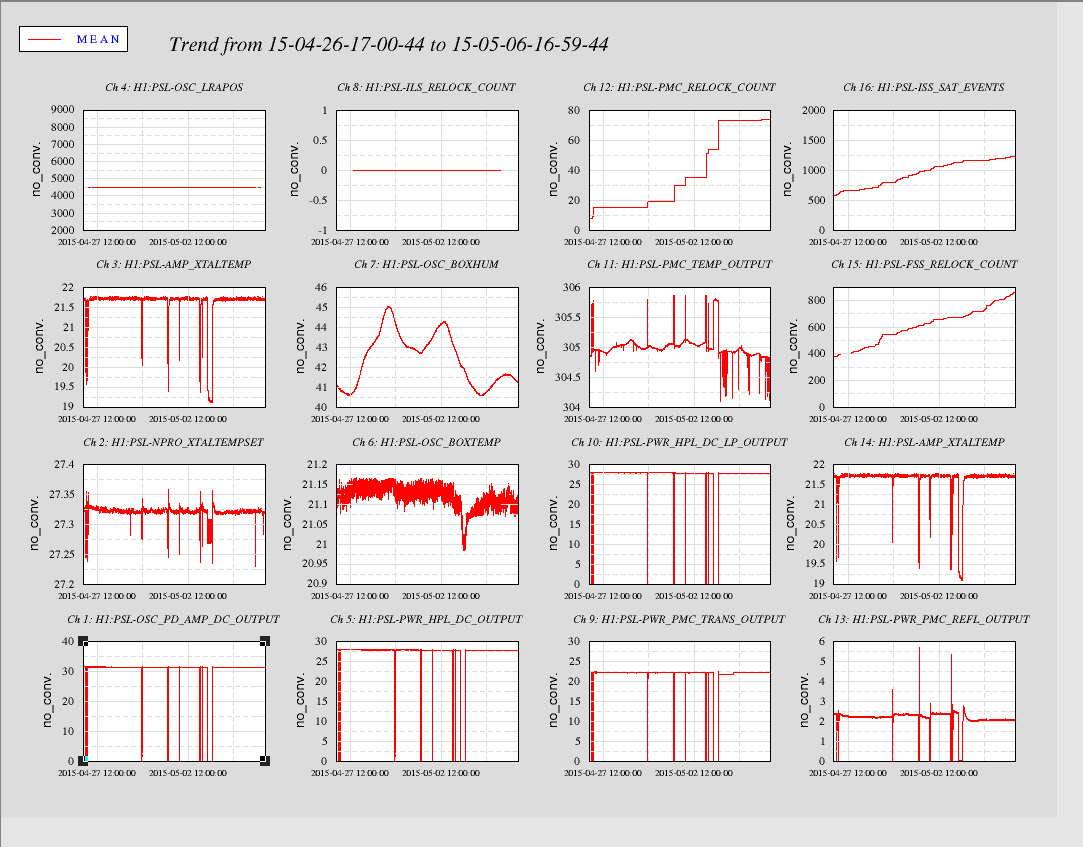
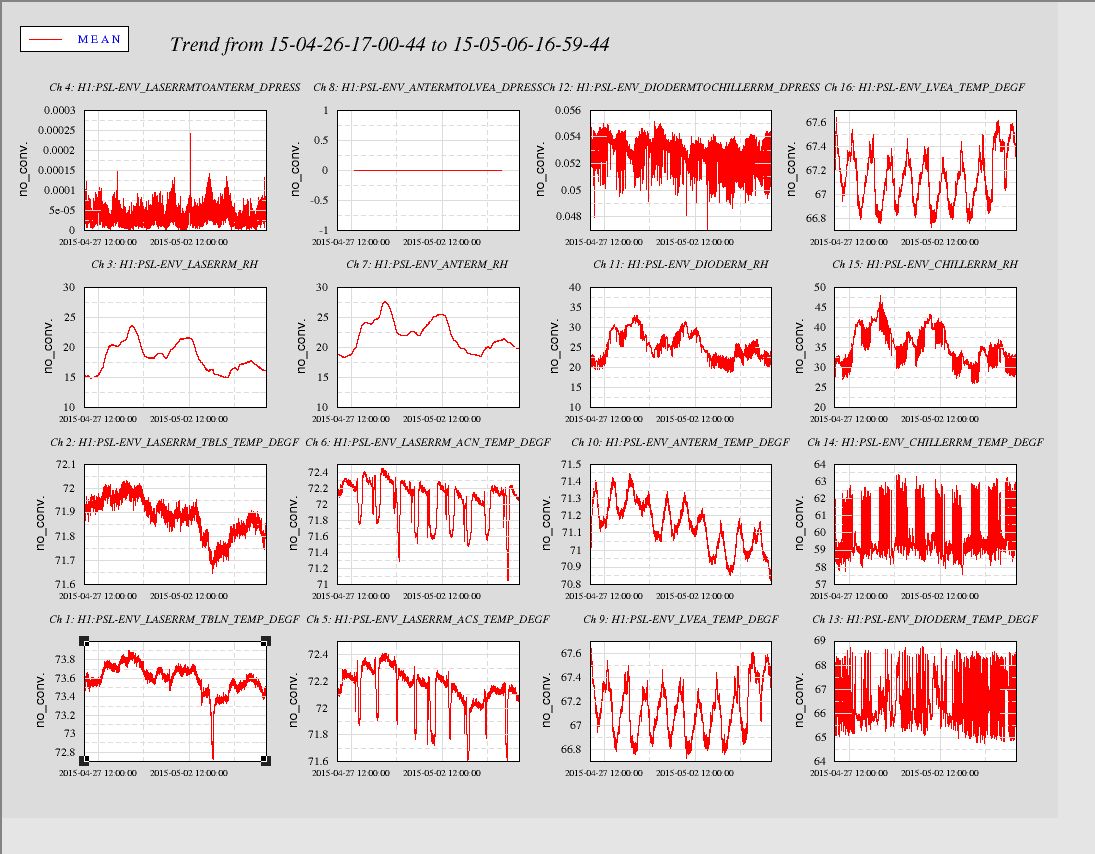
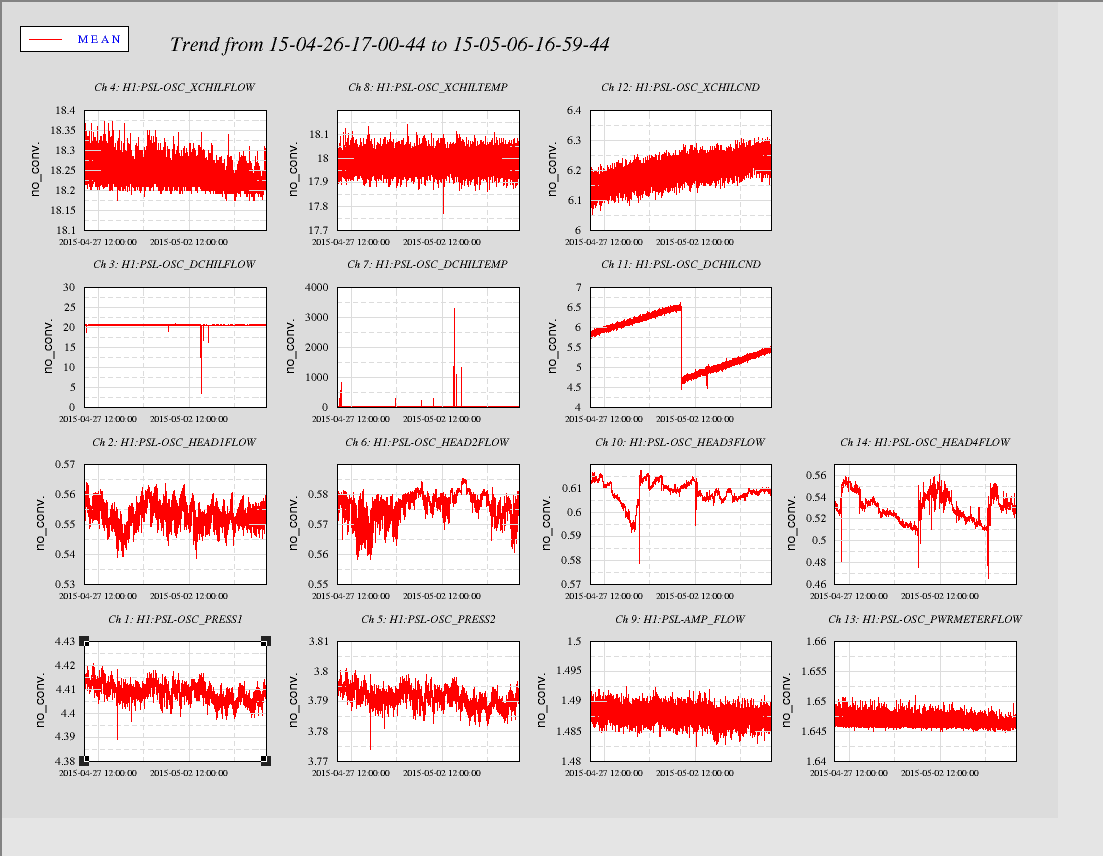
PSL Weekly Report - Past 10 day Trends
Images attached to this report
After adding the OFFLINE state, alog 18081 , it was found that the offsets will cause drift in this state as well like in alog 17929 . So, after talking to Kiwamu, I changed it to disable the offsets in the OFFLINE state as well as in the FAULT state and removed it from the DOWN state. The offsets are still enabled in the LOCKED state as before.
Scott L. Ed P. Chris S.(Cris M.1/2 day)

5/4/15
Cleaned 21.3 meters ending at HNW-4-028. Removed lights and relocated all equipment to next section. Began vacuuming and spraying bleach/water solution.

5/5/15
Cleaned 73 meters ending 14.5 meters north of HNW-4-031.
Evan, Sheila
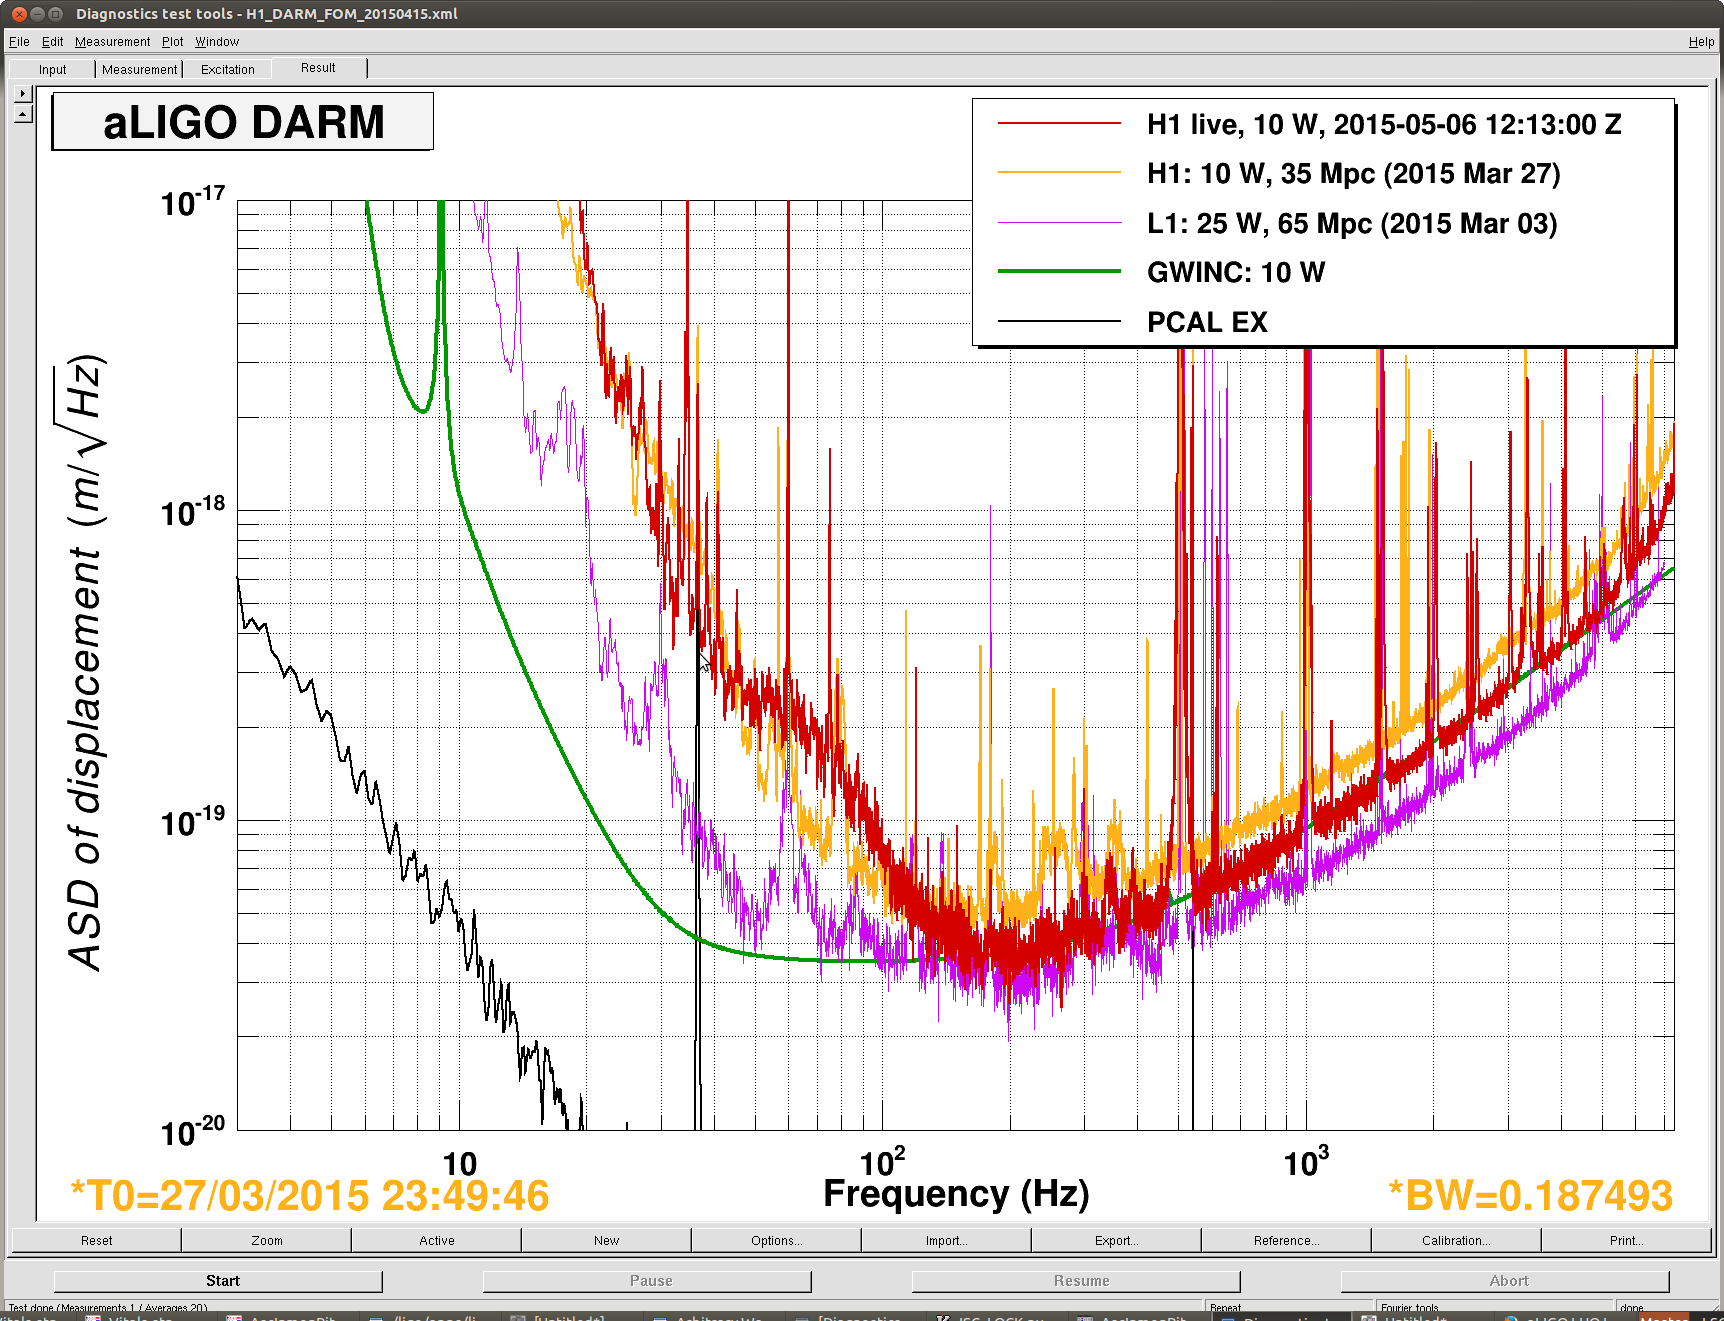
Tonight we have some evidence that the work on recylcing gain has helped us, Evan will attach the DARM spectrum.
Restoring the green camera offsets to the ones used during the mini run means that we can again lock with a recycling gain of ~37. These wrong references and the bad alignment that went with it has probably caused some of the frequent lock losses of the last two days, and headaches in turning on ASC in full lock. Hopefully we can leave all green references alone for at least a week and see that they really do bring us back to a good recycling gain consistently. My comments from yesterday about trying to figure out what drifts in green should be ignored.
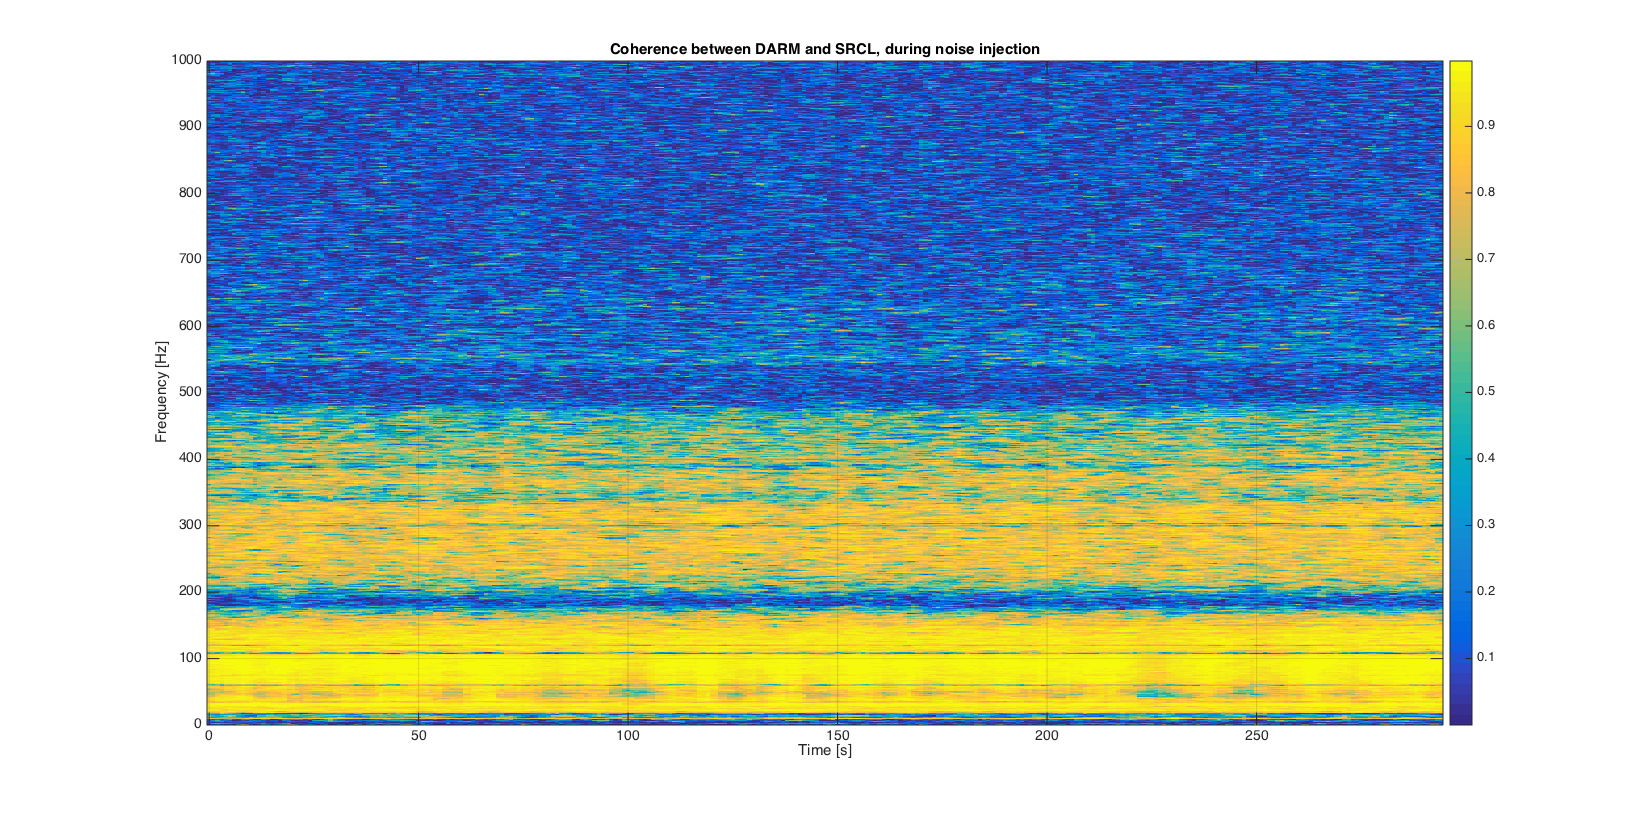
We did some injections of noise into SRCL with all of our boosts on (MICH L, SRCL, DHARD P+Y), and the AS_C to SRM+SR2 loop at a 4 Hz bandwidth. 38 W/W recycling gain. UTC May 6 11:48-11:53 UTC, no SRCL FF but MICH FF was on. The goal was to see how stationary the coupling is now.
We also restored some of the ASC cut offs that were deleted during the recycling gain work, CHARD PIT +YAW, DHARD P+ Y (for DAHRD P we are only using one of the two cutoffs we had, a pair of complex poles at 12 Hz, we don't have enough phase to use the 8 Hz cut off anymore so we wil need to redesign it if we need it)
Other business
We think that some usefull next steps on the list are
Spectrum attached. We are touching the 10 W GWINC curve from 200 Hz to 4 kHz. We have been able to do this a few times before by maxing out the gain of the CARM loop, but that was not necessary tonight.
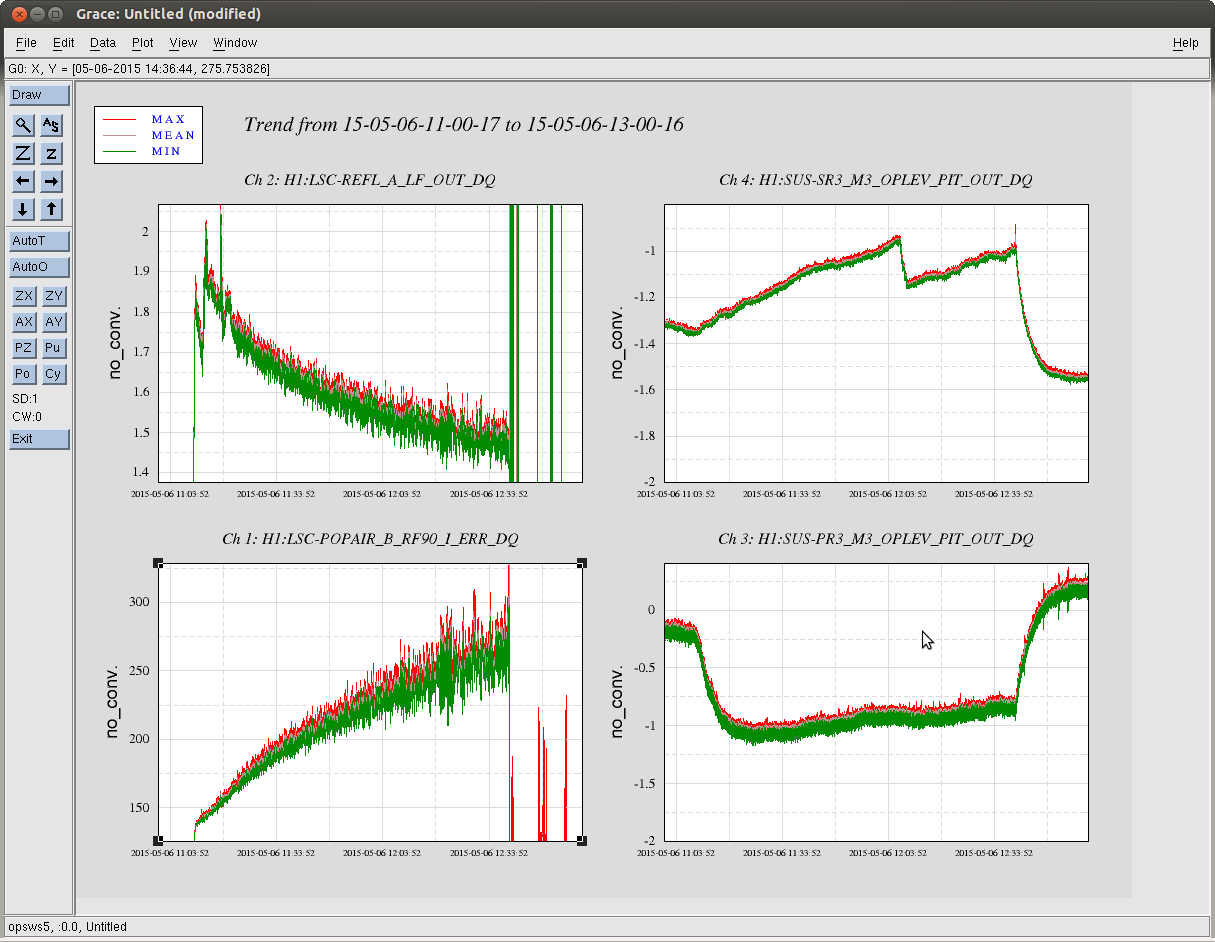
Also I'm attaching a trend of POP90 and REFL_A_LF during the lock. There is some slow (perhaps thermal) drift. I looked at the PR3 and SR3 oplevs in pitch. PR3 seems to have a faster transient, while SR3 has a similarly slow drift. I tried touching SR3 to compensate for this (around 12:05:00Z), but it seemed to make no difference.
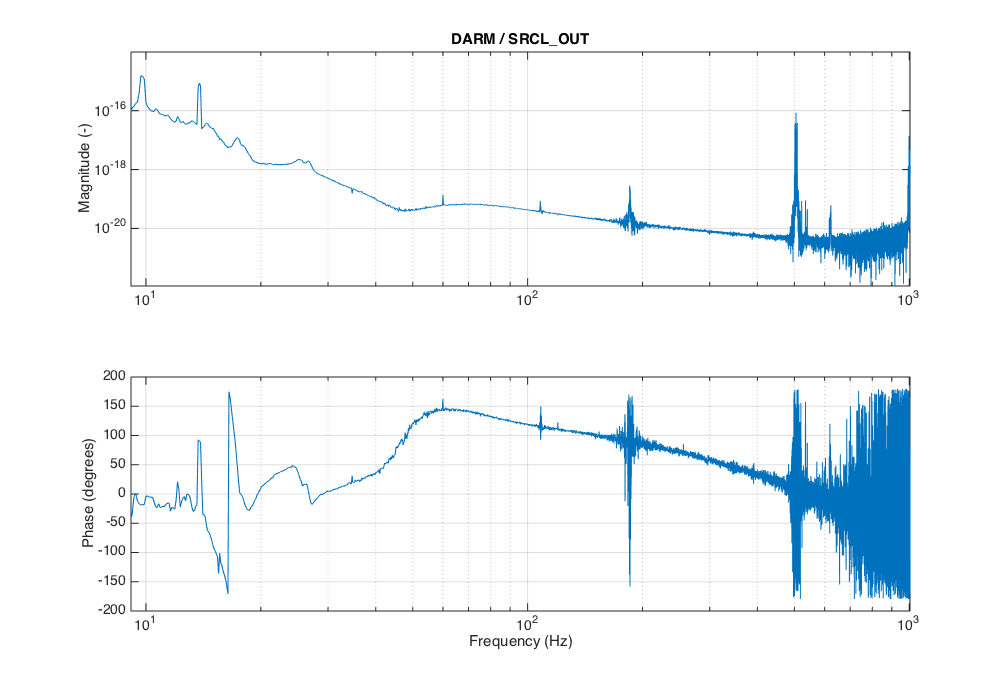
Also attaching a DARM OLTF.
The SRCL coupling is much more stationary now. During the noise injection, the coherence between DARM and SRCL was good. The first plot shows the measured TF between SRCL_OUT and the calibrated CAL-DELTAL signal.
I analyzed the data using the same technique explained in previous entries (17912, 17928, 18026). The second attachment shows that the coherence is stationary over time and the third attachment is an animation of the TF between SRCL_OUT and DARM over time. It's remarkably more stationary than before.
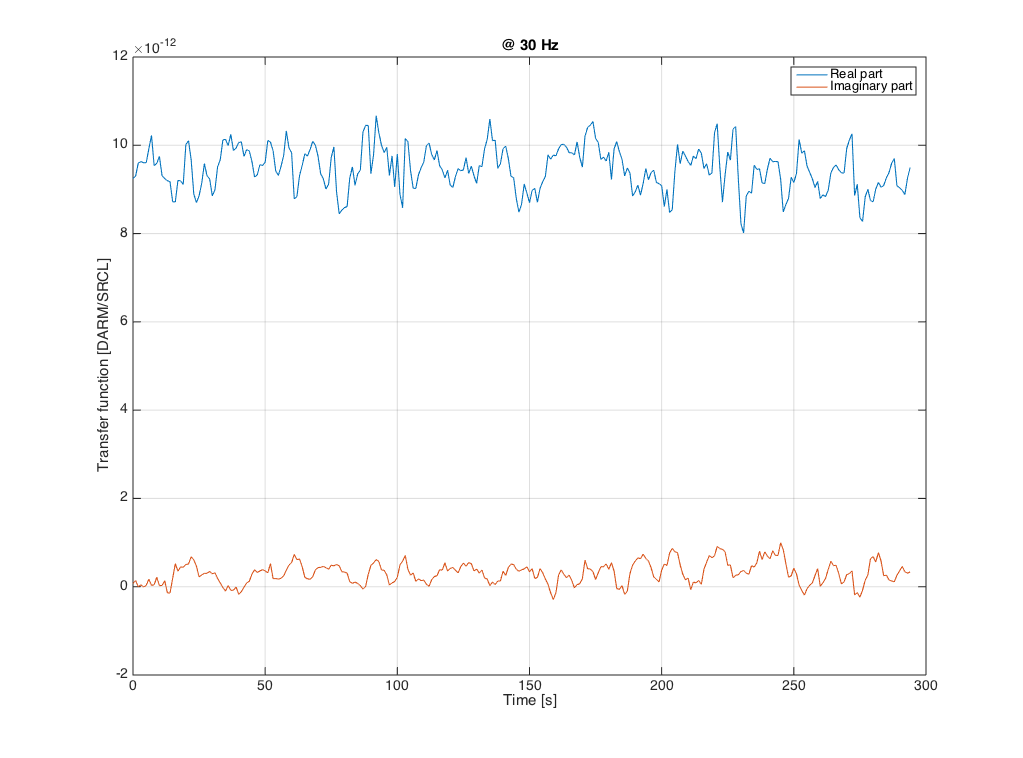
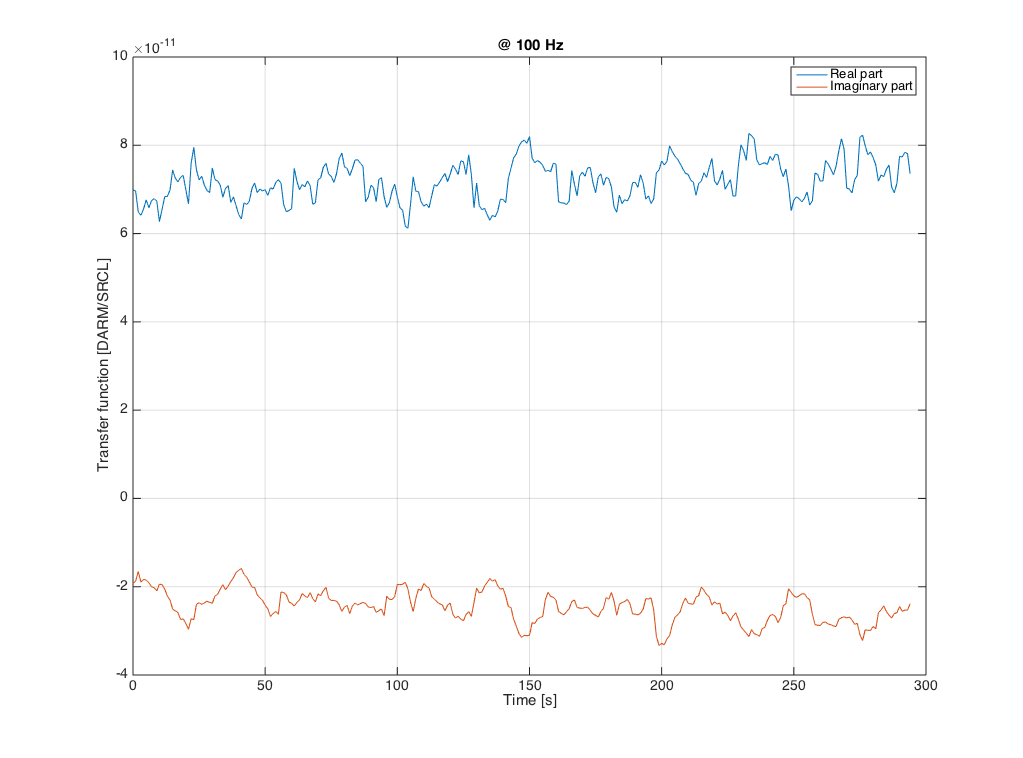
Finally, the last two attachments (4th and 5th) shows the time evolution of the transfer function at 30 Hz and 100 Hz. The residual variation of the TF is about 5%, which may very well be within the error of my estimaton.
We don't seem to be ablke to use the lockloss tool tonight, I get this message. I'm not sure if this is realted to bug 834, or to some maintence activity today.
sheila.dwyer@opsws4:~/Desktop/Locklosses$ lockloss select
This was the result of the guardian log time stamp change, which slightly changed the format of the time stamps in the logs.
It should be fixed now.
thanks
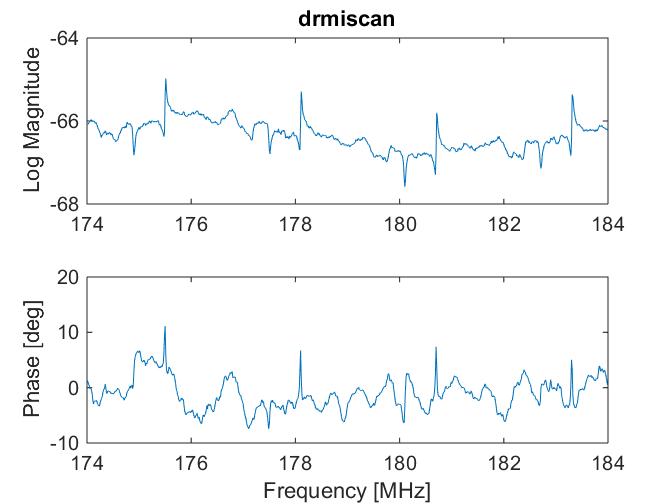
Kiwamu, Keita, Elli
Today locked aux laser to swept frequency offset to carrier laser using PLL. A network analyser provides a swept LO signal (7dBm into ZFM-4+ frequency mixer, or 10dBm if using a splitter.) The RF signal is the beatnote of carrier and aux laser frequencies, which is demodulated against the LO using a ZFM-4+ mixer and 1.9MHz low-pass filter. This error signal is sent to an LG1005 servo controller, P-I corner 10kHz, gain 4.1, LFGL 50dB. We amplified the RF sigal (1611 pd on IOT2R) using 17dB ZFL-1000+ RF amplifier, as the error signal of the PLL was very weak; this made locking the PLL easier. The PSL pwer was 2.3W, the aux laser power set to 500mW.
We noticed changing IM4 alignment during initial alignment changes alignment of beams onto the 1611 photodiodes enough that a quick realignment may be necessary. This is a little painful as this alignment is done on IOT2R, where the aux laser is. The aux laser frequency takes some time to settle after opening the table. Again today we used the 1611 pd on ISCT1. I unplugged the power to the bbpd-refl photodiode (the 3f refl pd) in order to power the 1611, and then changed this back again after I was done.
To take the measurement we locked DRMI 1f with ASC. To engage PRC1, we adjusted the centering offset on Refl-DC WFS. We looked at the signal reflected from DRMI using a 1611pd on ISCT1 on the reflair path, and measured the transfer function of this reflected light intensity over the LO frequency. Could see transmission dips every ~2.6MHz, which correspond to the auxiliary laser resonance in PRC. Also some other peak which may be higher order mode. Currently producing a model to make sense of this, and to decide what frequencies will be useful to measure at.
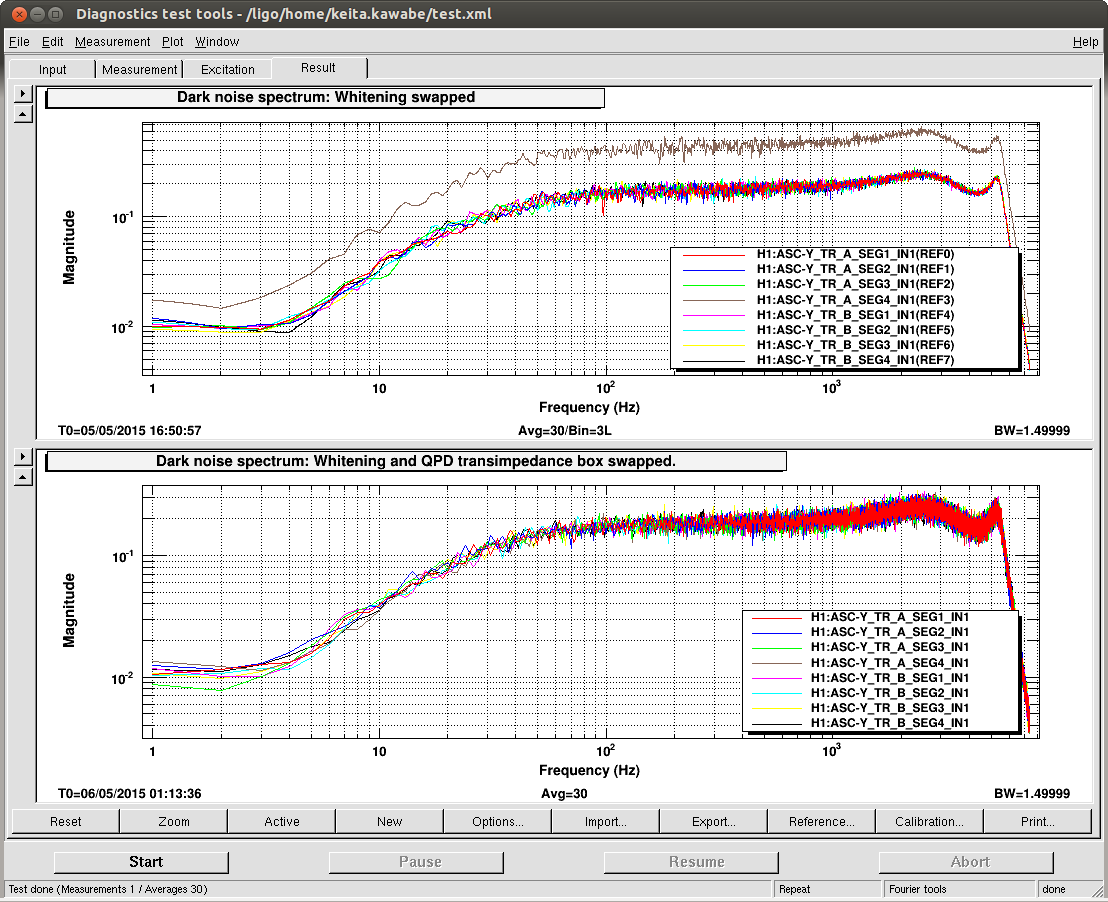
After the whitening chassis was swapped, the worst problem went away, i.e. QPDA seg2 looked healthy. However, smaller problem, i.e. the dark noise level of QPDA seg4 being about a factor of 2 or 3 higher than everybody else (attached top), persisted.
Disconnecting QPD cable from the transimpedance box did not change the behavior, but disconnecting the cable between the transimpedance box and the whitening chassis did.
Anyway, QPD transimpedance amps was also swapped and everything looks good (bottom).
Removed and replaced the annulus Ion Pump, aux pump cart will remain pumping on annulus system for some time.
As of this entry the current for this pump is at 3.02 mA.
Reset HAM5 and ITMY.
Added 15 channels. Removed 50 channels.
2 channels remain unmonitored:
H1:SUS-SR2_LKIN_P_OSC_SW2R
H1:SUS-SR2_LKIN_Y_OSC_SW2R
07:54 Elli to IOT2R
08:08 Jeff B. to LVEA to pull data out of humidity/temperature monitor in desiccant cabinet
08:14 Filiberto to end Y to swap whitening board for ISC
08:14 Karen to end Y to clean
08:36 Jeff B. back
08:56 Gerardo to LVEA to move pump cart in preparation for replacing annulus ion pump on BSC1
09:06 Karen and Filiberto leaving end Y
09:12 Jim B. finished updating GDS tools
09:30 Nutsinee to LVEA to find Elli
09:32 Kiwamu starting calibration of ETMX and ETMY optical levers
09:39 Keita checking swap of whitening board, misaligned ETMY
09:41 Nutsinee to LVEA to work on HWS table by HAM4
09:44 Gerardo out of LVEA
09:47 Dave restarted the guardian machine
09:49 Kyle to end Y to start bakeout of BSC6 RGA
09:55 Keita done on ETMY, to LVEA to talk to Elli
09:56 DAQ restart
10:00 Robert to LVEA to setup for PEM injections
10:01 Jim B. finished update of command line nds tool
10:23 Cris to end X
10:34 Kiwamu done optical lever calibration
10:40 Gerardo beginning replacement of BSC1 annulus ion pump
10:41 Nutsinee misaligned TMSY
10:58 Guardian restarted
11:18 Jim W. installing new ISI filters on ETMY
11:37 DAQ restart
11:47 Kiwamu calibrating PR3 optical lever
11:59 Kiwamu and Jason to LVEA to check whitening settings on PR3 optical lever
12:10 Cris back
12:23 Robert to end Y to set up for PEM injections
12:25 Kyle back from end Y
12:28 Kiwamu and Jason back
12:31 Kyle to LVEA to help Gerardo
12:49 TJ to end X to turn BRS damper on
12:59 Robert back
13:30 TJ back
13:37 Keita to end Y to look at transimpedence amplifier for QPDs
13:41 John to LVEA to look at platform Gerardo is using
14:02 Jeff K. to CDS electronics high bay
14:04 John and Kyle to end X mechanical room to change voltage on ion pump controller
14:05 Gerardo to LVEA
14:22 Gerardo back
14:42 John and Kyle back
15:08 Keita back from end Y
16:14 Elli, Keita and Kiwamu have locked DRMI and are taking a measurement by HAM1
To help with diagnosing the large cpu loading we were seeing on h1guardian0, at Jamie's request I have installed munin on h1guardian0. It is currently running with the default configuration and reporting its output to the URL:
https://lhocds.ligo-wa.caltech.edu/exports/munin/h1guardian0/localdomain/localhost.localdomain/index.html
h1asc model has a modified filter file which has not been loaded. The change is to ASC_SRC1_P and ASC_SRC2_Y. At some convenient time in the future these chages should be loaded or removed.
h1iopasc0 infrequently shows a CPU max of > 15uS which I think is a new behaviour. It has happened twice in the past week.
Guardian is including TCS_ITMY in its channel lists (e.g. H1EDCU_GRD.ini) but this node is not running. This is causing the DAQ EDCU being purple.
HWS ETMY is missing an EPICS channel which does exist in ETMX. This is also causing the DAQ EDCU to be purple.
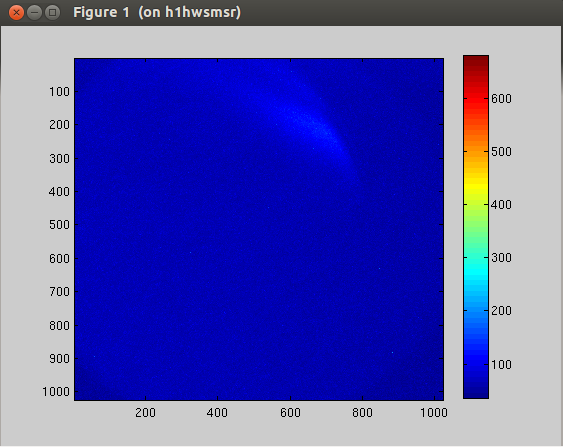
Aidan suggested that I align the irises to the sled beam rather than alinging the sled beam to the irises so I went in and redid the alignment for the ITMX HWS optics. I blocked the green light, centered the sled beam to the mirrors/lenses and adjusted the irises accordingly. Then I let the green light through, fine tuned the irises positions and made sure the green and the sled beam are reasonably well overlapped if not right on top of each other (SRC aligned, BS aligned, ITMX aligned, TMSX alinged, ETMY misaligned at this point). The green beam is hitting the HWS. However, the streamed imagees don't show any decent return sled beam. Given that the incoming green light overlaps the outgoing sled beam whatever is causing the return sled beam to be off is likely in vaccum. Greg also noticed the green beam coming down the ITMY periscope changed position significantly compare to last week. So we agreed to not adjust the corner station HWS optics any further until we are sure that the SRC optics won't change the alignment again. The Hartmann waveplate is off at the moment for ITMX.
John, Kyle

Don't want pressure to vary as the result of varying IP12 voltage output -> Wider community using X2 BT pressure as indication of possible leaks being introduced from BT cleaning activities on X2 -> Fixed voltage at 7000V (same voltage as Y-end)
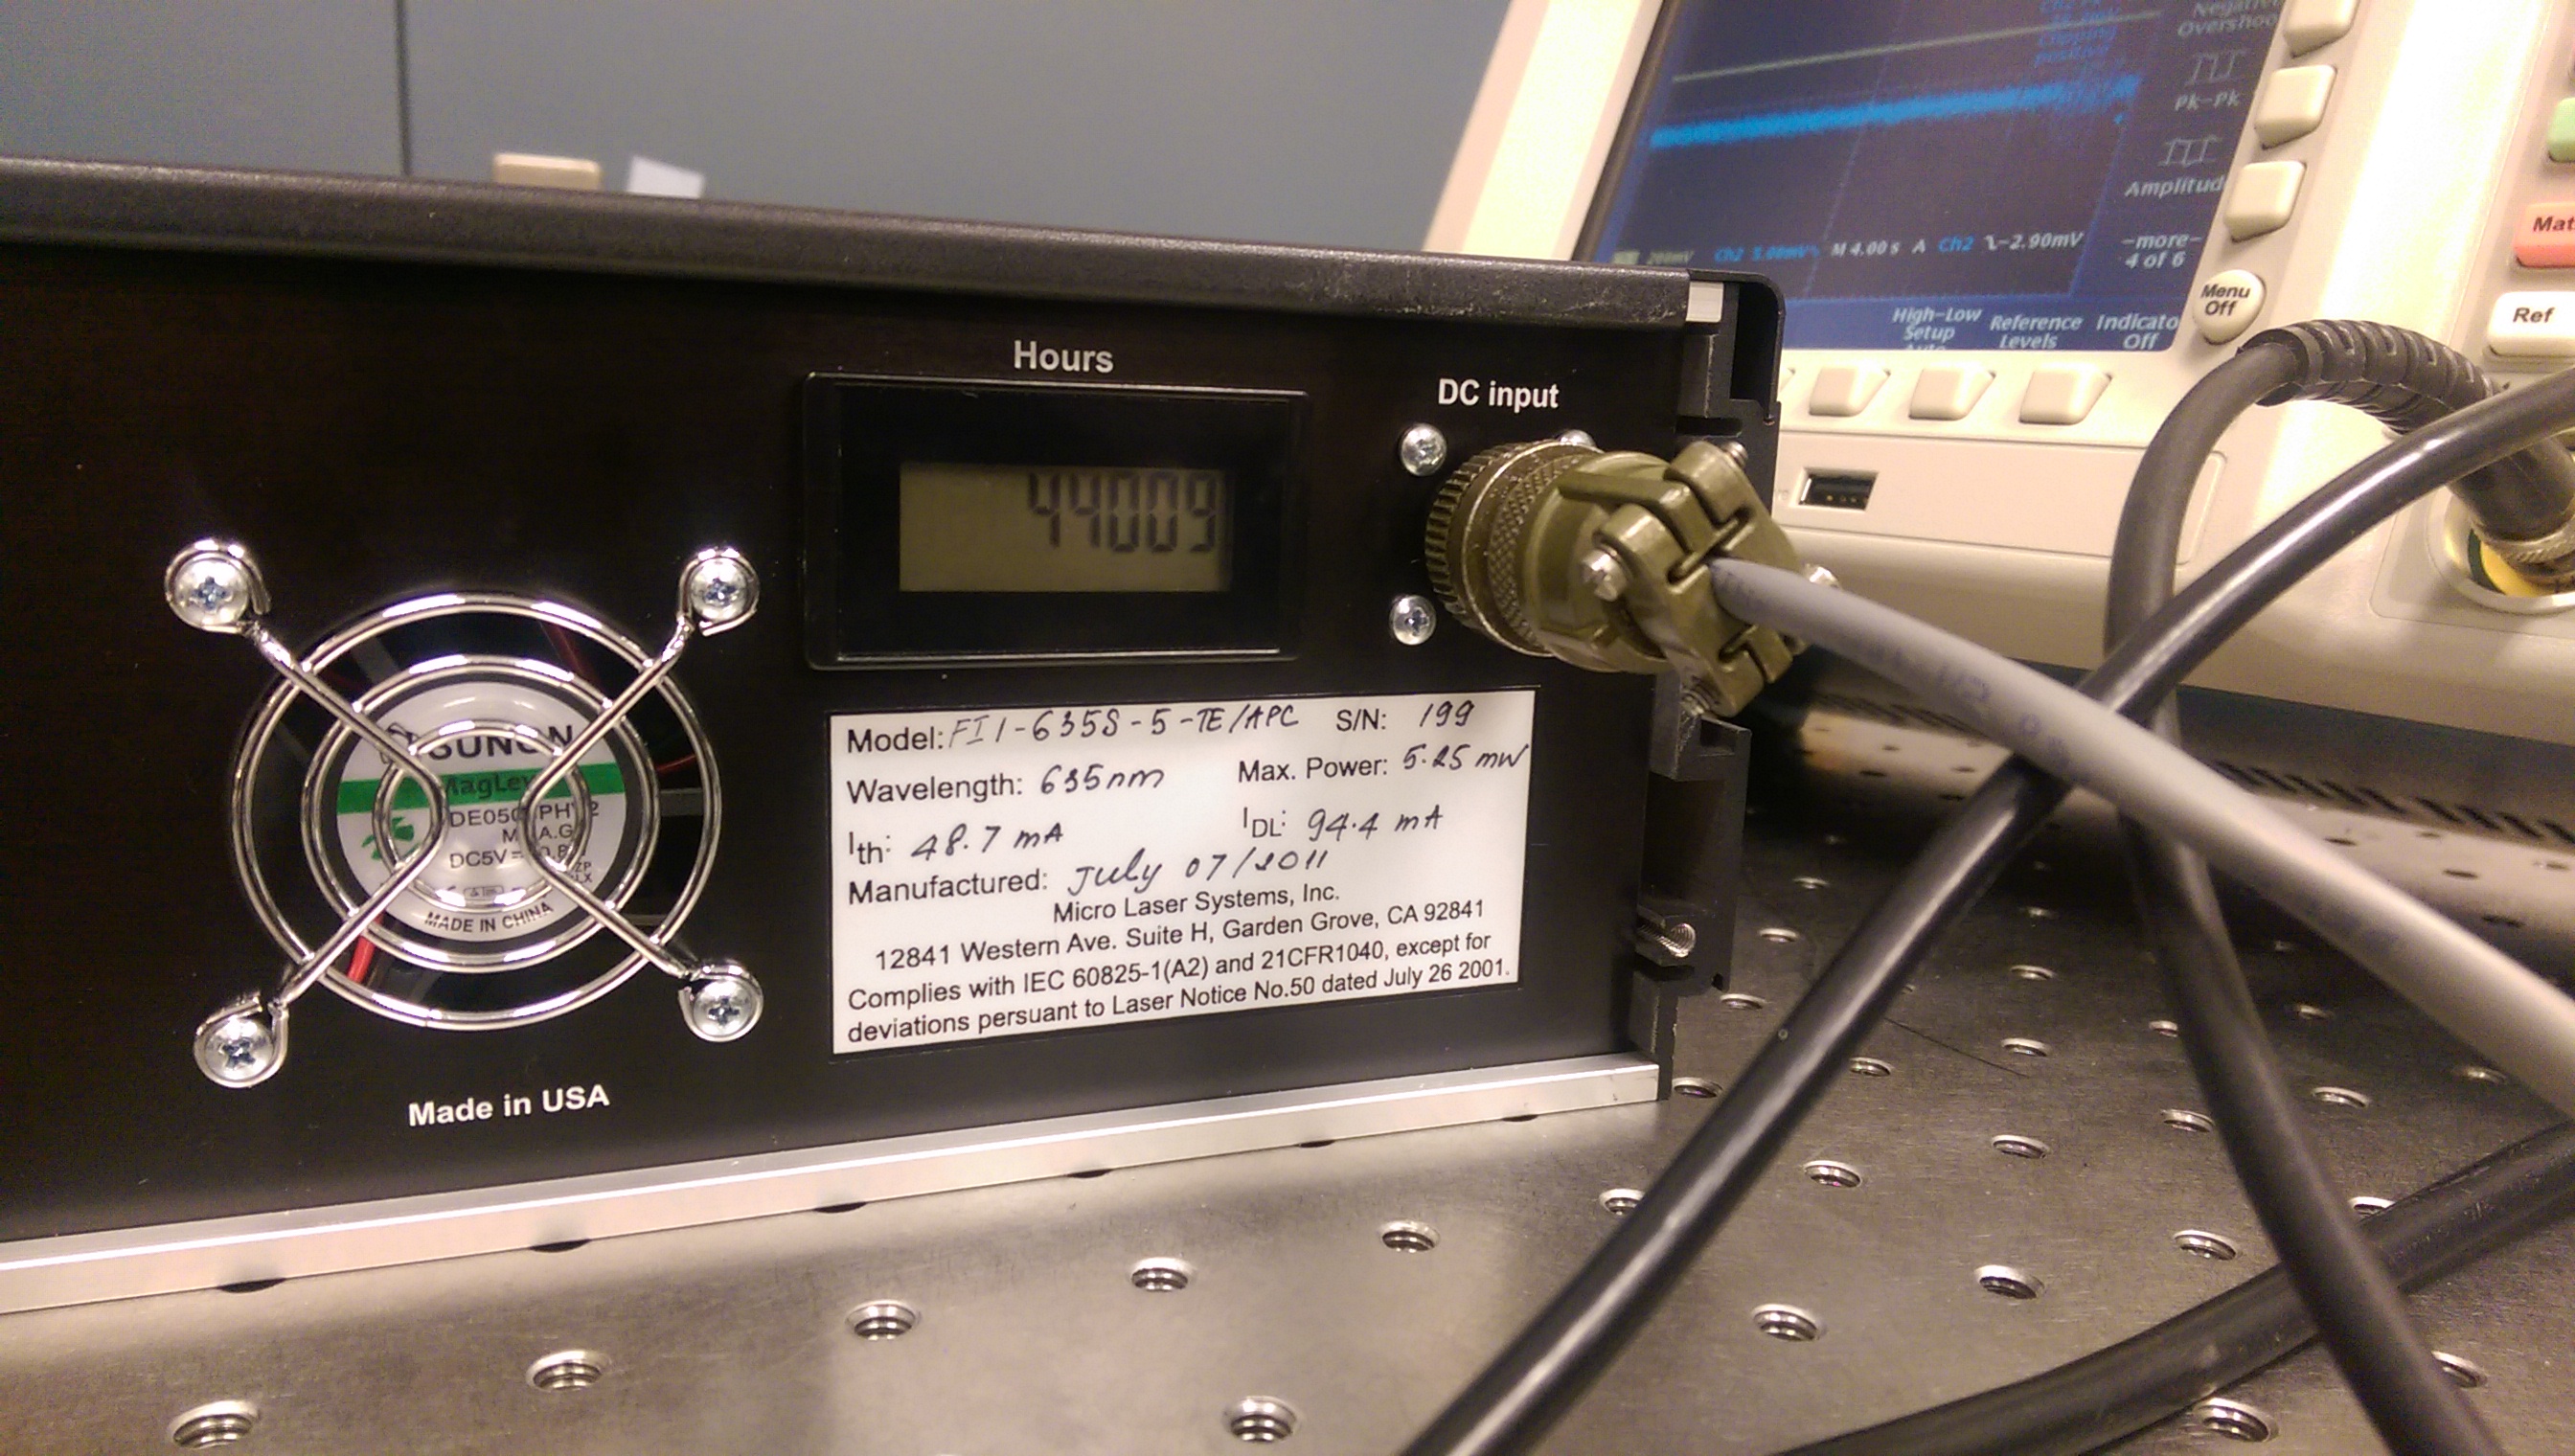
J. Oberling, S. Doravari
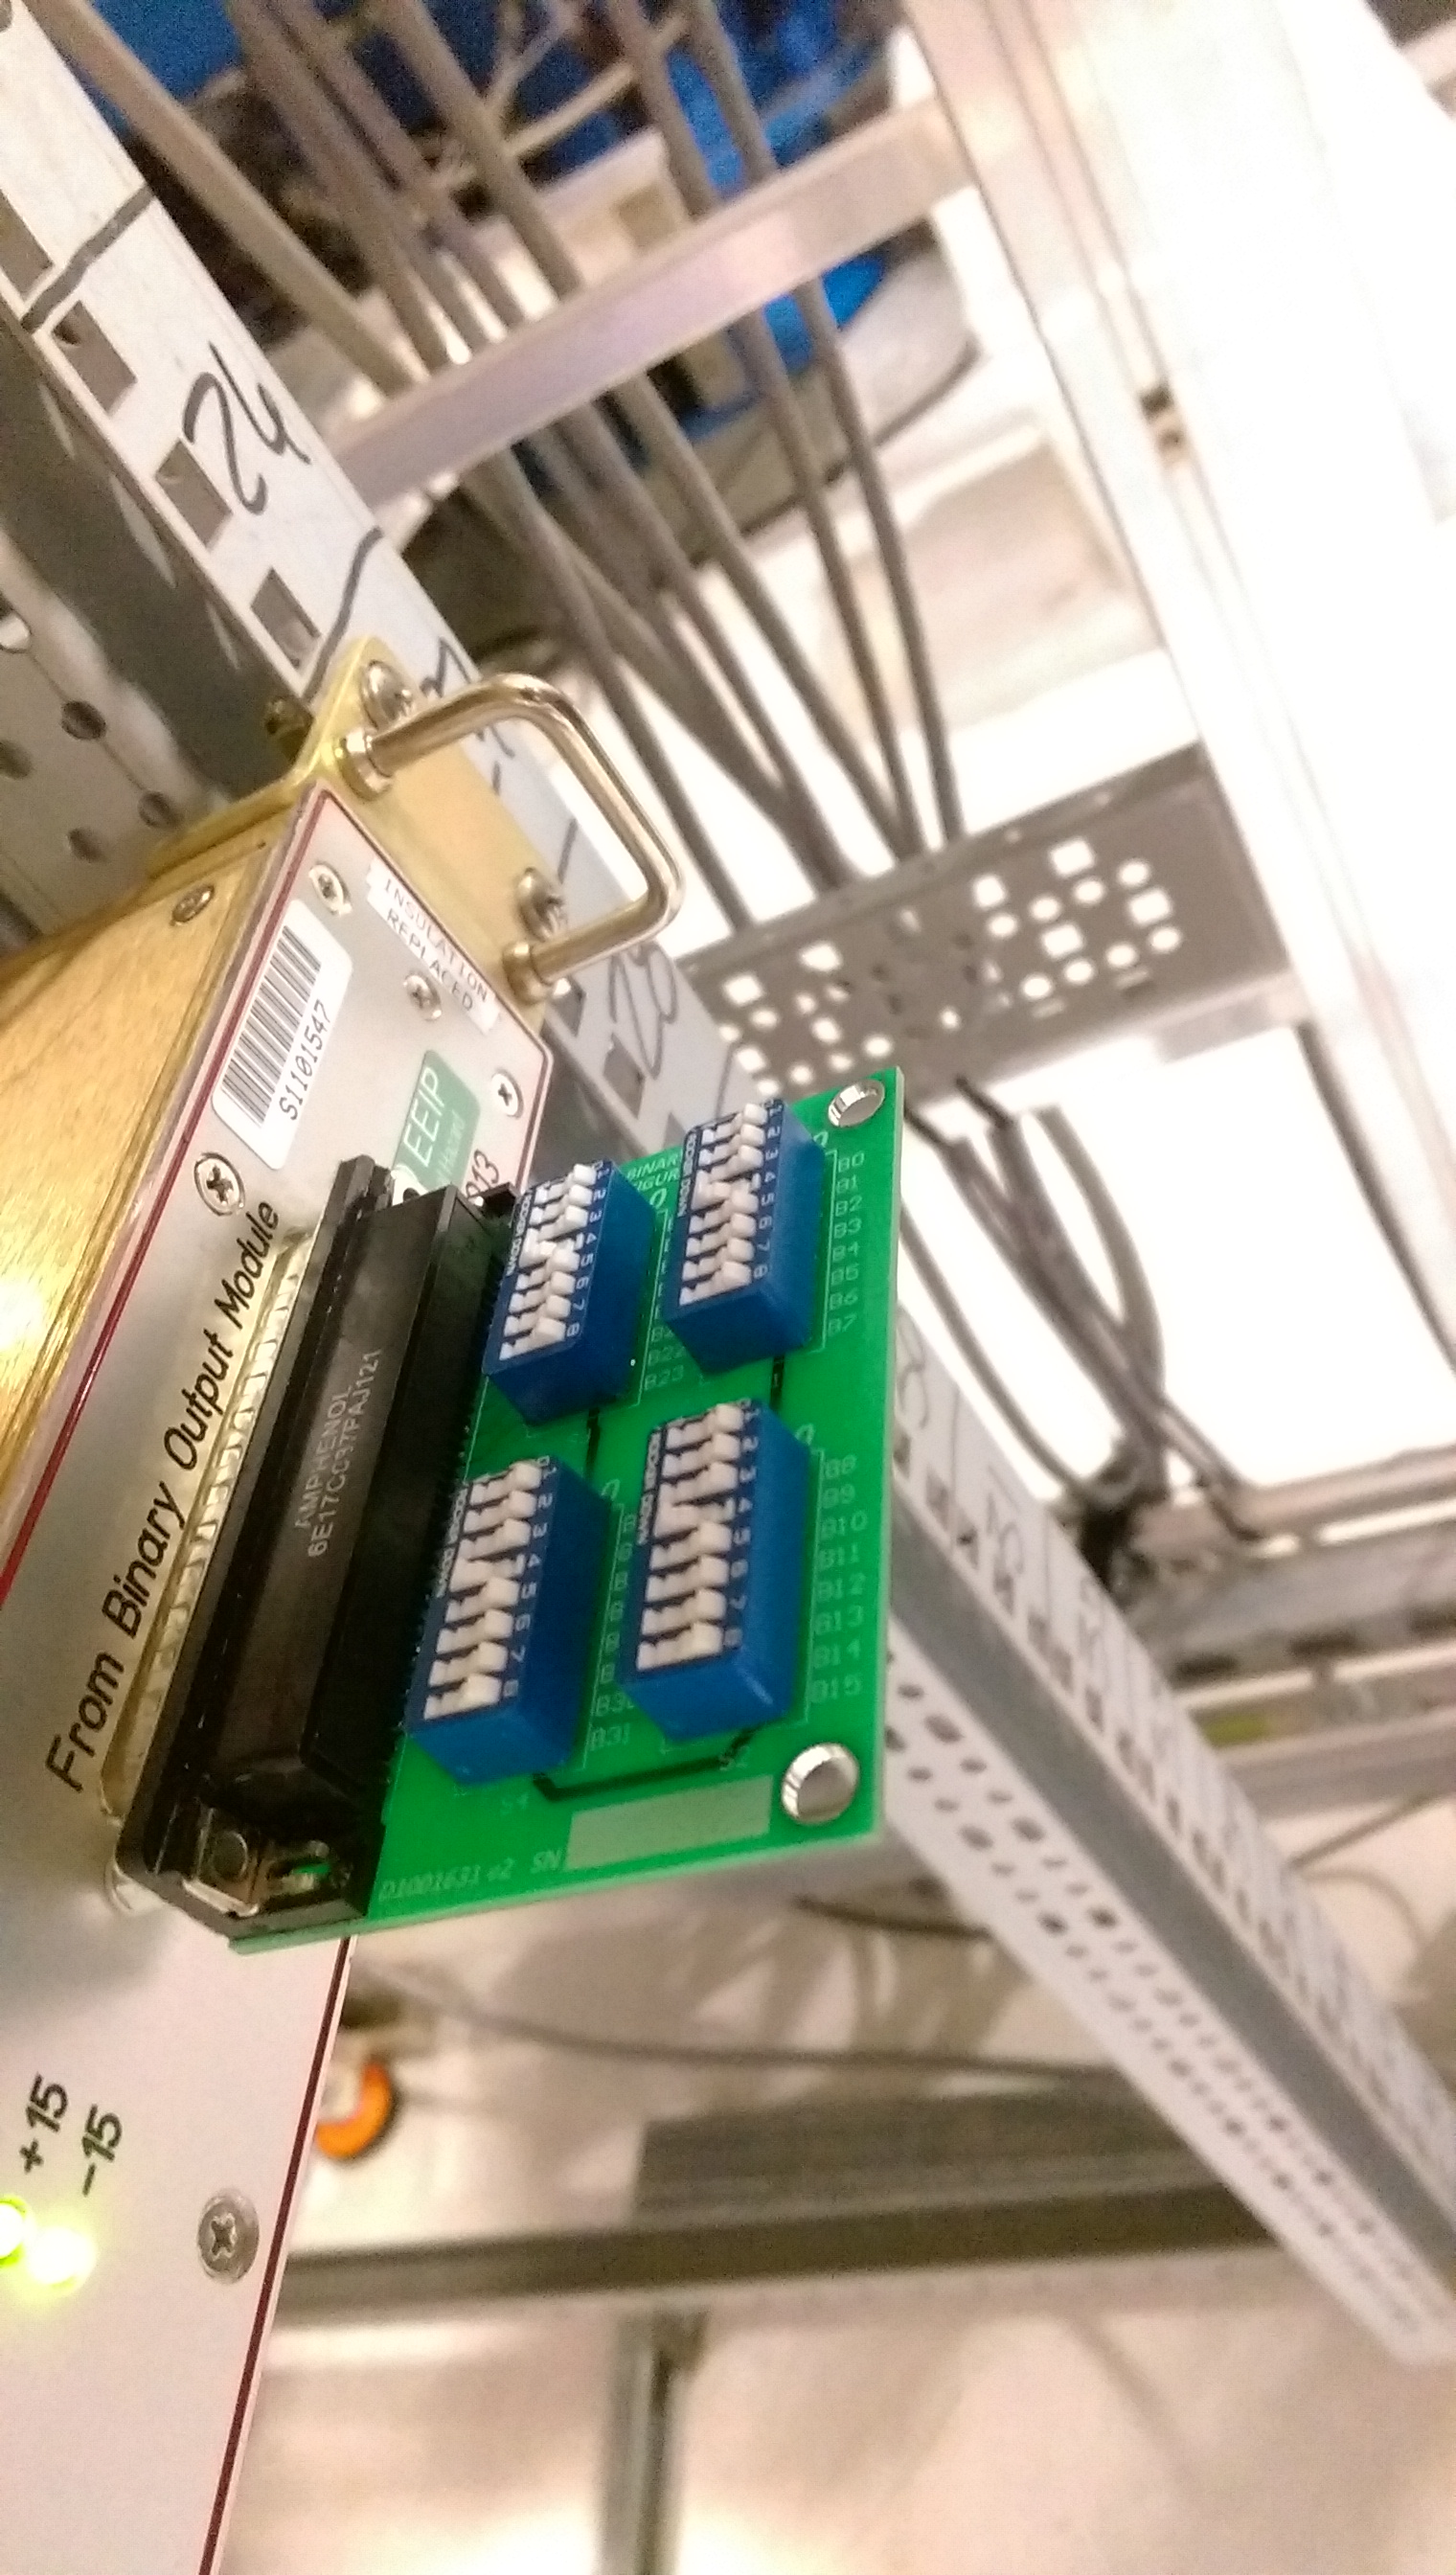
With the HAM6 activity closing out, we took advantage of the window and tweaked another laser and swapped it into SR3. The SN of the new laser is 199. This was installed in the SR3 optical lever so we will have data for a direct comparison between the stabilized diode laser here at LHO and the fiber-coupled HeNe in use as the LLO SR3 optical lever. We will begin monitoring this laser tomorrow after it thermally stabilizes overnight so we can perform, if necessary, final tweaks to the laser power to finally stabilize the laser.
Just attaching images associated with this work.
1) SR3 Oplev laser currently installed is Sl. No. 199
2) The binary switch state for setting gain and whitening. Currently there is just 3dB of gain and no whitening
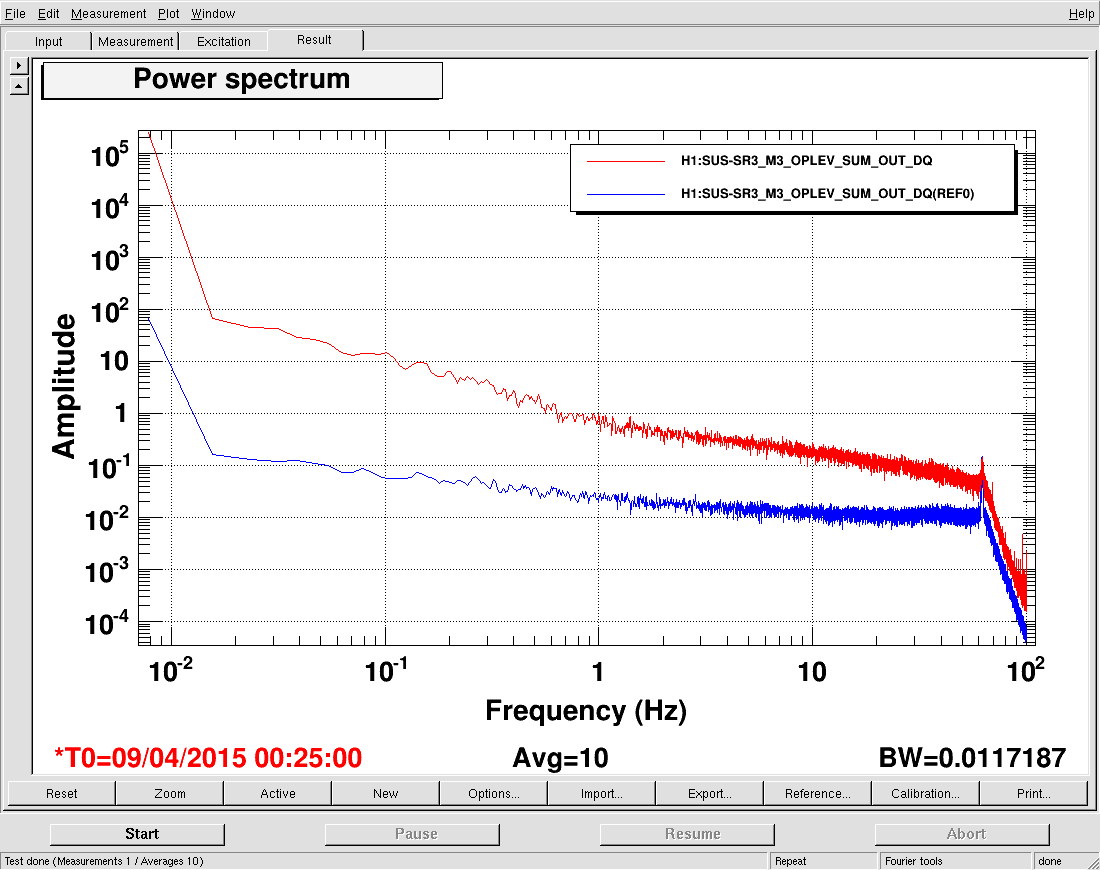
3) power spectra of adc noise floor and sum signal to show that the signal is atleast ten times larger than the noise floor at all frequencies of interest
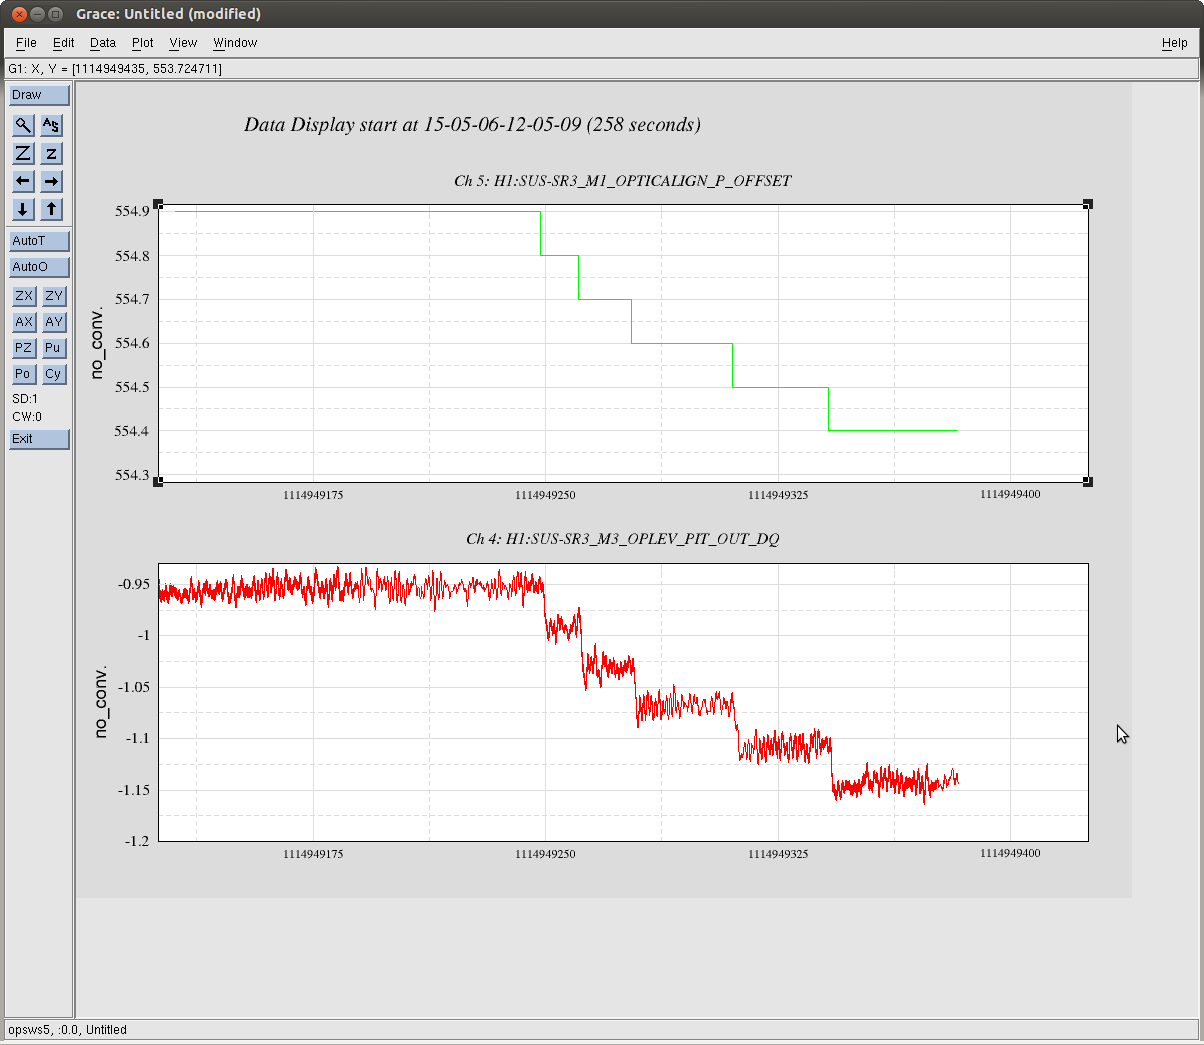
It seems there is a discrepancy between the SR3 pitch slider and the SR3 oplev motion. I move the pitch slider by what I think is 0.5 µrad, and the oplev reports that SR3 moves by 0.2 µrad. Not sure about yaw.