jeffrey.bartlett@LIGO.ORG - posted 10:27, Wednesday 15 April 2015 (17884)
08:30 Meweting Minutes
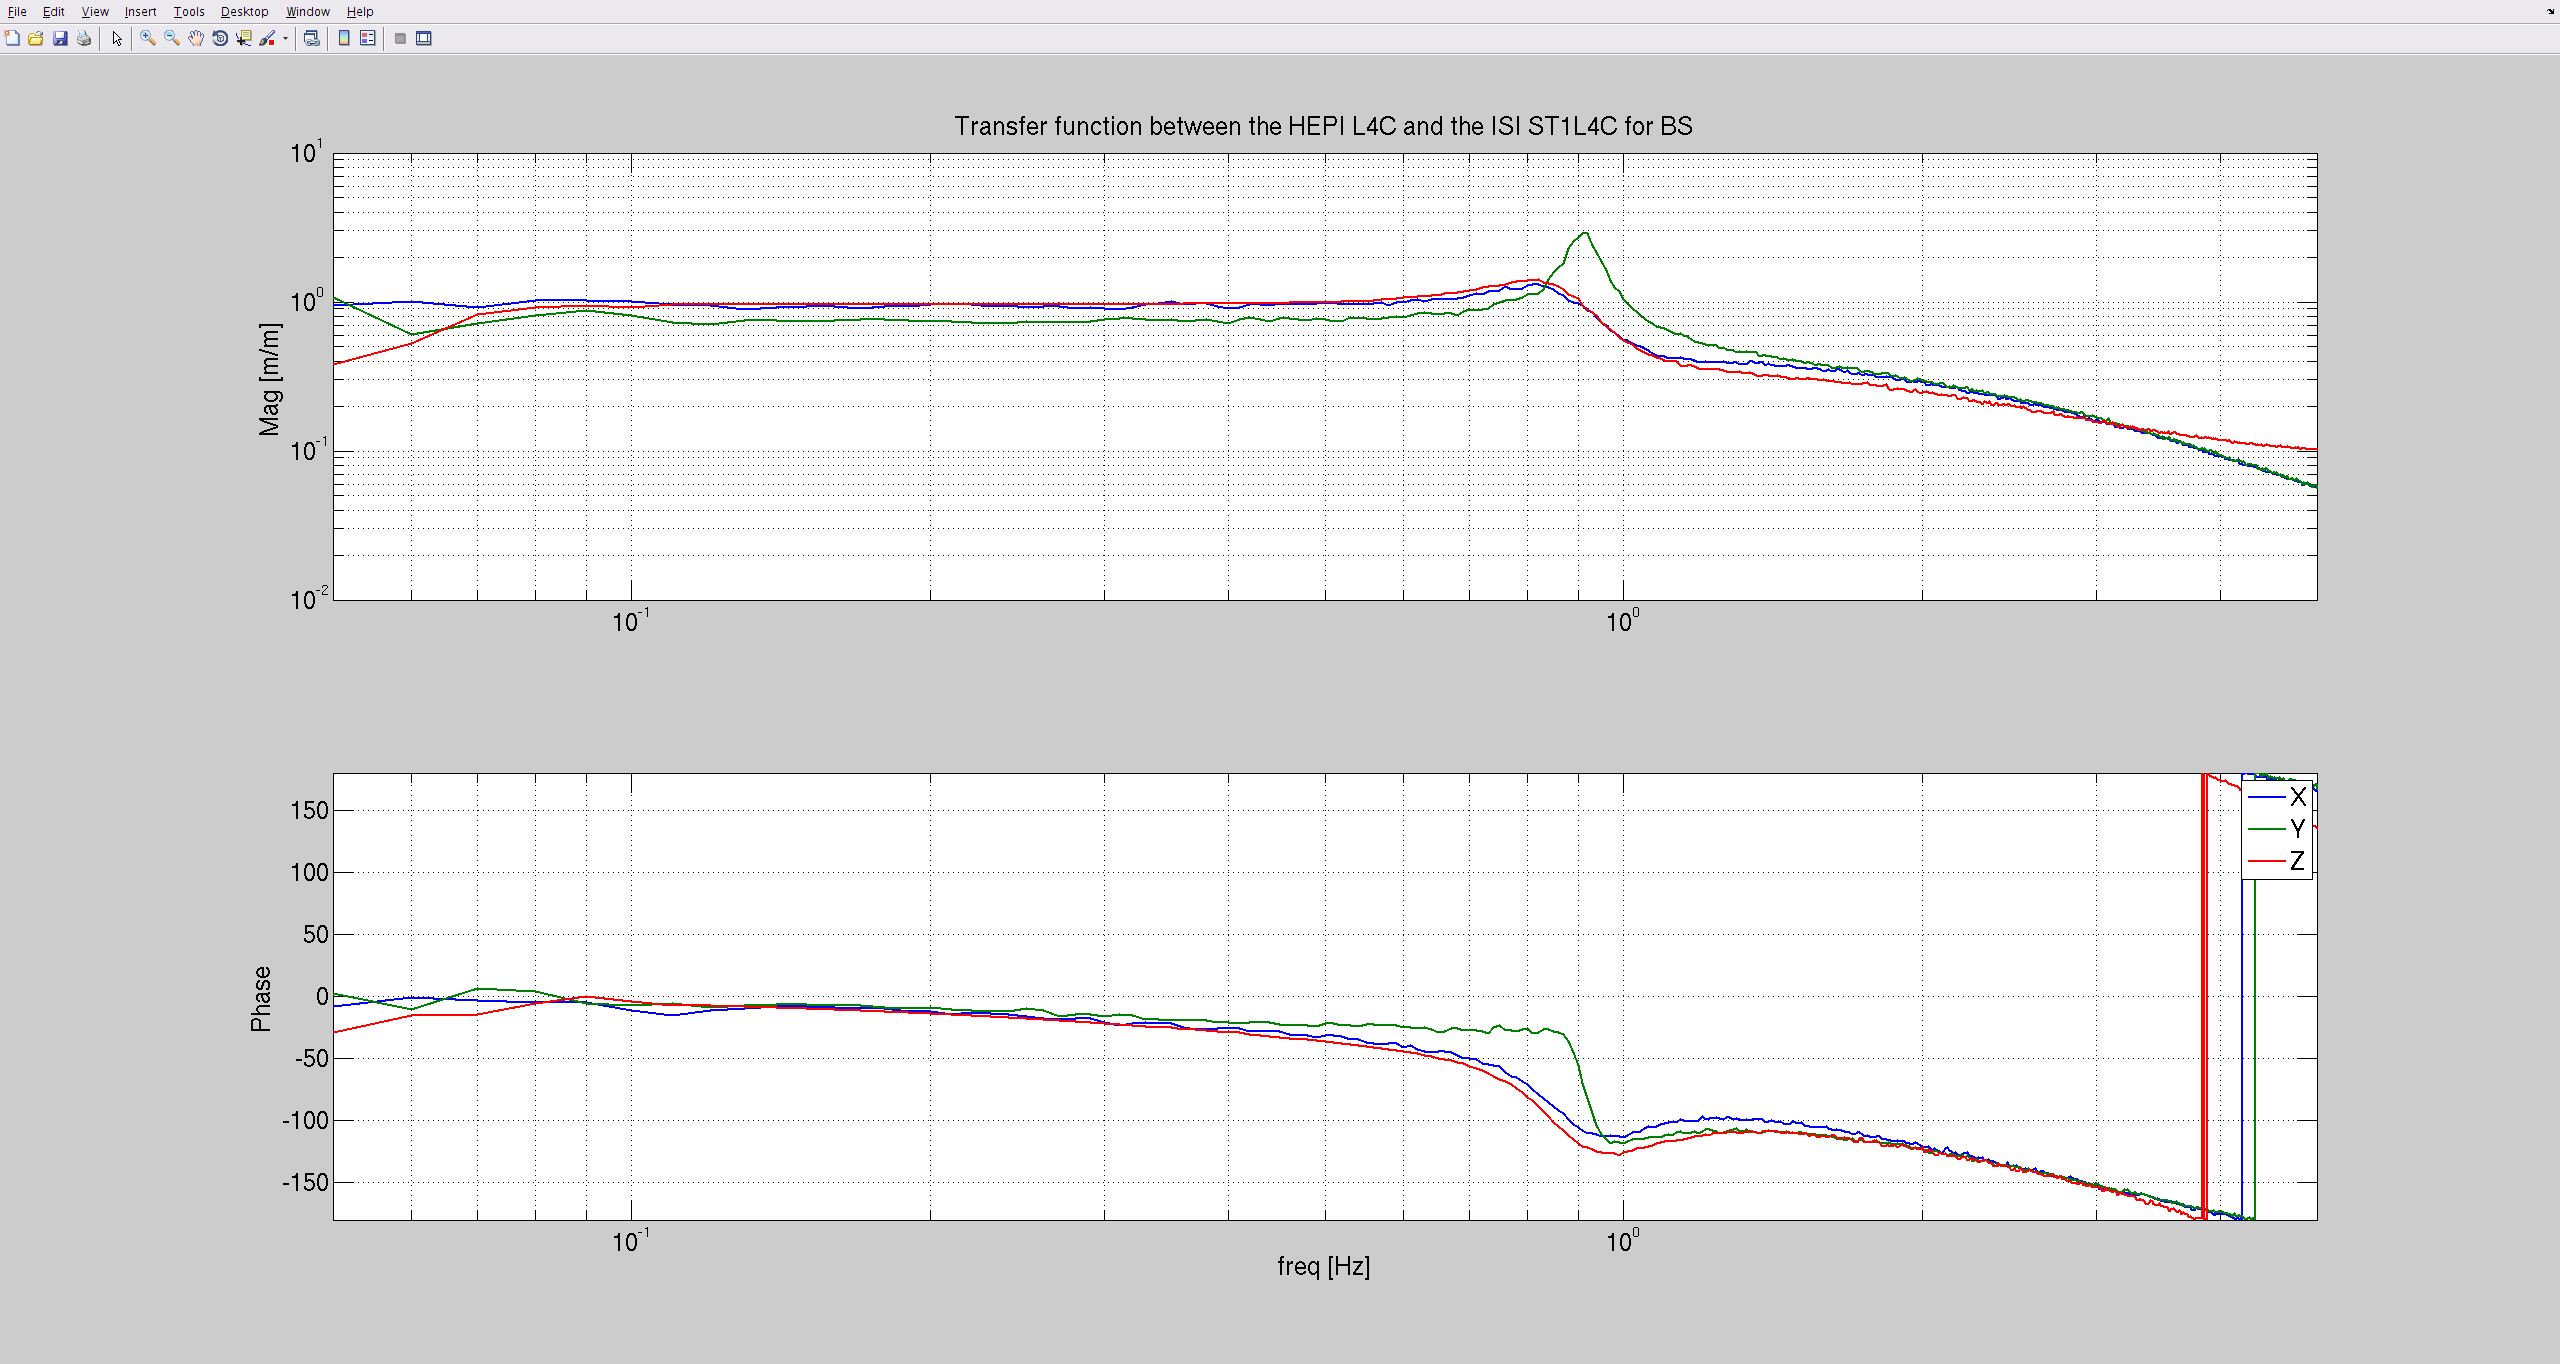
ER-7 is scheduled for mid-June. There will be a short “annealing” run just before the ER-7 run.

Seismic:
	Running TFs on BS and ITMX.

BRS:
	Software crashes about every two weeks. Ops will check the BRS status daily.

CDS:
	Finished connecting the Dew Point sensors for the 3IFO storage containers.

VAC/FMC:
	HAM6 is still pumping. Hope to transition Ion pump today.
	Beam Tube cleaning of the X-Arm is 25% complete.
	There will be a safety meeting at 15:00 in the LSB auditorium.
	There will be painters on site working in the VPW, LSB, and OSB.

PSL:
	Work continues on the FSS.

Comm:
	Tuning and alignment work on the Mode Cleaner and the HWS.