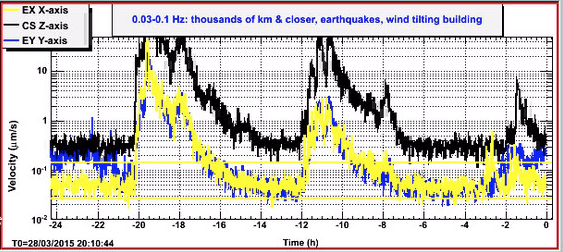
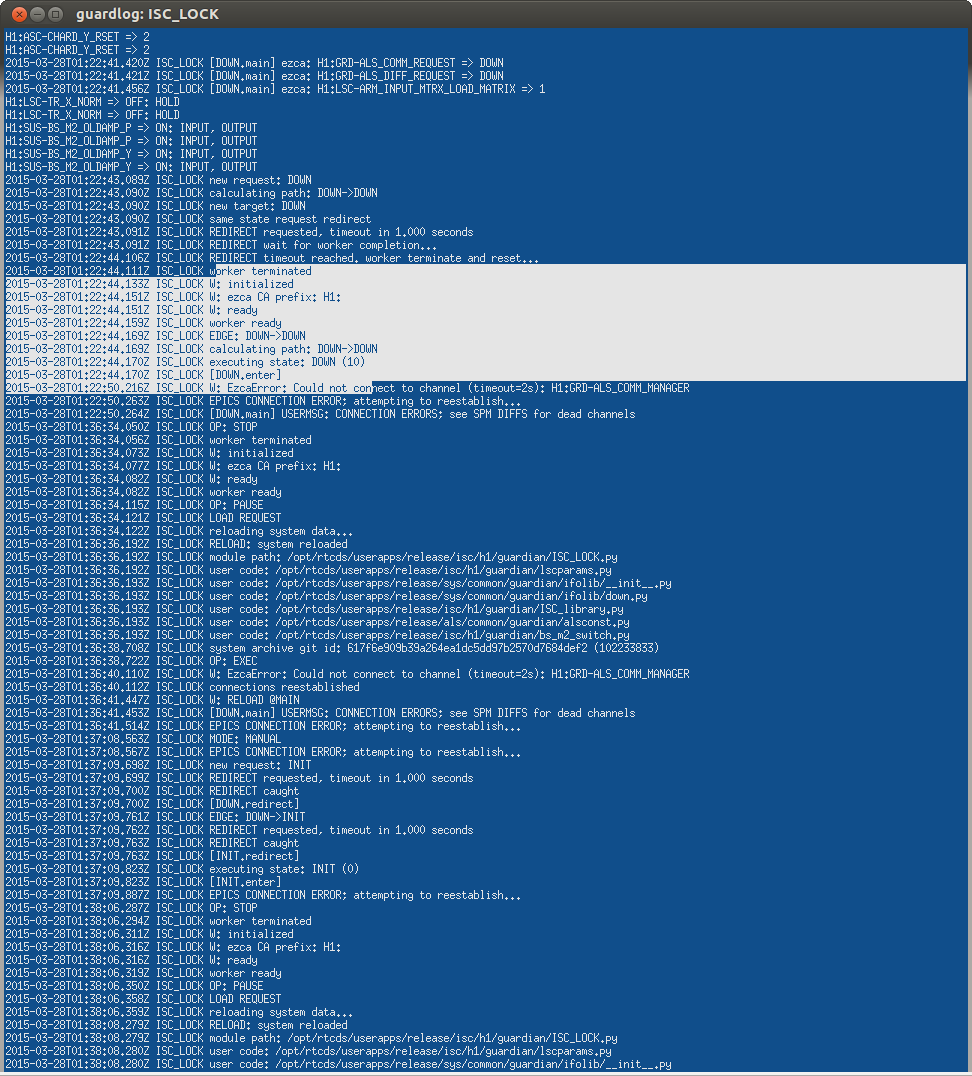
Evan, Sheila, Nic, Lisa To answer Peter's questions , we have relocked the DRMI (without arms) on 1f and 3f (10W input power, 27 mW on the BBPD photo-detector). The DRMI was very stable in both cases, here are the good times: Nov 5, 6:00 - 6:15 UTC DRMI locked on 1f, WFS on Nov 5, 6:30 - 6:45 UTC DRMI locked on 3f, WFS on Evan is about to post plots with error signal spectra. It is probably a good idea to make some plots with ground motion/ISI/optical lever signals to "capture" these good times.
Looking at past data in DQ channels on the ETM suspensions, I tried to estimate the bounce and roll mode frequencies.
I used the top stage V and R degrees of freedom, as well as the oplevs. I used 0.001Hz BW.
I could see the modes in ETMY, but ETMX did not have these modes rung up apparently.
ETMY bounce: 9.730 0.001 Hz
ETMY roll: 13.816 0.001 Hz
Comparison of ion yields with purge air and pure nitrogen are given in the attached pdf file.
Summary:
HAM2 moved by about -10 to -8 urad in YAW (in SUS coordinates) and some unknown angle in PIT. This was apparently triggered by the maintenance work for HEPI. Even though Hugh had to back off all the changes due to some other problem they have found, and made sure that SEI sensors are brought back to the original readings, ISI never went back to its original angle.
This is not the first time HEPI or ISI apparently moved though SEI sensors told otherwise.
Details:
In the attached, all plots start before the maintenance and end right when HAM2 was brought back to the old SEI sensor readings. Also, at the end of the plot, MC WFS was engaged.
In CH3 and CH4, you can see that the HAM2 ISI OPLEV saw some big change both in PIT and YAW. The numbers, especially YAW, cannot be trusted too much as the beam is almost all in the right half of the quad diode and nobody took time to confirm the calibration/sign, you can still assert that the ISI angle is totally different from where it used to be.
According to PR3 oplev (CH1 and 2) the HAM2 ISI oplev data in that ISI moved -10 urad in YAW. The optic moved by +4 urad in PIT but this doesn't mean that the ISI moved by this amount.
Other optics on HAM2 are without oplev and therefore don't have an independent measure of the angle external to ISI, but you can see small changes in the OSEMs.
In addition, after the MC locked and the WFS brought the alignment to wherever it thought was good, all MC mirrors settled to different OSEM readings than the original. This means that MC mirrors are sitting at different angles relative to the ISI.
Anyway, the AS beam was at a totally wrong location and we were worried that our alignment was completely wrong, because there's apparently a centering servo for IM4 transmission acting on PZT mirror, but in the end twisting PR3 back by +8 urad in YAW and -2urad in PIT seemed to take care of most of the bad things.
I confirmed that these shifts in optics on HAM2 are NOT due to the bias slider or IFO ASC.
Just like yesterday, I now have new controllers developed with the really correct local <--> cartesian matrices ready to try. It would be nice if I could give some quantifiable change in the controllers to make the arguement that these will actually work but, I can't without lots more time.
See the first attachment to compare the matrices used by the controller development (in the matlab window) with the matrices actually used currently by the platform. I can't fathom how this all actually holds it together but at the worst it only rings rather than blows up (see the second attachment of the ISO outs.)
Finally--the third attachment is the new controllers I tried this moning. The last attachment are the controllers I want to try tomorrow morning developed with the correct matrices. I predict that these will not blow up nor ring...
Please postpone putting this in until next maintenance.
Attached shows the DC sum of AS_C QPD (normalized by the maximum measured) VS the YAW offset of PR2. I haven't touched PIT.
Green vertical line is where we're at now.
After doing the scan represented by red crosses, I took another set of scan (blue circles) to see how the measurement fluctuates, and it seems like it didn't change much (which is good).
No further analysis yet.
What was done:
Feed back the AS_C QPD signal to ITMX using ASC. Input matrix DHARD-AS_C =1. ASC ouput matrix from DHARD to IX PIT=1, YAW=-1.
Scan PR2 in YAW. Measure 10 sec average of AS_C DC SUM using tdsavg.
08:00 LVEA is LASER HAZARD
08:15 Checked PSL status
08:37 Karen @end-Y - report of water leaking over light fixture in mechanical room and also under roll-up door.
08:45 Alistair and Eric out to LVEA/LASER tables
08:49 Jeff out of LVEA
08:50 Karen leaving end-Y
09:10 Took Seismic, safely, offline so that Jeff could updat SUS models
09:13 reset watchdog accumulators. note: all involved chambers were able to be reset using reset all except for HAM3. rest WD only was the only way to reset.
09:21 request from Jody for LASER safe.
09:25 Keita will transition LVEA to LASER safe
09:43 Dave B doing DAQ restart #1
09:50 Krishna back from installing thermometers for BRS @ end-X. ws there since 7:45.
09:56 Keita reports that due to the fact that the TCS team has their tables open the LVEA will remain LASER HAZARD.
11:34 Kyle going to Y-end to take pictures
11:58 Kyle leaving Y-end
12:02 Alistair and Eric out of LVEA
12:06 Betsy and Travis to align Quad in W Bay for about 2 hours.
13:15 Jim out to CER to reset an STS
13:20 Andres out to W Bay
13:28 Andres out of LVEA
13:30 Alistair et al to the H2 PSL enclosure. Approval was given by commisioners.
13:55 Betsy and Travis out of LVEA
15:08 Eric, Gerardo and Alistair out of the H2 PSL/LVEA
16:00 Gerardo out to LVEA to adjust cameras for commissioners
Jeff & Hugh
I attempted to correct the Local <--> Cartesian matrices and load generic HEPI controllers for the position loops. Long story short, lots of watch dog trips, open loop TFs. Plant must have changed...actually, routine error in the Matlab process of controller development was giving different matrices (not the correct ones) to the controller calculator. So to the calculator the plant was different than what the new matrices were giving the controllers. Hence instability.
I reverted the foton file and burt restored to 0510pst. It isolated first time. But why does it look like the alignment changed? ISI servos back all dofs to the reference location but HEPI only restores the RZ reference location. So how do we get an apparent yaw, based on PR3 alignment etc? Maybe the other dofs that are servo'd but not restored to the reference cross couple into yaw? Maybe...
But, we are servoing in the cartesian basis, what is happening in the local basis? Remember, HEPI has four horizontal actuators and can distort or pringle the platform. So, even though we servo the RZ back to 'zero', what are the four corners of the HEPI platform doing?
Based on the raw IPS counts(see first attachment with 3 days of the horizontal IPS trends) the platform yaws 1.6urads, this is using the correct matrices. What I don't understand is that with just sign errors in the rotational dofs, why isn't this still zero? The system has servo'd the RZ back to its reference of 20905nrads. Are there multiple minima in the local IPS space to satisfy the cartesian servos? When I do the same exercize using the current (incorrect matrices,) I get a yaw of 470nrads. It should be zero but maybe this is within the error of my picking values from the data viewer trends. When Jeff and I do a similar exercise using the changes in the output drives to the Actuators, we get 300nrads. To do this we just looked at E1300828 and used the H1's displacement from 5000cts drive as the calibration. This may not be valid for all actuators and again picking before and after data points from the data viewer trends certainly has slop.
So, even though the cartesian RZ has servo'd back to its place, the individual corners of the HEPI are not in the same place implying disortion. Is this distortion enough to impact the Optics' pointing?
Alexa, Sheila, Keita
We had a look at the ETMY length 2 angle coupling this morning.
L1 Stage:
We started with L1, Alexa first measured the response of the oplevs to a length drive at a single low frqeuency (0.1 Hz, 500000 amp) and high frequency (5.47Hz, 2000 amp). She drove at L1_LOCK_L with the nominal filters engaged. Meanwhile in the drive align matrix the P2P filters were left on, but the L2P filters were turned off. She found that the gains of the existing filters at low and high frequencies seemed OK. Then we had a look at the impulse response, which is the first screen shot attached. For the impulse response we turned off all the LOCK_L filters.
The pink trace is with no L2P at all, while the blue trace is FM8 that we installed (alog 14323), which was clearly not very good. The FM1, FM2 filters are much better, which is something Arnuad had configured in alog 11832. The roll off FM3 was added to reduce DAC saturation. Keita also created a better roll off (FM4), which rolls of closer to 40Hz instead of ~1Hz, and falls off more steeply. For reference the new FM4 filter is ellip("LowPass", 5, 0.2, 40, 30). The difference is sort of minimal, but we will leave that as our new configuration. The gain of this new configuration at 0.01Hz and 4.57Hz is still ok based on Alexa's measurement.
M0 Stage:
We then looked at M0 stage. Alexa drove M0_LOCK_L at 0.01Hz, 50,000 amp with the nominal filters on. The drive align matrix had P2P left on, but the L2P filters turned off. A better gain would be 0.05, the gain for the filters enaged was closer to 0 for this. There was no coherence at high frequency. We then looked at the impulse reponse again, with the LOCK_L filters off. The second attachment shows the results.
Second attachement: The pink trace shows our nominal configuration (FM1, FM2 on for L2P and FM1 on for L2Y with a gain of -1). This was clearly better than with nothing on. We also tried various other configurations and the legacy filters, but these were significantly worse (and not worth plotting).
L3 Stage:
Finally, we took an impulse response of L3 stage. No filters have been comissioned for this stage, and the L 2 angle coupling probably changes with the ESD charge; however, we wanted to confirm there was no crazy impulse. Third attachement: The red trace has no DAC saturations and shows that the impulse response is rather small, which is good.
Conclusion:
M0, L3 drive align matrices are left as they are. We changed L2 L2P filters: FM1, FM2, FM4 ON and FM8 OFF, gain -1. See the fourth attachement for the final configuration.
Sheila and Dave
to clear up the white blocks on the GUARD_OVERVIEW screen and the issues raised by checkGuardianNodesAgainstMedmScreen we did the following:
Started the guardian nodes: IFO_ALIGN, IAS_INPUT, IAS_PRC, IAS_MICH, IAS_SRC, IAS_XARM, IAS_YARM (some scripts needed edits to fix names)
Destroyed the IAS_TEST node
The only outstanding issue from checkGuardianNodesAgainstMedmScreen is the lack of a PSL guardian node (work is ongoing)
Dave, Joe B, Keith T [WP #4929]
End Stations: I built and installed the end stations cal models (PCAL) h1calex and h1caley. The main change is that the PCAL part is now a common library link.
OAF Front End: The core assignments for the h1calcs, h1pemcs, h1tcscs and h1odcmaster were modified to match with the L1 settings:
| model | cpu was | cpu is |
| h1calcs | - | 2 |
| h1oaf | 3 | 3 |
| h1pemcs | 2 | 7 |
| h1tcscs | 4 | 8 |
| h1odcmaster | 5 | 9 |
the recompile of h1tcscs initially failed due to an outstanding merge issue with TCS_MASTER.mdl. I reverted this file back to the last stable version and the rebuild proceeded.
the compile of h1calcs failed due to missing IPC channels from the LSC model. I have abandoned this install for today and will see if I can complete it next Tuesday (11/11) if permission to change LSC is granted. This keeps the WP open.
The calibration team, which proposes to dither DARM with four pairs (suspensions, pcal) of lines per IFO from below 20 Hz up to above 2 kHz, has asked what frequencies to avoid, in order not to interfere with future targeted searches in aLIGO data for known pulsars.
Unfortunately (or fortunately, depending on your perspective), the band to avoid at low frequencies is substantial, depending on how far away from a known pulsar one tries to stay. If one stays at least 1 Hz away from every pulsar for which the spindown limit can be beaten at its spin frequency (* see below) or twice its spin frequency, then here are the bands that are safe in that respect:
Non-vetoed bands for veto half-band = 1.000000 (one or two times pulsar frequency)
33.42- 37.32 Hz ( 3.91 Hz)
42.88- 49.58 Hz ( 6.71 Hz)
51.59- 54.69 Hz ( 3.11 Hz)
57.22- 58.30 Hz ( 1.09 Hz)
60.31- 60.93 Hz ( 0.63 Hz)
62.94- 63.12 Hz ( 0.19 Hz)
65.13- 81.32 Hz ( 16.20 Hz)
83.33- 87.10 Hz ( 3.78 Hz)
89.11- 122.87 Hz ( 33.77 Hz)
124.88- 159.80 Hz ( 34.93 Hz)
161.81- 172.68 Hz ( 10.88 Hz)
174.69- 201.79 Hz ( 27.11 Hz)
203.80- 320.61 Hz ( 116.82 Hz)
322.62- 346.37 Hz ( 23.76 Hz)
348.38-2000.00 Hz (1651.63 Hz)
In other words, there is no safe frequency below 33.42 Hz. The above bands are defined by vetoing 0.01-Hz bands within 1 Hz of a pulsar with a spindown limit (based on energy conservation) that is higher than the sensitivity obtainable with a 1-year coherent integration of full-aLIGO-sensitivity H1 and L1 IFOs (using the zero-detuned high-power strain noise curve).
Traditionally, targeted searches have looked at only twice the known spin frequency of the star under the assumption that the gravitational waves come from a quadrupole deformation (non-zero ellipticity). In at least one alternative scenario, however, one could detect GWs at the spin frequency itself, and future targeted searches will consider both 1*F and 2*F. How to define the spindown limit for a 1*F emission is not as straightforward, though, as for 2*F emission. In deriving the safe bands above, I have simply taken the spindown limit to be the same as for 2*F. From one perspective, that assumption is absurdly optimistic because we expect the 1*F emission to be weaker than 2*F, but from the perspective of attributing the entire spindown of the star to 1*F emission, the 1*F spindown spidwn limit should be even higher than the 2*F limit.
Given my uneasiness about how seriously to take the 1*F spindown limits, here are the corresponding safe bands when only 2*F emission is considered:
Non-vetoed bands for veto half-band = 1.000000 (two times pulsar frequency)
33.42- 37.32 Hz ( 3.91 Hz)
42.88- 49.58 Hz ( 6.71 Hz)
51.59- 54.69 Hz ( 3.11 Hz)
57.22- 58.30 Hz ( 1.09 Hz)
60.31- 63.12 Hz ( 2.82 Hz)
65.13- 81.32 Hz ( 16.20 Hz)
83.33- 87.10 Hz ( 3.78 Hz)
89.11- 122.87 Hz ( 33.77 Hz)
124.88- 320.61 Hz ( 195.74 Hz)
322.62- 346.37 Hz ( 23.76 Hz)
348.38-2000.00 Hz (1651.63 Hz)
Attached are plain text files and plots corresponding to veto-half-bands of 0.01 Hz, 0.10 Hz, 0.50 Hz and 1.00 Hz, along with the Matlab script used to produce them. The spindown limits were computed using parameters taken from the Australia Telescope National Facility (ATNF) pulsar catalog, using all pulsars with a rotation frequency of at least 5 Hz and with measured frequencies (Hz), non-zero measured frequency derivatives (Hz/s), distances (kpc) and epochs (MJD). See the Matlab script for details. The pulsar frequencies used here take into account the spindown and epoch of its measurement and apply to July 1, 2015.
The default veto half-band of 1 Hz used above may be too conservative, but the worry is that upconversion from a strong dither may pollute the frequency where the pulsar sits. The iLIGO Crab pulsar upper limits were appreciably degraded by their nearness to 60 Hz (several tenths of a Hz away) and motors, etc. running just below 60 Hz. Fortunately the Crab has spun down a little further from 60 Hz since the end of aLIGO, with an expected 2*F of 59.3 Hz next July (not including Doppler modulations of +/-6 mHz and a 2nd-order spindown correction of +30 mHz).
These veto bands have been derived on the assumption that dither frequencies chosen now will be used throughout the first several observing runs. If, on the other hand, the low dither frequencies were to be used only temporarily, one could rerun the Matlab script with a different assumed noise curve and perhaps a shorter assumed observation time, e.g., 3 months for O1, and find other safe bands.
Attachments:
* Four sets of plots showing pulsar veto bands of 0.01, 0.10, 0.50 and 1.0 Hz half-widths, where magenta bands mark pulsars with an accessible 1*F spindown limit, green bands mark pulsars with an accessible 2*F spindown limit, and black bands mark pulsars where a 1*F or 2*F spindown limit is not accessible. The blue curve shows the 1-year 2-IFO sensitivity for the zero-detuned, high-power configuration.
* Four text files with details on spindown-accessible pulsars and the resulting non-vetoed safe bands
* pulsar_gaps.m - script to generate plots and text files
* contiguous.m - utility script downloaded from Mathworks
* Text file with ATNF catalog output read in by the Matlab script
A kindly reminder to please use the reservation system to provide an overview of which systems are being worked on.
There are three commands (please use the -h option to get online help):
make_reservation.py To make a reservation
modify_reservation.py To change the time of an existing reservation or delete it
display_reservation.py To turn your terminal into a updating display of existing reservations (no arguments accepted)
added 156 channels removed 36 channels
Alexa, Evan, Sheila, Jeff, Nic, Lisa The plan for tonight was to try again the CARM offset reduction with the DRMI locked on 3f as it was done a few nights ago . However, sadly, we couldn't really stably lock the arms on green by engaging ALS DIFF (feed-back to the ETMs). Nothing was (at least intentionally) changed with respect to the "nominal" configuration which has worked in the past. In the process of collecting and analyzing several lock losses, we identified the following list of problems/action items: * L2P for ETMY is significantly worse than for ETMX, we should fix this: as soon as the differential feed-back to the ETMs is engaged, the ETMY green light fluctuates consistently with PIT fluctuations as seen by the optical lever. This effect was really bad in the afternoon (30% power fluctuations; it got somehow better later in the evening); * ringing up of the 13 Hz ETMY roll mode (again, see Kiwamu's entry): Nic tried to damp this mode by using optical lever PIT as error signal and pushing on L2 PIT, but that didn't work. We will try tomorrow to use the LLO strategy by using ALS DIFF; * at least once we lose lock because of a 3Hz oscillation in the ESD drive (we should remeasure the cross over L1/L3). While trying to debug the ALS, we did some work on the DRMI to investigate the tricky demod phase business (see Evan's entry).
We had tried feeding back only to ETMX ESD, to remove the large 13 Hz peak in the ALS DIFF spectra. We had done this in the past, but we could not get it to work. At one point, I also tried adjusting the L3 LOCK L gain in case the ESD charge had changed the crossover. However, not surprisingly this did not make a difference since the ALS DIFF spectra did not show any gain peaking at the crossover frequency.
These are some plots which show the problem described in this entry (13 Hz roll mode oscillation and 3 Hz loop oscillation in bad alignment state, L2P filters worse for ETMY than ETMY). It might be worth checking if the ground / ISI motion was somehow higher than usual last nigh for the arm cavity optics. P.S.: In the process of doing some lock loss analysis, I realized that our new awesome lock loss tool didn't like empty lines in the channel configuration file. I think this explains while Sheila et al have been observing unexplained script failures when trying to add more channels (by the way, the max number of channel per file is 20). Nic fixed this problem in this way, now it works well. def load_channel_list(path): channels = [] with sys.stdin if path == '-' else open(path, 'r') as f: for line in f: # skip empty lines if line.isspace(): continue channels.append(line.strip()) return channels
The difficulties with H1 DRMI locking, and with getting H1 to full lock, prompt me to survey the top level configuration differences between H1 and L1.
Some other comparisons that should be made (not in the table) are:
At this point we don't know which of these differences, if any, are significant for the lock acquision. Please post comments to this entry if you have some ideas on this, or if there are other known differences that we should be looking at.
| parameter | L1 | H1 | comments |
|---|---|---|---|
| input power for locking | 2 W | 10 W |
|
| modulation depths, 9/45 MHz | 0.25/0.29 | 0.19/0.28 |
not sure if L1 values are current |
| ETM global feedback | hierarchical | distributed |
|
| SUS local damping | A | B |
They're different; see G1401267; Jeff K and Stuart A are working on comparison plots |
| DRMI ASC servos | 4 loops | 3 loops |
BW probably lower on H1; more complete comparison needed |
| HSTS feedback & coil drivers | increased M2 drive for PRM & SRM | increased M2 & M3 drive for all HSTS | |
| LSC servo loops |
comparison needs to be made |
||
| 3-f PD photocurrent (DRMI) | 0.15 ma | 27 mW -> 3 ma |
H1 has done limited trials with a reduced photocurrent |
| WFS centering loops |
different, but comparison needed |
||
| ALS ETM feedback | ? | Done when needed to bring frequency in range | |
| Michelson contrast defect: modeled, no arms, no TCS | 6400 ppm | 10,800 ppm |
SIS model, using as-built ITMs |
| Modeled power recycling gain: carrier, no arms, no TCS | 40 | 33 |
SIS model, using as-built ITMs |
RF spectra from the 3-f BBPD have been posted to both LHO and LLO logs recently, so here is a comparison of those.
LLO data: log 15430 , photocurrent: 0.21 ma
LHO data: log 14807 , 27 mW -> inferred photocurrent: 3.0 ma (better would be a direct measurement of photocurrent)
Comparison of 6 highest RF peaks:
| Frequency | L1 | H1 | Delta |
|---|---|---|---|
| 9 MHz | -41 dBm | -11 dBm | +30 |
| 18 MHz | -29 dBm | -12 dBm | +17 |
| 36 MHz | -18 dBm | -1 dBm | +17 |
| 45 MHz | -30 dBm | -12 dBm | +18 |
| 54MHz | -25 dBm | -6 dBm | +19 |
| 90 MHz | -33 dBm | -14 dBm | +19 |
Other than 9 MHz, the BBPD output RF components on H1 are all about 20 dB higher than the corresponding components for L1. This is about what is expected from the higher photocurrent used on H1 -- in fact we'd expect closer to 24 dB, if the inferred H1 photocurrent is right. The 9 MHz on H1 is another 10 dB higher (on top of the 20 dB), which is odd considering that the f1 modulation depth on H1 is smaller. This may indicate that on 3-f locking, there is more of an offset on PRCL (or MICH?) in H1 than L1, or maybe more residual motion.
In any case, L1 can hold a stable DRMI lock with the lower 3-f signal level, but H1 has not been able to so far. The LLO log entry also included demod error signal spectra for the DRMI. I'm hoping someone at LHO can post a comparison of that with the H1 situation.
Rana, Alexa, Sheila, Peter, Evan
Given last night's strange behavior from REFLAIR_B, we wanted to check the RF powers coming out the BBPD and going into the ISC rack.
With DRMI locked (on 1f, and then on 3f), we used the HP4395A to take an RF spectrum of the "direct" output of the REFLAIR_B diplexer board. This should be the raw RF signal out of REFLAIR_B, with 12 dB of attenuation from a coupler inside the diplexer.
The spectra (adjusted for the 12 dB coupler) are attached.
For 27 MHz, the power into the diplexer is -41 dBm. Using the diplexer schematic (D1300989), this should give -23 dBm at the diplexer's 3x output, which is well below the compression point of the amplifier (ZHL-500HLN+; 1 dB comprsesion occurs at +16 dBm). Similarly, for the 15x output we expect -13 dBm.
The analogous LLO measurement is at LLO#10494.
Power levels were as follows:
Dan remeasured the modulation indices (LHO#14801).
A quick estimate of the amount of distirtion in the BBPD amplifiers (MAR-6SM+ and GALI-6+):
The total amount of RF power in the attached spectrum is about +1 dBm (coming mostly from 4f1). Before the GALI-6+ in the BBPD, that's −11.2 dBm at the output of the MAR-6SM+.
The output-referred IP3 of the MAR-6SM+ is +18.1 dBm. Assuming the third-order distortion of the amplifier grows like the cube of the input power, this means the expected power of the third-order distortion is −11.2 dBm − 2×(18.1 dBm + 11.2 dBm) = −70 dBm out of MAR-6SM+. Then after the GALI-6+, the distorted power is −58 dBm.
[Koji, Rana]
The preamp chain of the BBPD was electrically tested. It turned out that intermodulation can explain the observed RF signals at 27MHz and 135MHz.
Method:
A spare BBPD at the 40m was used for this test.
The photodiode was removed from the BBPD circuitry and an SMA connector was soldered instead. (Attachment 1)
The measurement setup is depicted in Attachment 2.
The RF signals from two signal sources were combined with a power combiner and fed to the modified BBPD.
The output was connected to a network analyzer in order to monitor the output levels at each frequency.
Measurement 1:
Firstly, Intermodulation produced from strong 9MHz and 35MHz components was tested.
WIth these two signals injected, our taget signals appear at 26MHz and 44MHz.
This way we can avoid the interference by the third harmonic distortion of the 9MHz signal.
The result is shown in Attachment 3. The 9MHz and 35MHz input levels were adjusted such that the output levels are -10dBm and 0dBm respectively.
These levels were obtained from the measurement in alog14807 (above).
It is clearly seen that symetric intermodulation appeared at 26MHz and 44MHz. The intermodulation level is linear to the level of the 35MHz signal.
In fact, -10dBm@9MHz and 0dBm@35MHz explain -40dBm@26MHz which Evan observed in the inlock spectra.
Measurement 2:
In the second measurement, it is tested if the intermodulation can produced enough amount of 135MHz signal.
Evan's measurement shows that both 45MHz and 90MHz have -15dBm.
From the lmitation of my setup, I had to use 30MHz and 80MHz to produce 110MHz, instead.
This indeed produced the 60dBm intermodulation, which is consistent with Evan's measurment.
Meaning of this measurement:
What happens if the intermodulation overwhelms the intrinsic signals at 27MHz and 135MHz?
- The intermodulation without fluctuation itself imposes unreasonable offsets in the 3f signals at DC.
- Power fluctuation of the sideband power in the 36MHz (f1-f2) or 91MHz (2xf2) causes unnecessary (=meaningless) signal to the 3f demodulated signals.
- The londitudinal IFO error signals in the 9MHz or 45MHz signals are imprinted to the 3f signals at a certain unknown demod phases,
and thus screw up the demod phase of 3f signals, as well as the immunity of them against the carrier audio sidebands.
Remedy:
- Lower the light power on the PD, if possible to maintain lock.
- Notch out/filter out unncesessary RF components before the BBPD preamps by adding components on the BBPD boards.
- Use resonant type photodetectors in stead of the broadband one to selectively amplify the desired lines.
These are the corresponding RFPD spectra. The analogous LLO measurement is LLO#15430. LLO's measurement of RF135 seems pretty surprising, since the 3f demodulated spectra appear to be almost entirely noise-dominated above 20 Hz.
What's this 2449.25Hz line that grows over time?
In the attached left, the error signal for PRCL and SRCL grew larger and larger toward the end of the lock.
In the attached right, red, blue and green correspond to the end, middle and the beginning of the lock. The difference in noise floor might be that they were switching from 1f and 3f or vice versa.
Regardless, a line at 2449.25Hz grew larger over time and it was dominating the error signal RMS.
Is this something intentional? Oscillation somewhere? Rogue line?
I am not sure what the 2449.25 Hz line is; there is not a line there that I know of...
In terms of the difference in the noise floor, I can confirm that this comes from the 1f to 3f transition. Keita's green trace was taken from 5:50 PM UTC, blue trace from just after 6:20 PM UTC, and red trace was taken at 6:50 PM UTC. I have attached a dataviewer snap shot showing the LSC PD input matrix of the MICH (2_23), PRCL (3_20), SRCL (4_22) 3f signals around that time. The MICH and PRCL signal transistion at around 6:17 PM UTC, which explains why the blue and red traces in those plots go up. Meanwhile, SRCL transitions a bit later at 6:26 PM UTC, which explains why only the red trace goes up in the noise floor.
According to Dennis the lowest elastic mode of the beamsplitter is expected to be at 2458 Hz (right circular cylindrical without wedge angle, bevels, wire standoff-prisms).