Dan, Evan, Kiwamu, Lisa, Sheila (and earlier advice from Keita)
Today we turned on the DARM boost filter described here, to increase the suppression in the 1-6Hz band. The boost itself was no problem, but we realized that changing the phase of the open-loop gain around 10Hz changes the sign of the ETMY and ITMX bounce modes in the DARM error signal, which means the sign of the damping loops need to change as well. This led to a few hours of bounce mode excitement, but the new signs and phases are now in the Guardian.
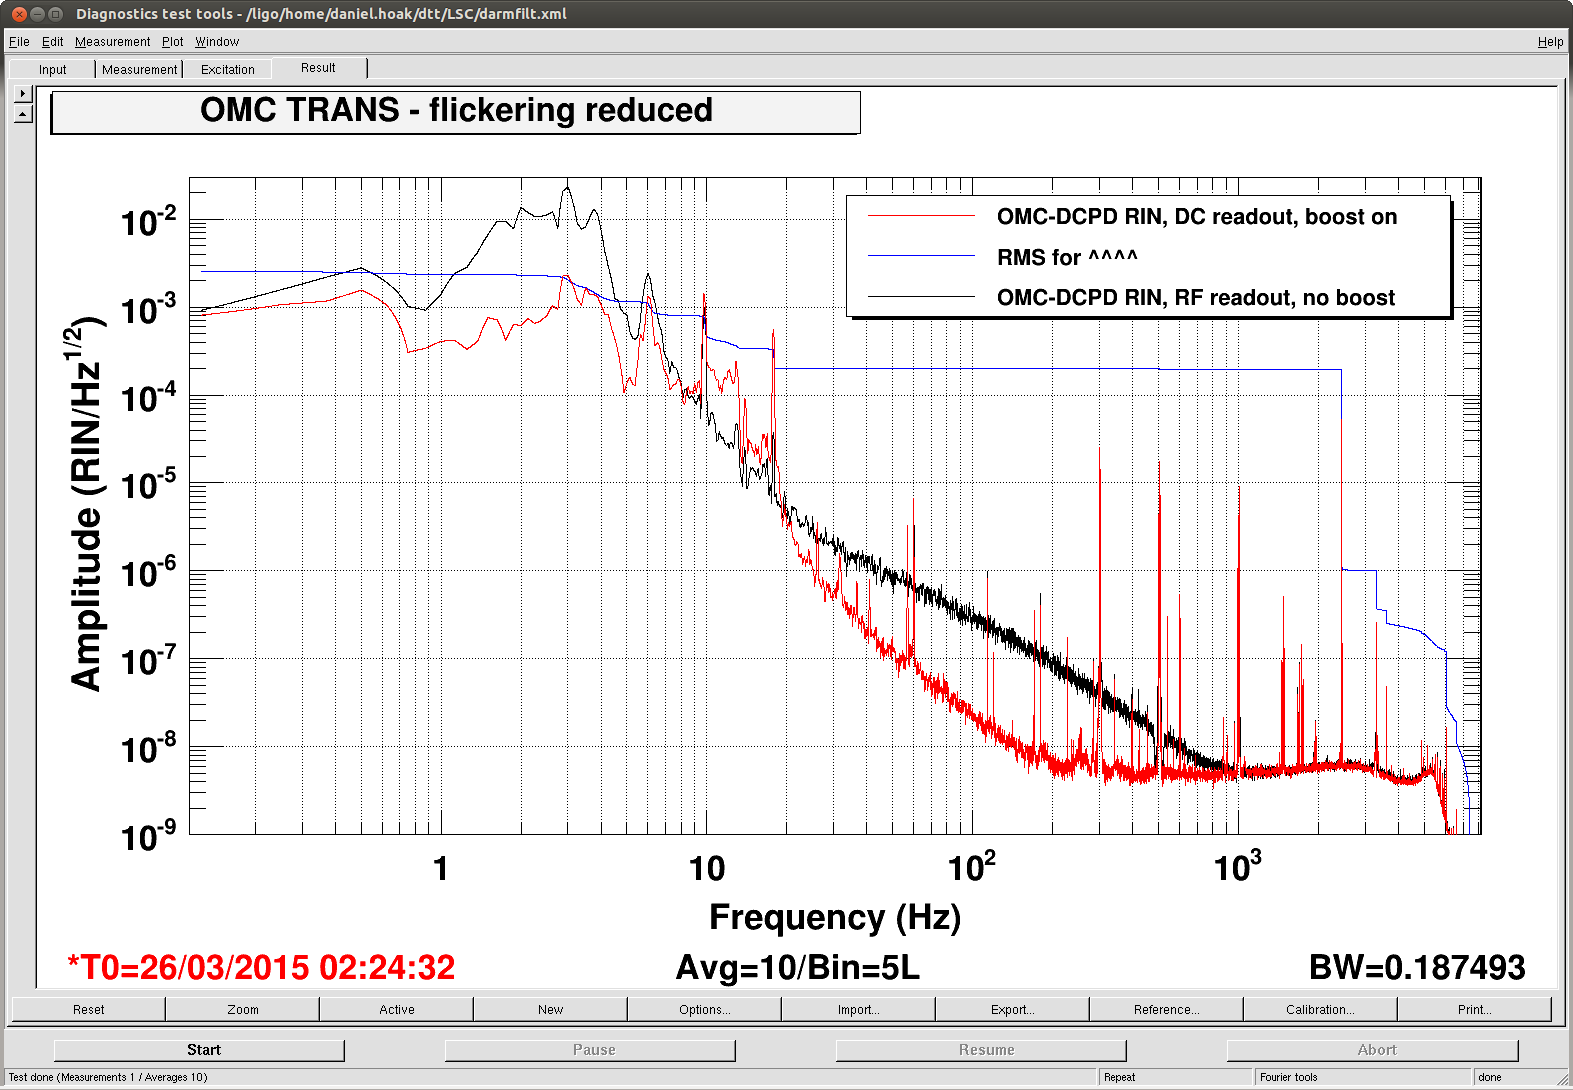
The first plot is a comparison of the OMC TRANS intensity noise before and after the boost filter was engaged. The RMS before the boost was 2e-2 /rt[Hz], now it is 3e-3 /rt[Hz]. The OMC TRANS camera is much calmer.
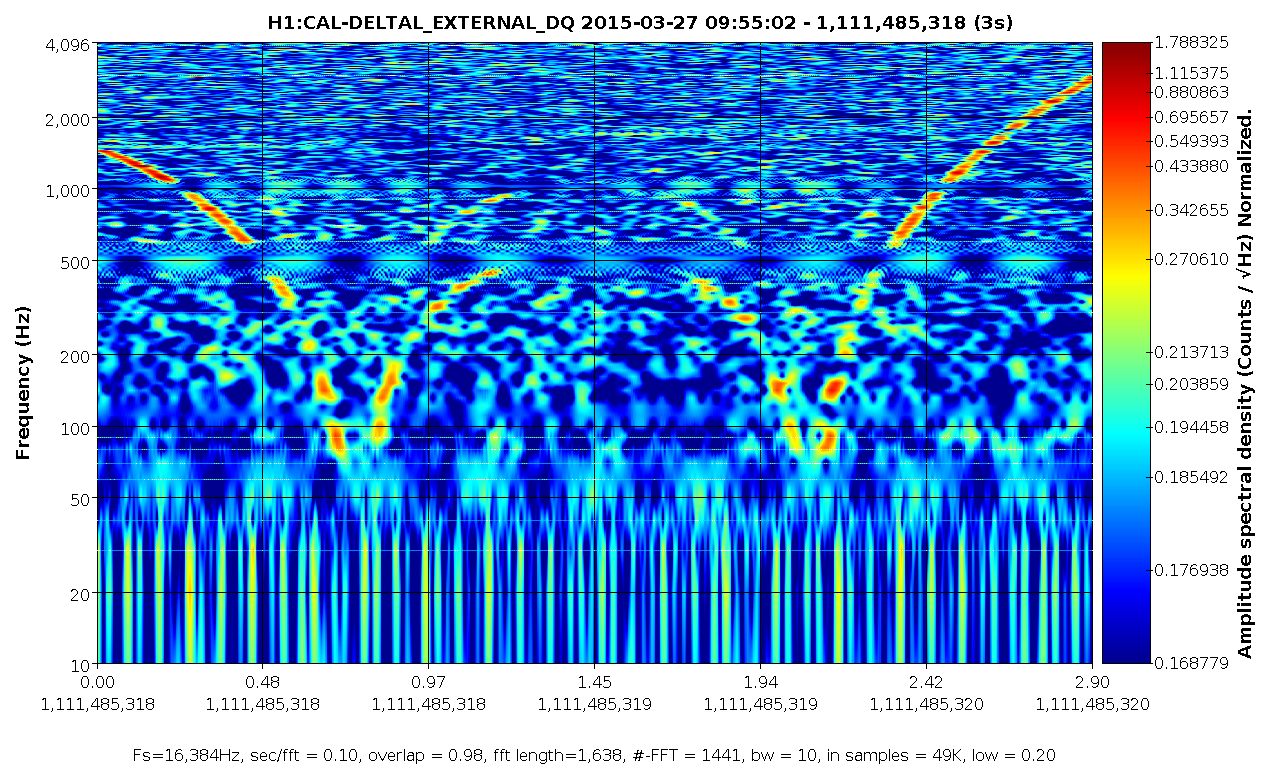
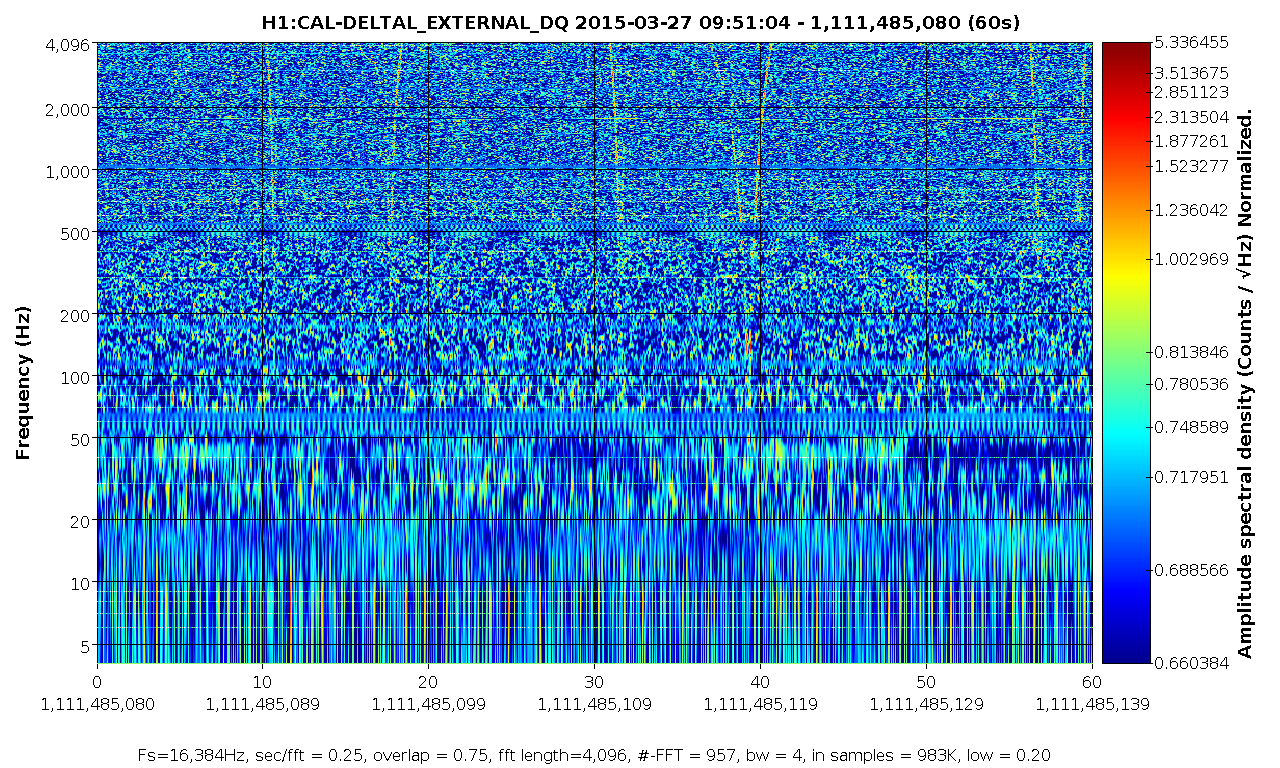
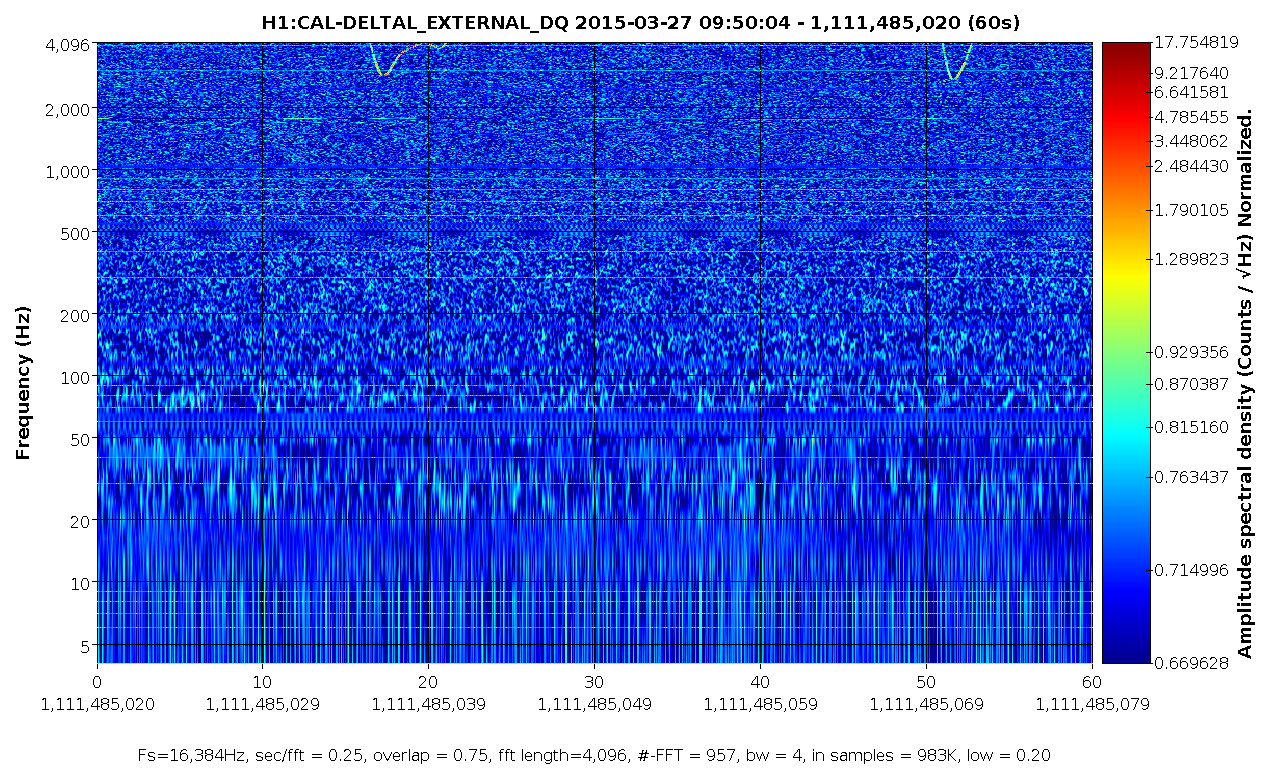
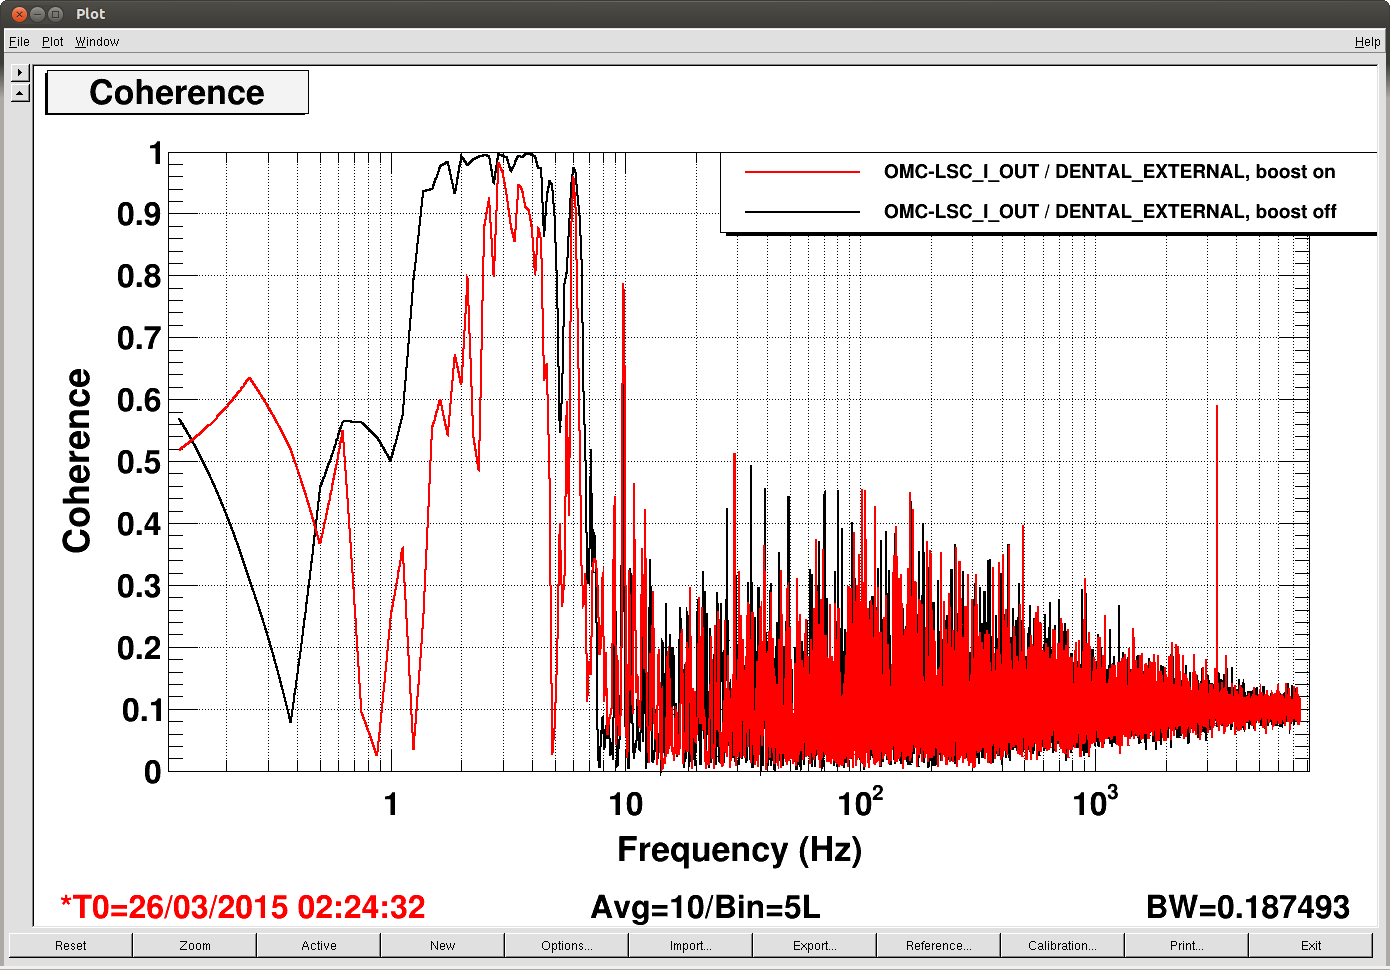
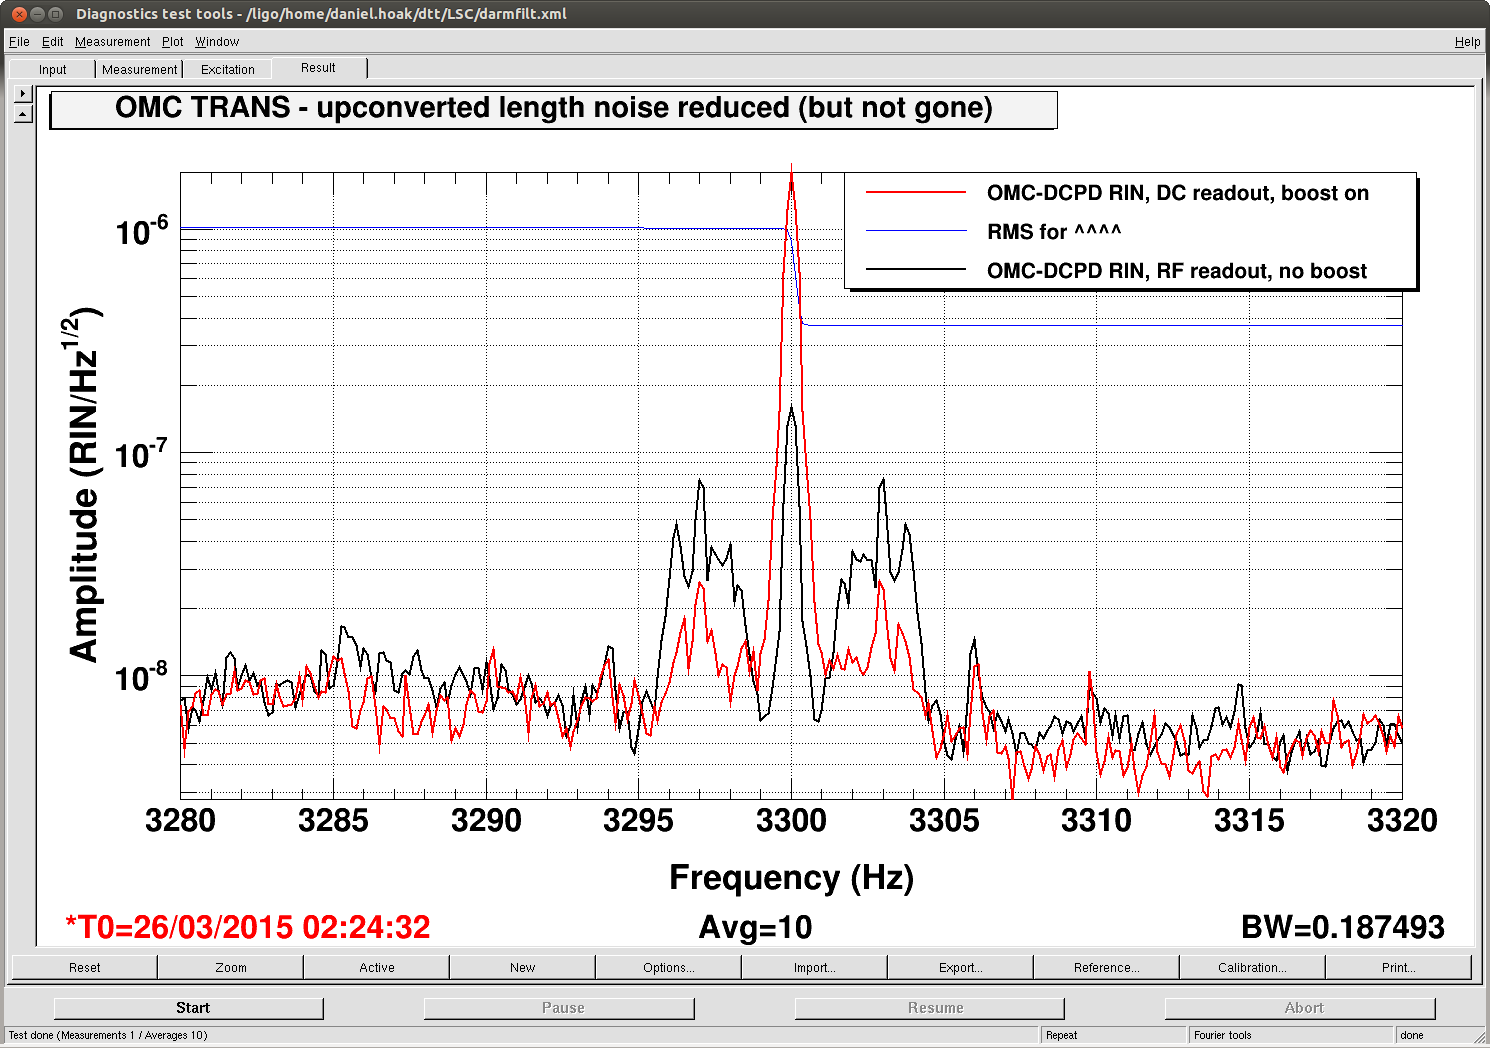
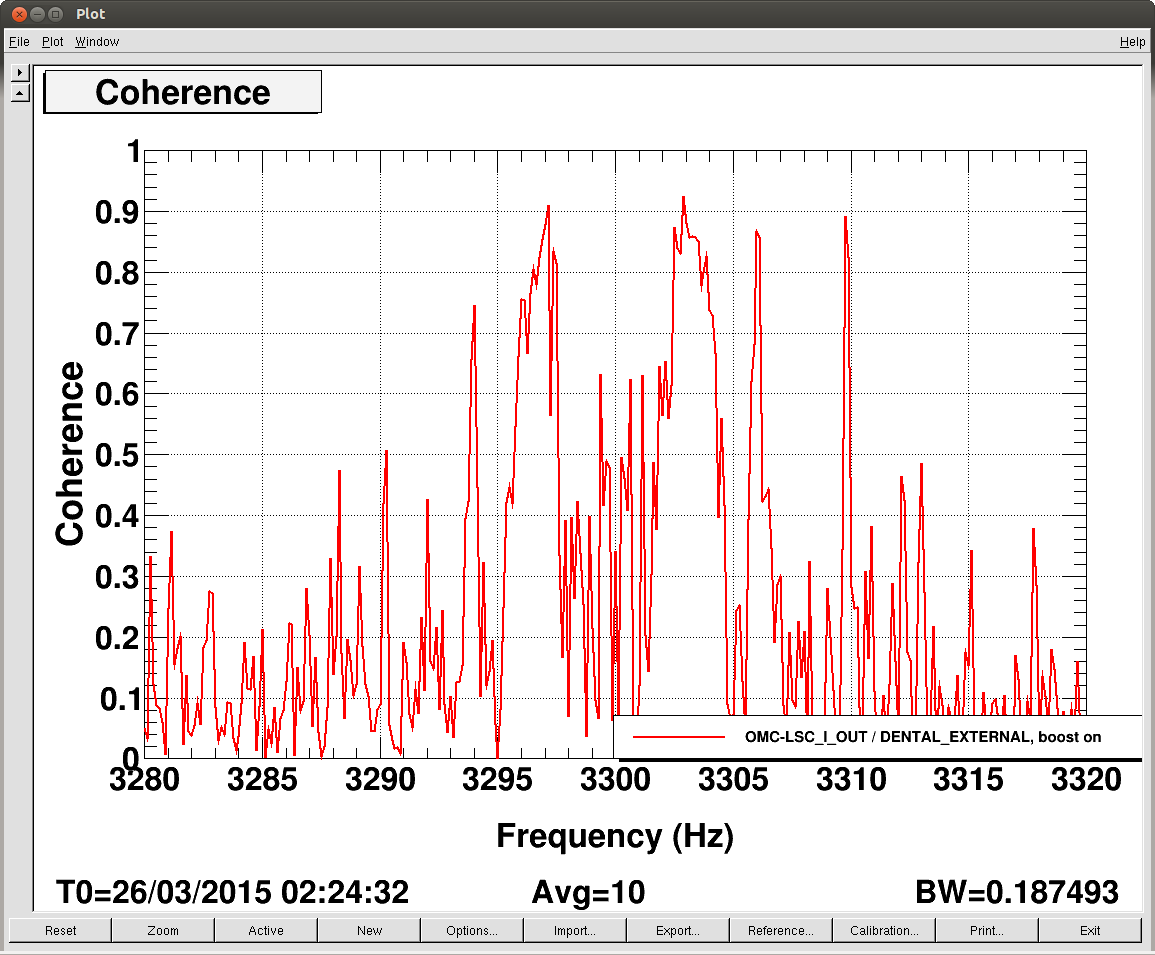
The boost filter also reduced the coherence between the OMC length error signal and DARM. Yesterday, Keita pointed out that the OMC length loop was far, far too coherent with DARM between 1-6 Hz, and this noise was being upconverted around the dither line at 3.3kHz. The upconversion mechanism is not clear; if the OMC length is properly servoed the dither should not generate any RIN (or, very little) and should not upconvert any low-frequency RIN noise to sidebands around the dither frequency. But, that's what's happening. The new boost filter reduces the coherence at low frequency (second plot) and reduces the sidebands at 3.3kHz (third plot), but the coherence at low frequency and at 3.3kHz is not zero (second, fourth plots).
As a precaution against OMC LSC --> DARM coupling, we have reduced the gain of the OMC length loop even further: the OMC LSC boost is now off, and there is a 30Hz rolloff filter (FM3) in the OMC length loop. The UGF is a little more than 10Hz, as described by the green trace from the first figure in this entry.
Keita also recommended changing the dither frequency and changing the dither amplitude and OMC LSC loop gain. We haven't had a chance to do these things tonight. We need to investigate why this noise is being upconverted - note that the amplitude of the 3.3kHz dither line in the OMC RIN increased after the OMC LSC boost was turned off (third plot).
The good ETMY and ITMX bounce mode damping settings with the DARM boost ON are (in M0_DARM_DAMP_V):
ETMY: +60deg, gain=500
ITMX: 0deg, gain=-100
The good settings with the boost OFF are:
ETMY: -60deg, gain=-2000
ITMX: 0deg, gain=200
This switching is handled by the Guardian.
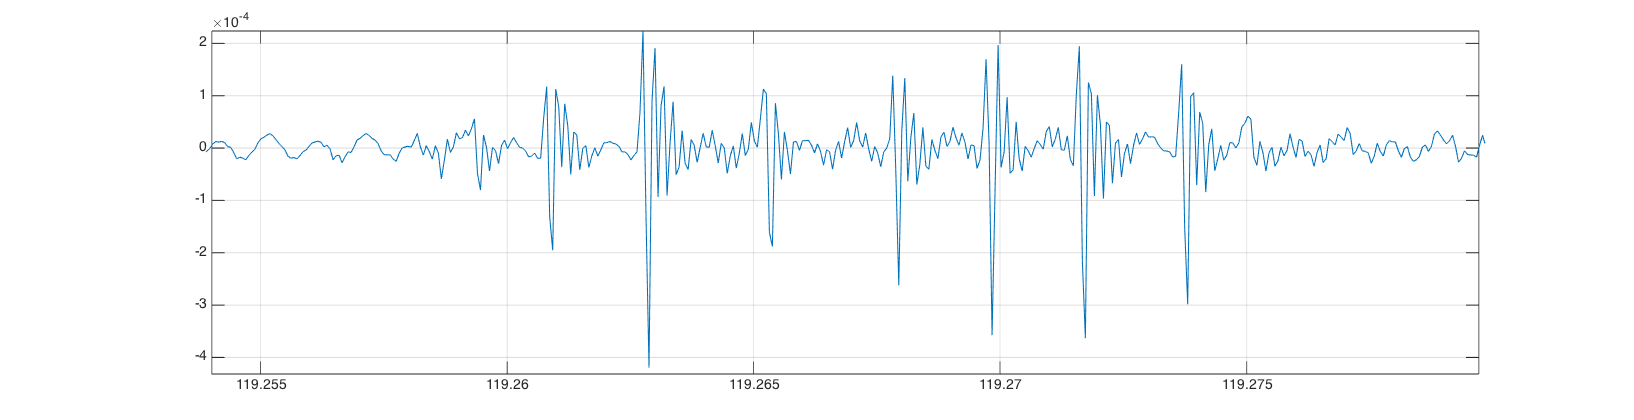
By the way, an ongoing mystery is the source of a 300Hz line in DARM that is very large at the beginning of a lock but steadily decays to the level of the noise floor over a timescale of ~10-20min. The rate of decay is somewhat matched to the BS butterfly mode and the earlier twin peaks noise, but the line is present when we're locked on RF readout, so it doesn't seem to be coming from the OMC. We've checked the IOP inputs that are sampled at 65k and we don't see a line at 16384+/-300Hz that could be aliased, but we should check again at the very start of a lock when the 300Hz line is very prominent.

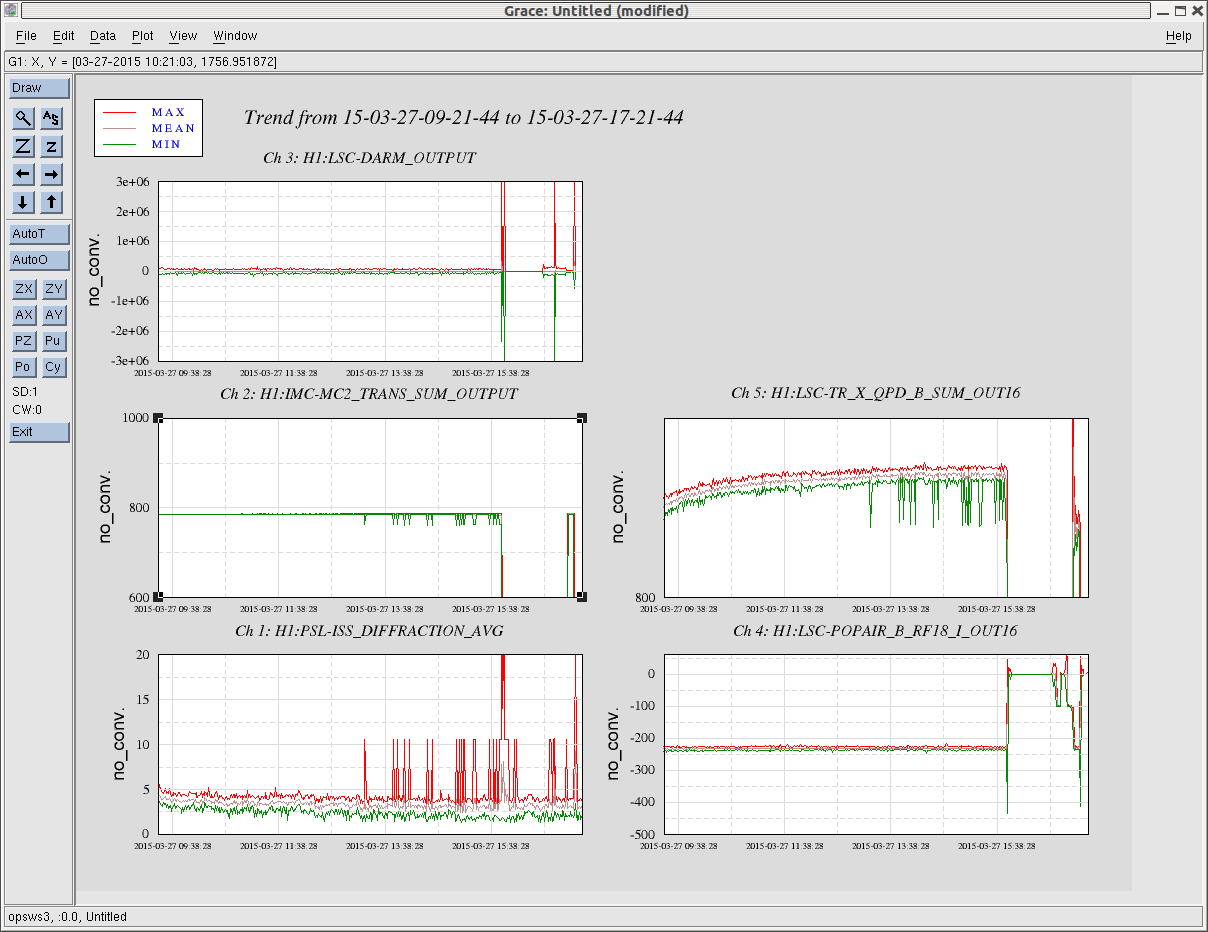


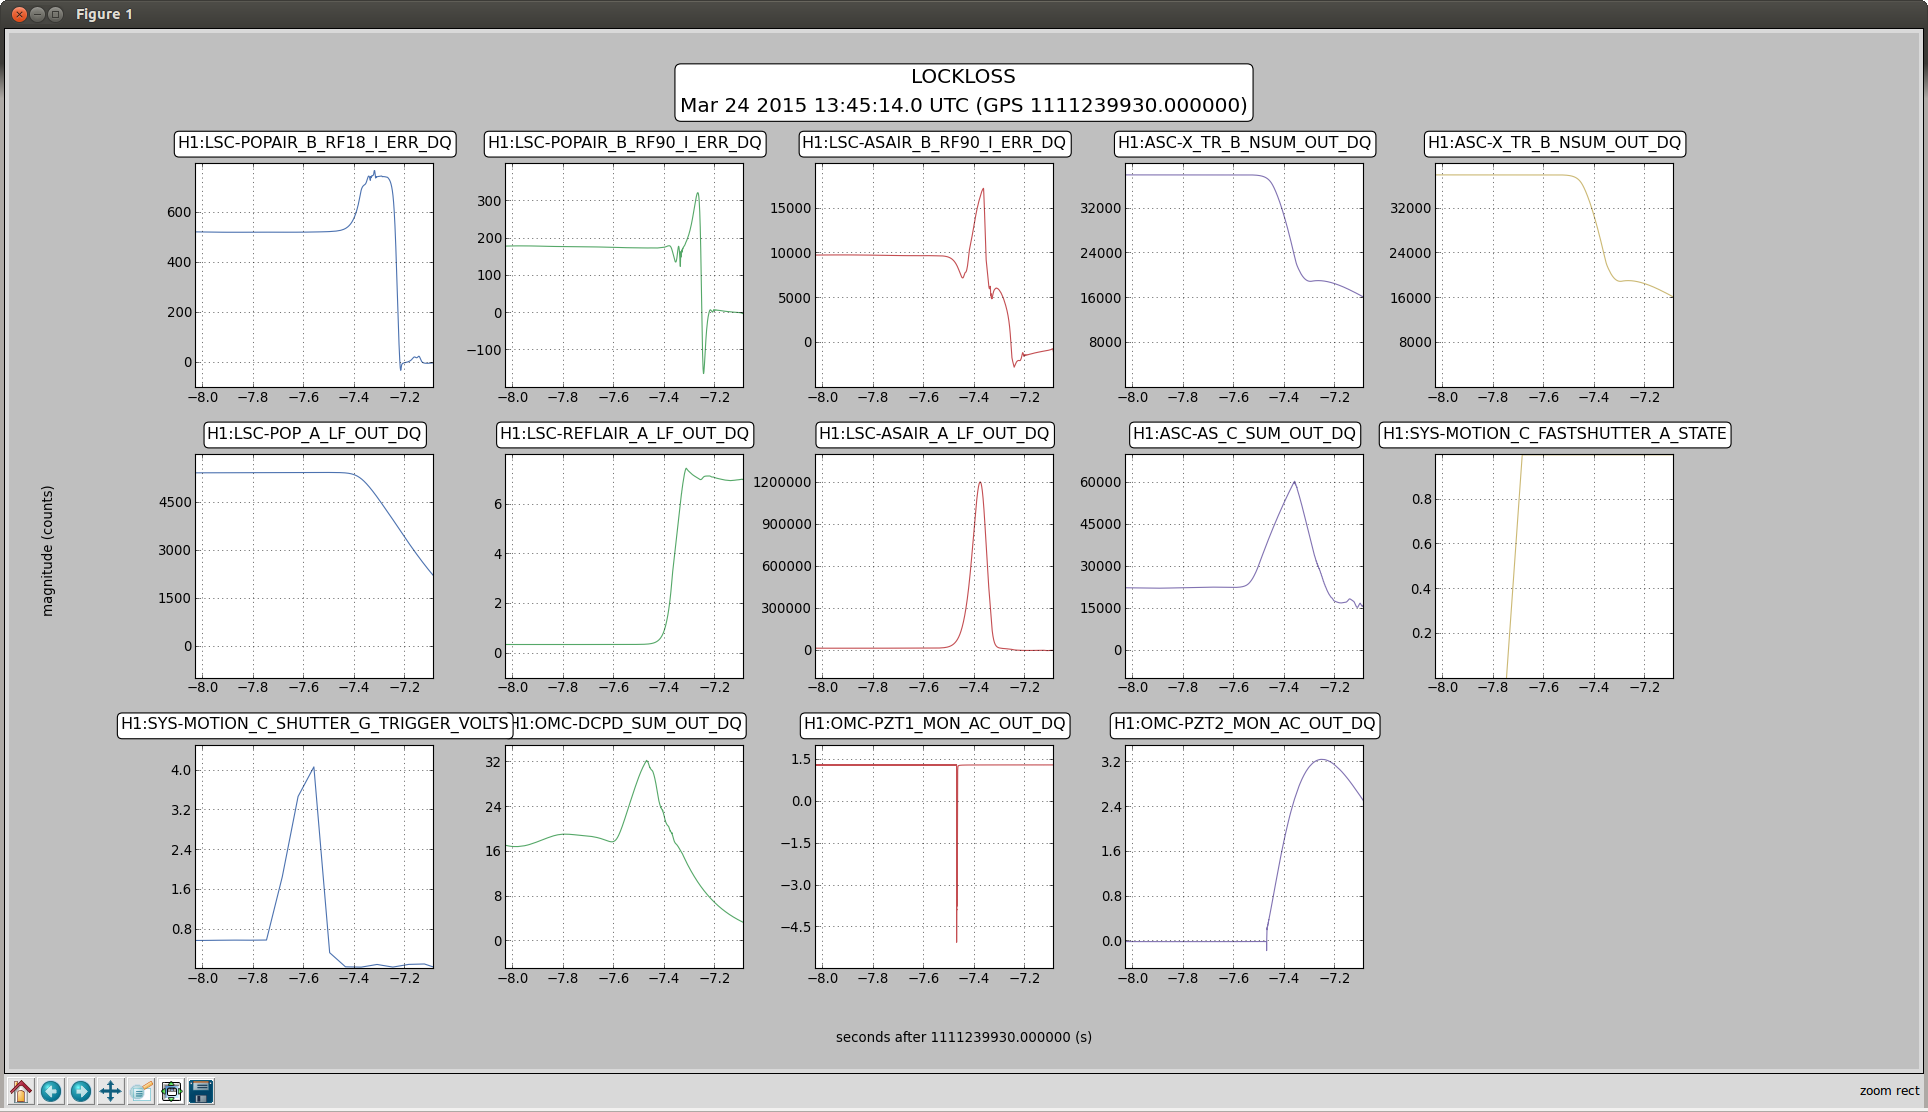
We now have a problem we haven't encoutnered before. The ISC_LOCK guardian has SPM DIFFs errors, because of dead channels. There are ten channels related to the ALS_COMM guardian listed as the SPM diffs, I don't know if these are all of them or just the first ten. Attached screen shot shows the list, and also that we can caget these channels. Kiwamu and I restarted the guardians, which made no difference, then we tried destroying them as well, with the same result.
This morning Elli and I retuned the dark offsets for the transmon QPDs, after doing this we were able to do the entire CARM offset reduction without using the in air transmission PDs. After this succeeded we closed the beam diverters, redid the initial alignment, and attempted to lock. We failed at the TR_CARM step three times in a row, so we opened the beam diverters and re did the initial alignment. After that we were able to lock without using the In air PDs, which is what we have been doing all day.
The current situation is that the End X beam diverter is closed, and End Y is open. Kiwamu re did the initial alignment in this situation, and when we have ALS locked we can see that the spots are well centered on X end transmission QPDs. We were hopping to try locking like this, but ran into difficulties with the mich lock acquisiton attempts breaking the lock of ALS DIFF. We saw that the beat note power has slowly drifted down over the last few weeks, (from 0.5 dBm to -0.5 dBm), so we though it could be that a small alignment kick to the BS is enough to loose the beat note completely. Its hard to verify this theory since we don't trust the timing between the Beckhoff and the RCG.(alog 17455) I went to the table and touched up the beat note alingment, now it is about 0 dBm.
I tracked down the guardian communication problem to the following code in the /opt/rtcds/userapps/release/isc/h1/guardian/bs_m2_switch.py module:
This is NOT OK to put in any module being imported by guardian code. This creates a second, separate instance of the EPICS interaction object, that interferes with the one created and supplied by guardian itself. It effectively breaks all EPICS interaction in the guardian node, which is what happened here.
If you think you need to do something like this please contact me and we'll figure out a better way.
Presumably this module was newly added to the ISC_LOCK node before the problem arose, and the reported breakage happened after it was reloaded. After removing those lines from bs_m2_switch.py everything now appears to be working normally.
As an aside, please always provide FULL DISCLOSURE when reporting problems like this. Usually things don't break spontaneously on their own. Whatever was being done right before you saw the problem is probably what caused it. (Kiwamu: if you didn't know about this change when we spoke on the phone then you're off the hook).
Evan, Dan
The Guardian issue was fixed when we returned from dinner, but then the winds came. We switched the end station ISI's to the 90mHz blends and increased the tidal gains; the common UGFs are now 0.1Hz (were 0.05Hz) and the X-arm tidal UGF is 0.1Hz (was 0.06Hz).
Initially we observed the same problem that Sheila reported, the ALS would lose lock as soon as the DRMI started to drive the mirrors. But after mucking with the DRMI alignment for a little while (not at all sure that this helped), I have been able to acquire lock with DRMI a couple of times. A test of applying a large DC offset into the BS longitudinal drive does not break the ALS_DIFF lock, so maybe that problem is no longer a problem.
There is now a new problem, the DRMI Guardian isn't happy with the state DRMI_LOCKED_1F_ASC (which is the requested state from the ISC_LOCK Guardian). Upon finishing this state is recalculates the path and jumps back to LOCK_DRMI_1F, see the attached log, and the attached graph. This has happened three times now.
Also attached is a plot of our progress since Monday night. I am leaving the IFO set to CHECK_IR to acquire ALS data during the windy conditions.
For MICH FF, the filters used are FM6 and FM7 (which are stopbands for the violin modes and harmonics), and FM9 (which inverts the BS M2→M3 plant). The gain is 0.040 ct/ct.
For SRCL FF, the filters used are FM6 and FM7 (as above). The gain is −2.5 ct/ct.
Both feed back only to ITMY L2.
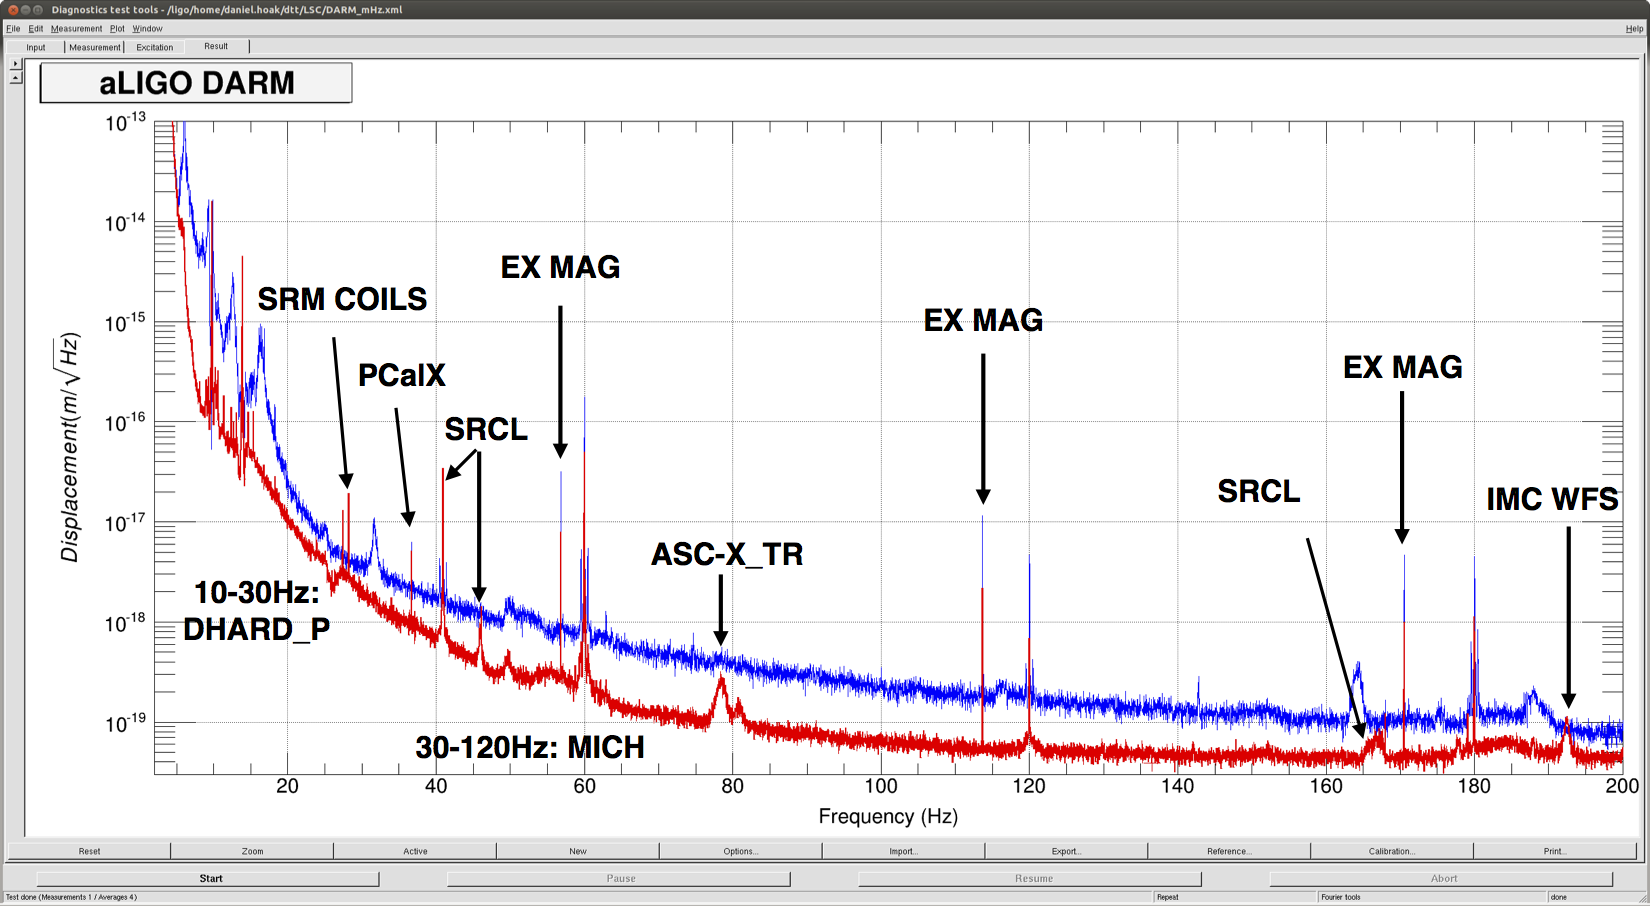
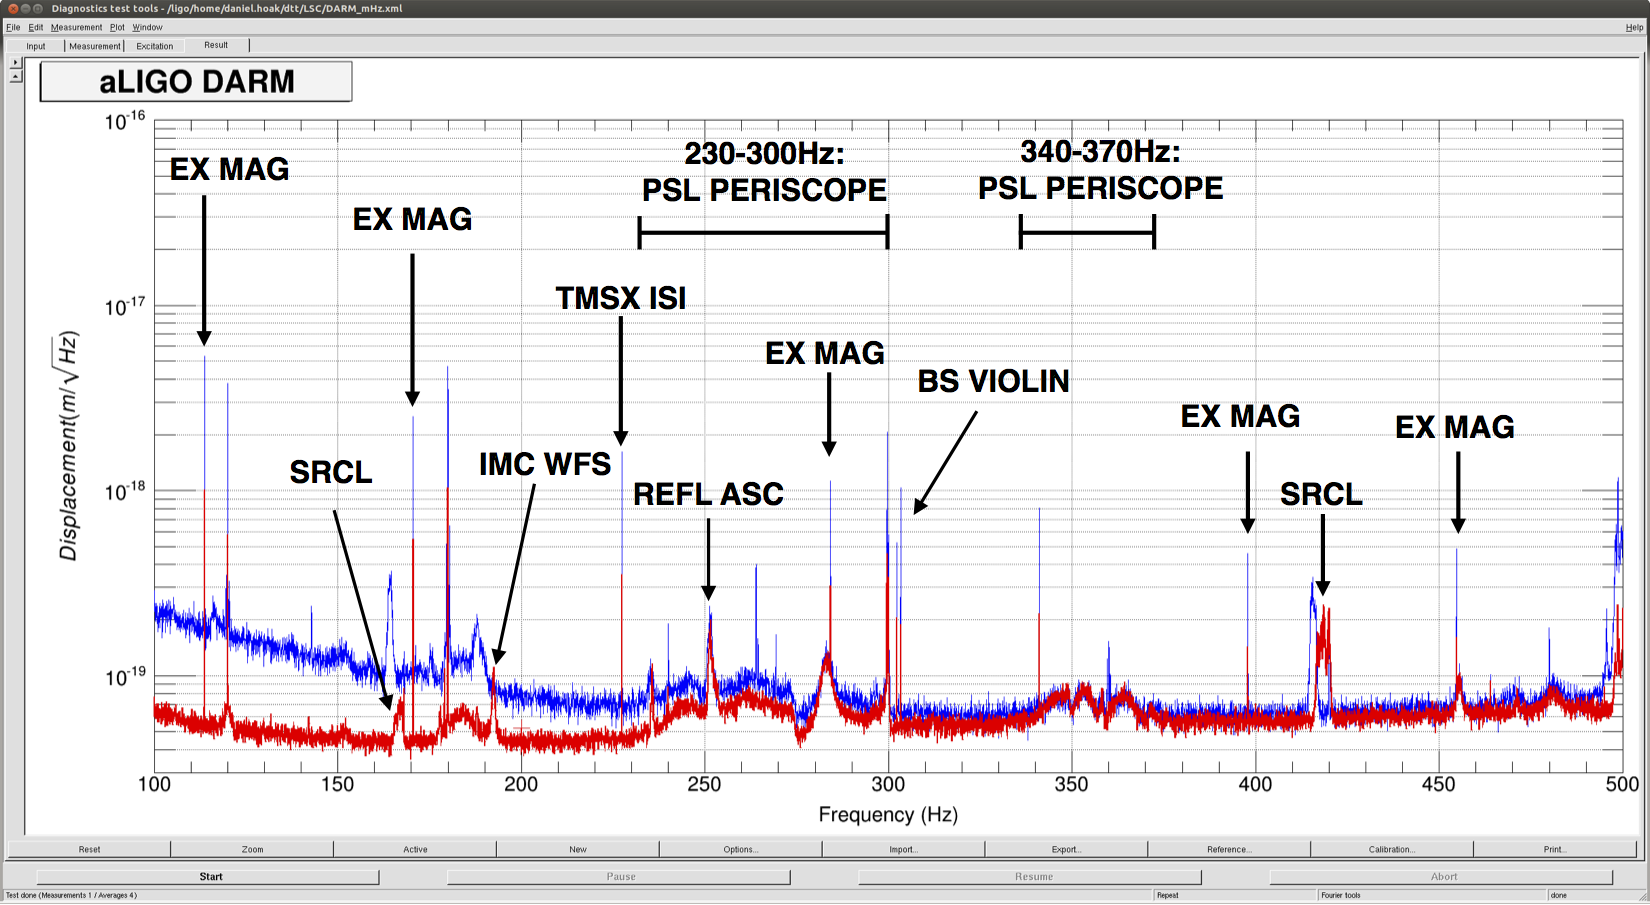
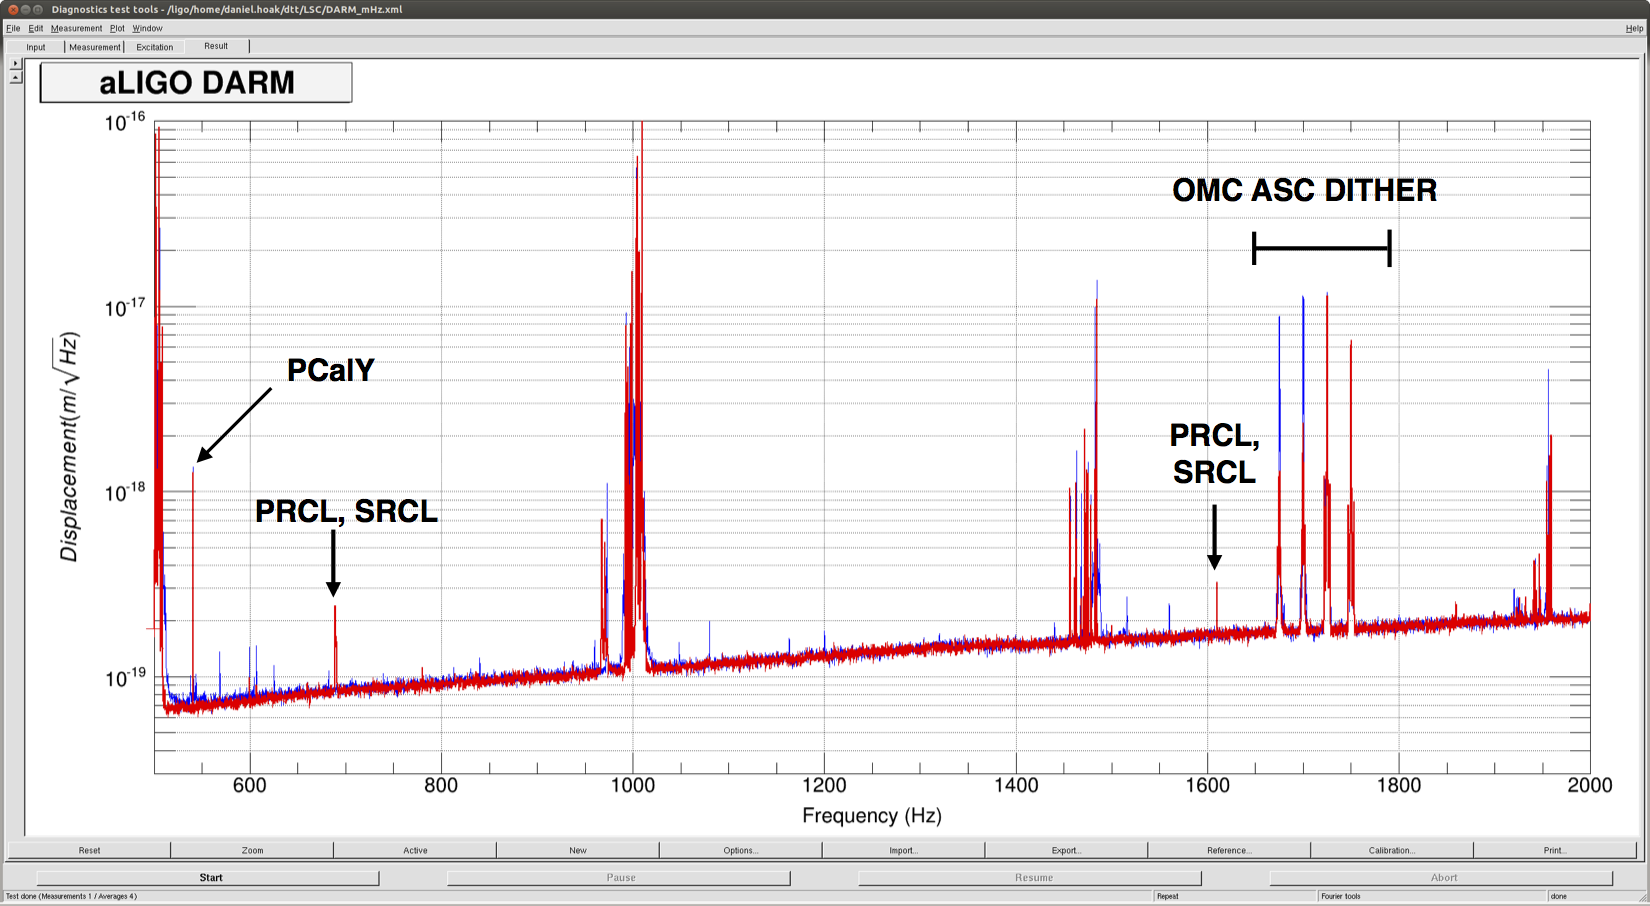
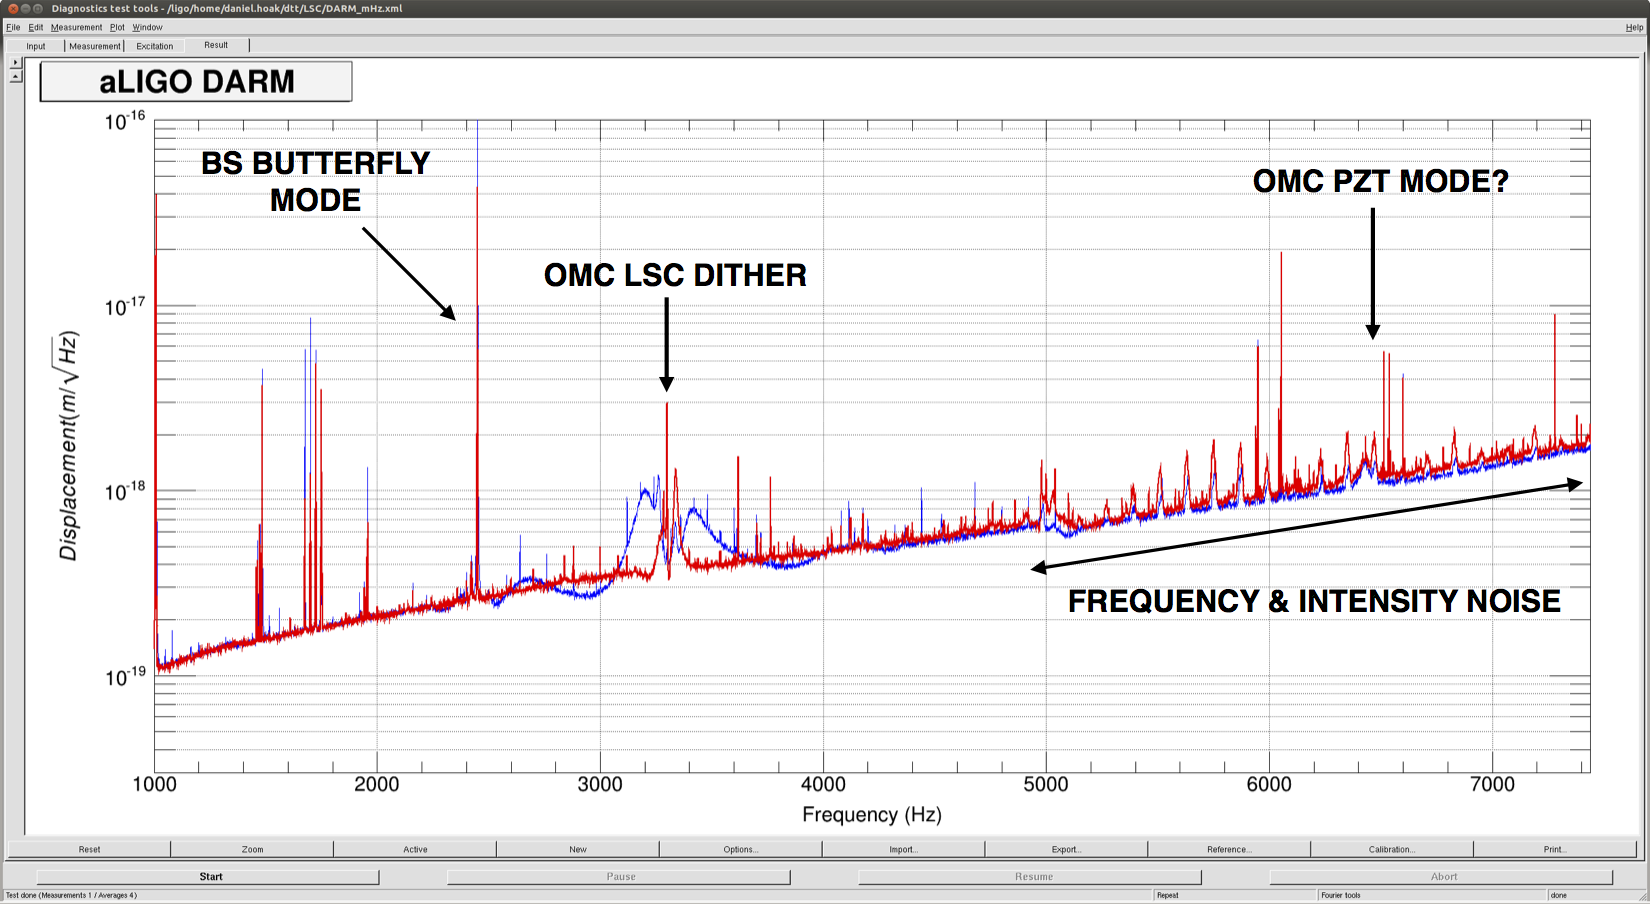
Also attached is a text file and noise budget of a good spectrum from today. I would like to remark that
Thank you so much Jamie.
I think bs_m2_switch.py is a code that TJ, Sheila and I have been preparing today. I was aware of the active coding effort that TJ has been putting today, but I simply did not know that bs_m2_switch had been already loaded in the ISC_LOCK guardian. My apologies that I did not collect and did not provide all information about the coding activities on ISC_LOCK at around the time.
Dan: the ISC_DRMI assert_drmi_locked GuardStateDecorator (defined in ISC_library.py) is wrapping the methods in DRMI_LOCKED_1F_ASC, and it returns 'LOCK_DRMI_1F' if DRMI_locked() returns False. The obvious explanation for the behavior you saw is just that DRMI_locked() was False. Here's what's currently defined in that function (at least from what's currently committed to the USERAPPS):
The epics problem was my bad. I imported bs_m2_switch but didn't think of it when I called Jamie since we weren't calling it I assumed it couldn't be doing much. Apologies.