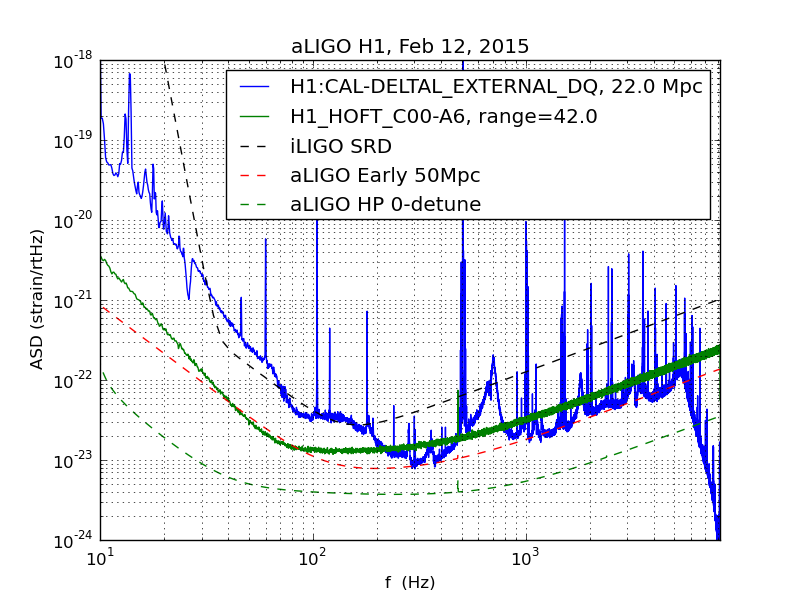
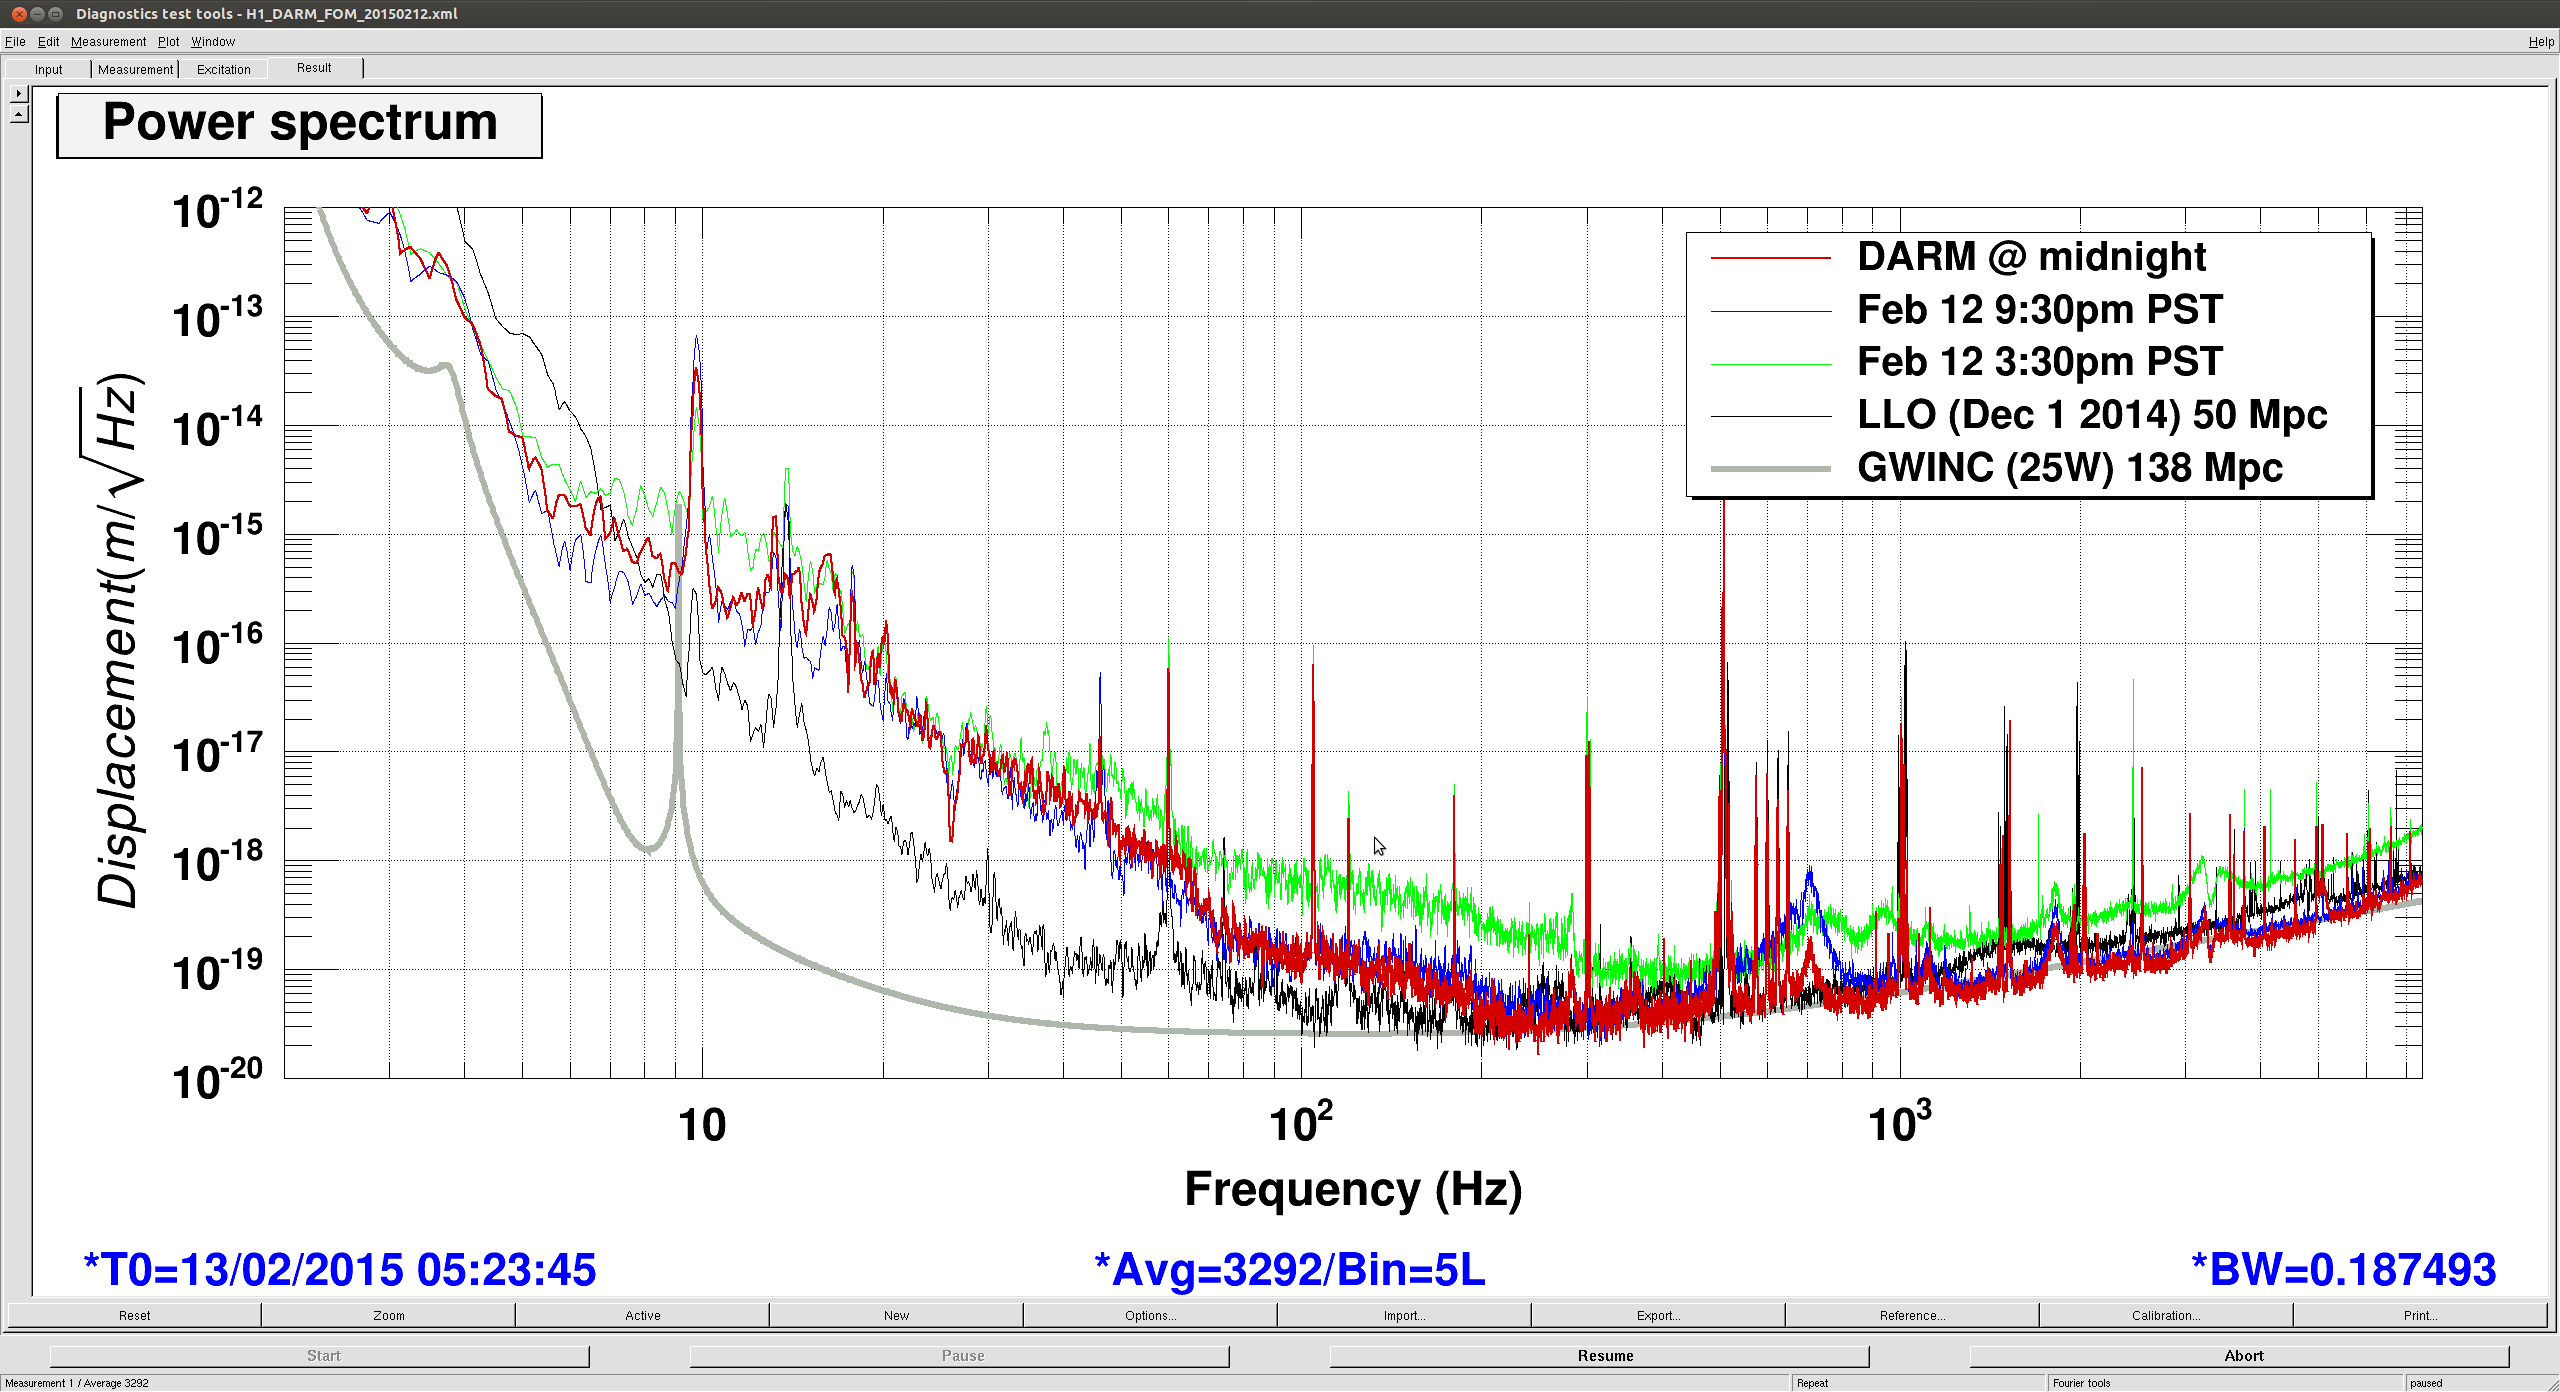
Here's what I get from around 9:30 PM PST:
https://ldas-jobs.ligo.caltech.edu/~ajw/projects/ER/A6H1/A6H1_1107840516_asd.png
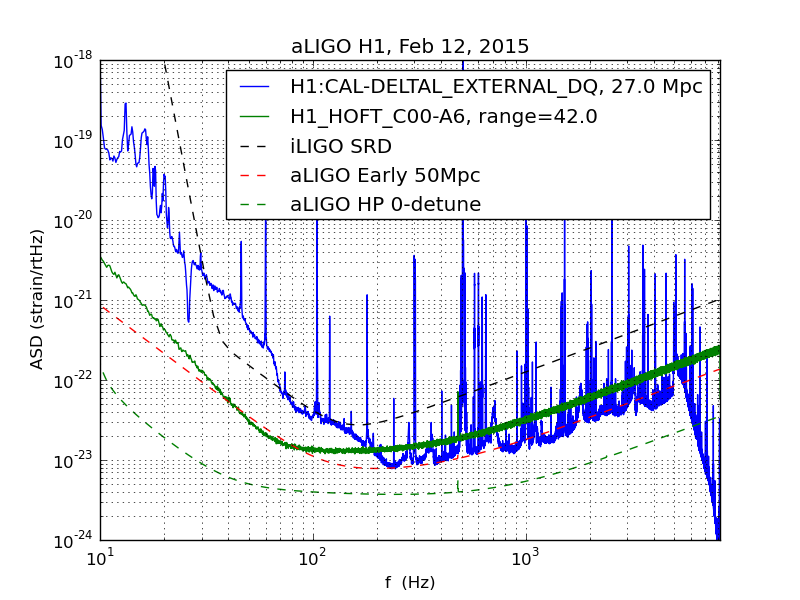
and from around 11:40 PM PST:
https://ldas-jobs.ligo.caltech.edu/~ajw/projects/ER/A6H1/A6H1_1107848416_asd.png
I dewhitened with 5 poles at 1 Hz and 5 zeros at 100 Hz, from Kiwamu's alog 16701 , and I use an 8s blackman window with 50% overlap. See https://ldas-jobs.ligo.caltech.edu/~ajw/projects/ER/A6H1/A6H1.py
The first plot shows that 1/f from 25-70 Hz; it's less prominent a bit later. The 4 lines at ~600 Hz are the OMC dither? (Also prominent at LLO; can they be moved up out of band?)
And if you play with the times, there's plenty of variability in the excess noise at 30-200 Hz.
The green HOFT_C00 is H1:GDS-FAKE-STRAIN; just there for reference. I hope it will change into GDS-CALIB-STRAIN soon...
Unless I made some error, LHO is already at 27 Mpc sensemon range (never got much beyond 20 Mpc in S6), wow!
Here's what I get from around 9:30 PM PST:
https://ldas-jobs.ligo.caltech.edu/~ajw/projects/ER/A6H1/A6H1_1107840516_asd.png
and from around 11:40 PM PST:
https://ldas-jobs.ligo.caltech.edu/~ajw/projects/ER/A6H1/A6H1_1107848416_asd.png
I dewhitened with 5 poles at 1 Hz and 5 zeros at 100 Hz, from Kiwamu's alog 16701 , and I use an 8s blackman window with 50% overlap. See https://ldas-jobs.ligo.caltech.edu/~ajw/projects/ER/A6H1/A6H1.py
The first plot shows that 1/f from 25-70 Hz; it's less prominent a bit later. The 4 lines at ~600 Hz are the OMC dither? (Also prominent at LLO; can they be moved up out of band?)
And if you play with the times, there's plenty of variability in the excess noise at 30-200 Hz.
The green HOFT_C00 is H1:GDS-FAKE-STRAIN; just there for reference. I hope it will change into GDS-CALIB-STRAIN soon...
Unless I made some error, LHO is already at 27 Mpc sensemon range (never got much beyond 20 Mpc in S6), wow!Here's what I get from around 9:30 PM PST:
Here's what I get from around 9:30 PM PST:
and from around 11:40 PM PST:
The first plot shows that 1/f from 25-70 Hz; it's less prominent a bit later. The 4 lines at ~600 Hz are the OMC dither? (Also prominent at LLO; can they be moved up out of band?)
And if you play with the times, there's plenty of variability in the excess noise at 30-200 Hz.
The green HOFT_C00 is H1:GDS-FAKE-STRAIN; just there for reference. I hope it will change into GDS-CALIB-STRAIN soon...
Unless I made some error, LHO is already at 27 Mpc sensemon range (never got much beyond 20 Mpc in S6), wow!

