Aidan, Jamie
We now have two TCS guardian nodes: TCS_ITMY and TCS_ITMX.
These are preliminary and contain only diagnostics and no automation. They are checking the status of the main CO2 lasers on ITMX and ITMY.
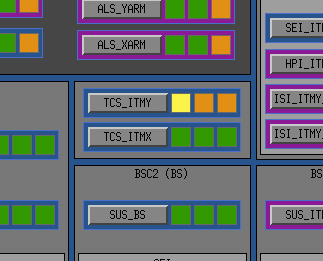
I added links to them in the empty space in the middle of the GUARD_OVERVIEW screen:
They are both running identical code from a common library:
USERAPPS/tcs/common/guardian/TCS_assert.py
There's not much to them at the moment; only two states:
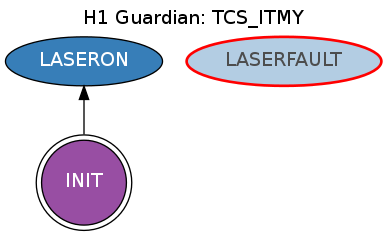
The LASERON state does nothing much check the laser status, and jump to the LASERFAULT state if there's a problem. The LASERFAULT notifications are good at explaining what the problem is, and how to fix them.
NOTE: the TCS_ITMY is constantly in fault now because the ITMY CO2 laser has not been commissioned yet. I'm going to shut it down for the time being until we have something there to monitor.