J. Kissel, K. Izumi,
Regrettably, I have to put this work on hold for the weekend, but it turns out calibration of the IMC in the new CAL-CS infrastructure will be more involved that I thought.
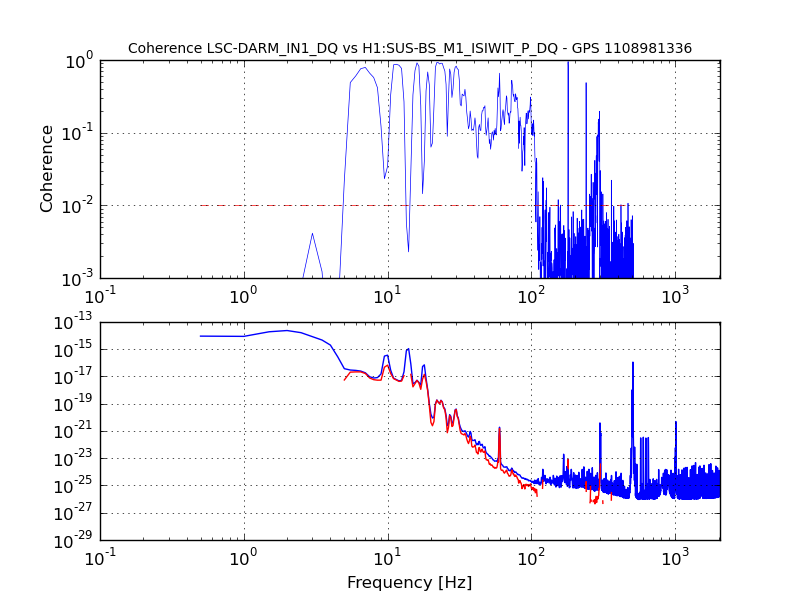
(1) I've managed to install the frequency dependence of the suspensions. Sadly, I've given up (once again) on developing an automated way to generate a photon design string from our matlab dynamical state space models of the suspension. Instead, I used zpkdata on the state space model, and by-hand-cancel all poles and zeros that were obviously the same (for some reason minreal can't do this for me). The end result is happily what I expect -- see first attachment.
Here're the final filters as implemented in foton, which have been stuck in FM5:
"M1toM3"
zpk([0.018585-i*3.410679;0.018585+i*3.410679;1.606379;0.044818-i*1.036165;0.044818+i*1.036165;
0.118436-i*0.689908;0.118436+i*0.689908],
[0.264197-i*3.085648;0.264197+i*3.085648;0.019394-i*3.411951;0.019394+i*3.411951;1.586567;
0.103907-i*1.688080;0.103907+i*1.688080;0.085448-i*0.524339;0.085448+i*0.524339;
0.043202-i*0.791714;0.043202+i*0.791714;0.043839-i*1.040618;0.043839+i*1.040618], 5.070123e+05,
"n")
gain(1.97234e-06)
"M2toM3"
zpk([0.018965-i*3.411371;0.018965+i*3.411371;0.383092-i*2.775995;0.383092+i*2.775995;
0.109233-i*0.626005;0.109233+i*0.626005;0.045076-i*1.037432;0.045076+i*1.037432;1.595790],
[0.264197-i*3.085648;0.264197+i*3.085648;0.019394-i*3.411951;0.019394+i*3.411951;1.586567;
0.103907-i*1.688080;0.103907+i*1.688080;0.085448-i*0.524339;0.085448+i*0.524339;
0.043202-i*0.791714;0.043202+i*0.791714;0.043839-i*1.040618;0.043839+i*1.040618], 2.394780e+03,
"n")gain(0.000417575)
"M3toM3"
zpk([0.019384-i*3.411943;0.019384+i*3.411943;0.268344-i*3.080800;0.268344+i*3.080800;1.587283;
0.119880-i*1.524350;0.119880+i*1.524350;0.105649-i*0.583444;0.105649+i*0.583444;
0.046372-i*1.036411;0.046372+i*1.036411],
[0.019394-i*3.411951;0.019394+i*3.411951;0.264197-i*3.085648;0.264197+i*3.085648;1.586567;
0.103907-i*1.688080;0.103907+i*1.688080;0.085448-i*0.524339;0.085448+i*0.524339;
0.043202-i*0.791714;0.043202+i*0.791714;0.043839-i*1.040618;0.043839+i*1.040618], 2.462902e+01,
"n")
gain(0.0406025)
Again, the design script can be found here:
/ligo/svncommon/SusSVN/sus/trunk/HSTS/H1/MC2/Common/H1SUSMC2_GlobalTFs_to_Foton_20150224.m
(2) The DC gain of the actuation chain -- the M3 (optic) displacement in [m] per (M1, M2, M3) LOCK L drive [ct] gain of the actuation function have not been updated to reflect that we've increase the drive range of the M2 stage. So these should be recalculated.
(3) In the current calibration scheme, we use the error point * 1 / (the sensing function) + the control signal * actuation function. However, the IMC's sensing function will vary with input power, because it doesn't get normalized with ever level of input power. We need to think about how to continually compensate for the optical gain change due to input power change.
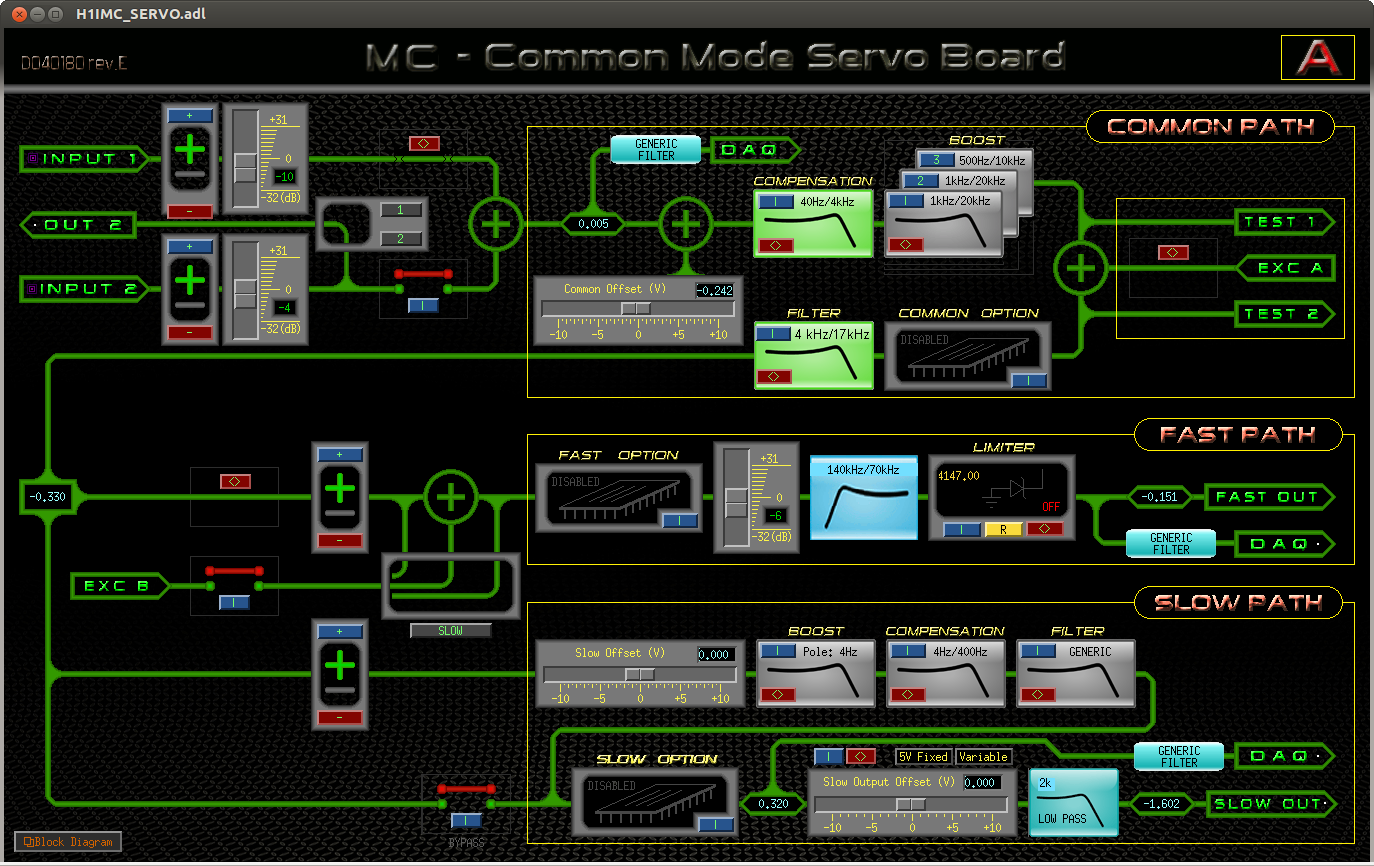
(4) In the calibration current scheme, where we use the IMC error point AND control signals to reconstruct the mode cleaner length isn't properly supported with the current LSC infrastructure. Namely, the error point of the IMC control loop is an analog signal that's *before* the control signal is split into the FAST and SLOW paths. See attached screenshot. The signal is already digitized in the LSC frontend, as "H1:IMC-I_OUT_DQ," but it is not sent over IPC to the CAL-CS model. Further, for the control signal, we need both the FAST and SLOW actuator paths (which *are* already sent to the CAL-CS model). So, if we want to continue with the new CAL-CS calibration scheme, we need send the output of the IMC_I filter bank to the CAL-CS model -- which requires a modification to the LSC model and to the CALCS model.
So.... more work to do on this than I had initially planned and hoped for. We'll get back to it on Monday. *Maybe* I can convince people to make the front end model change on next Tuesday.