Last week, sts correction gains were measured and calculated on HAM4/5/6 to improve the CPS sensor correction. We measured them today for the remaning chambers.
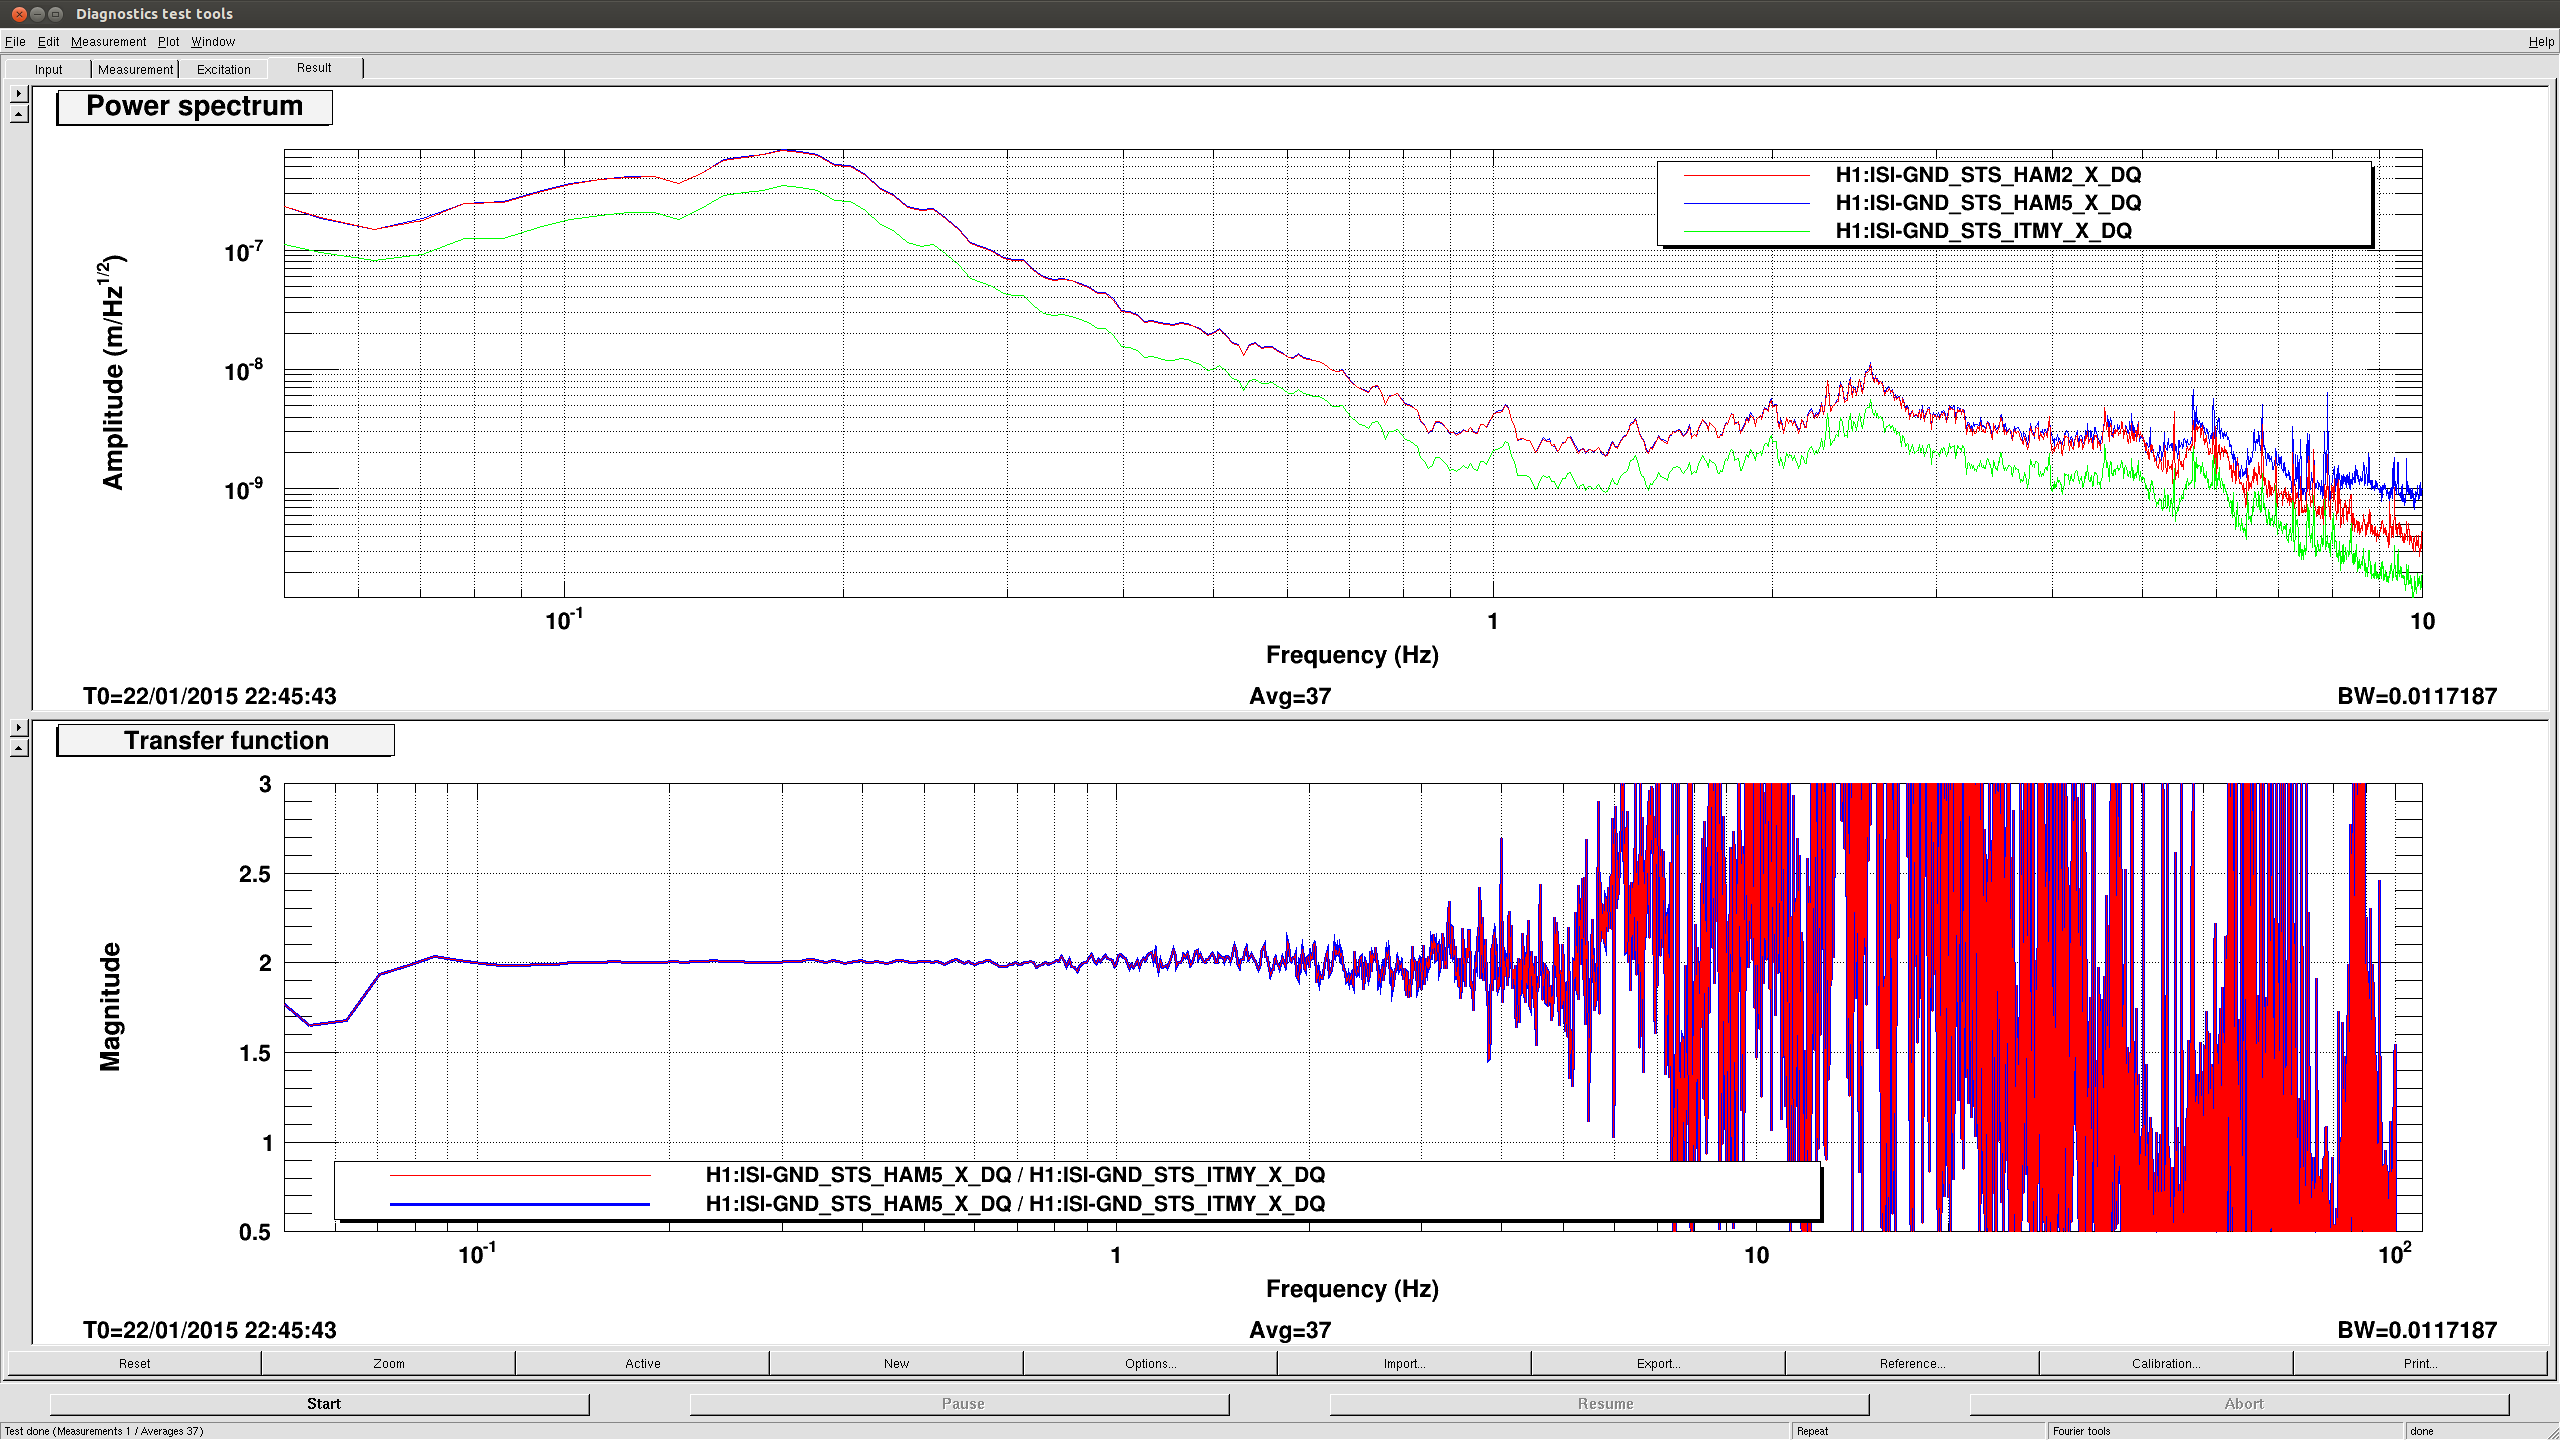
For the BSC chambers, we locked the platforms to the ground by increasing the blends to 750mHz (cf alog) and turned off the sensor correction. We measured the ratio between the T240 (stage 1) and the STS (ground) signal (should be 1 with the platform moving with the ground). The same measurement was also carried out between STS and L4C for hepi, since IPS sensor correction is used for the Z DOF.
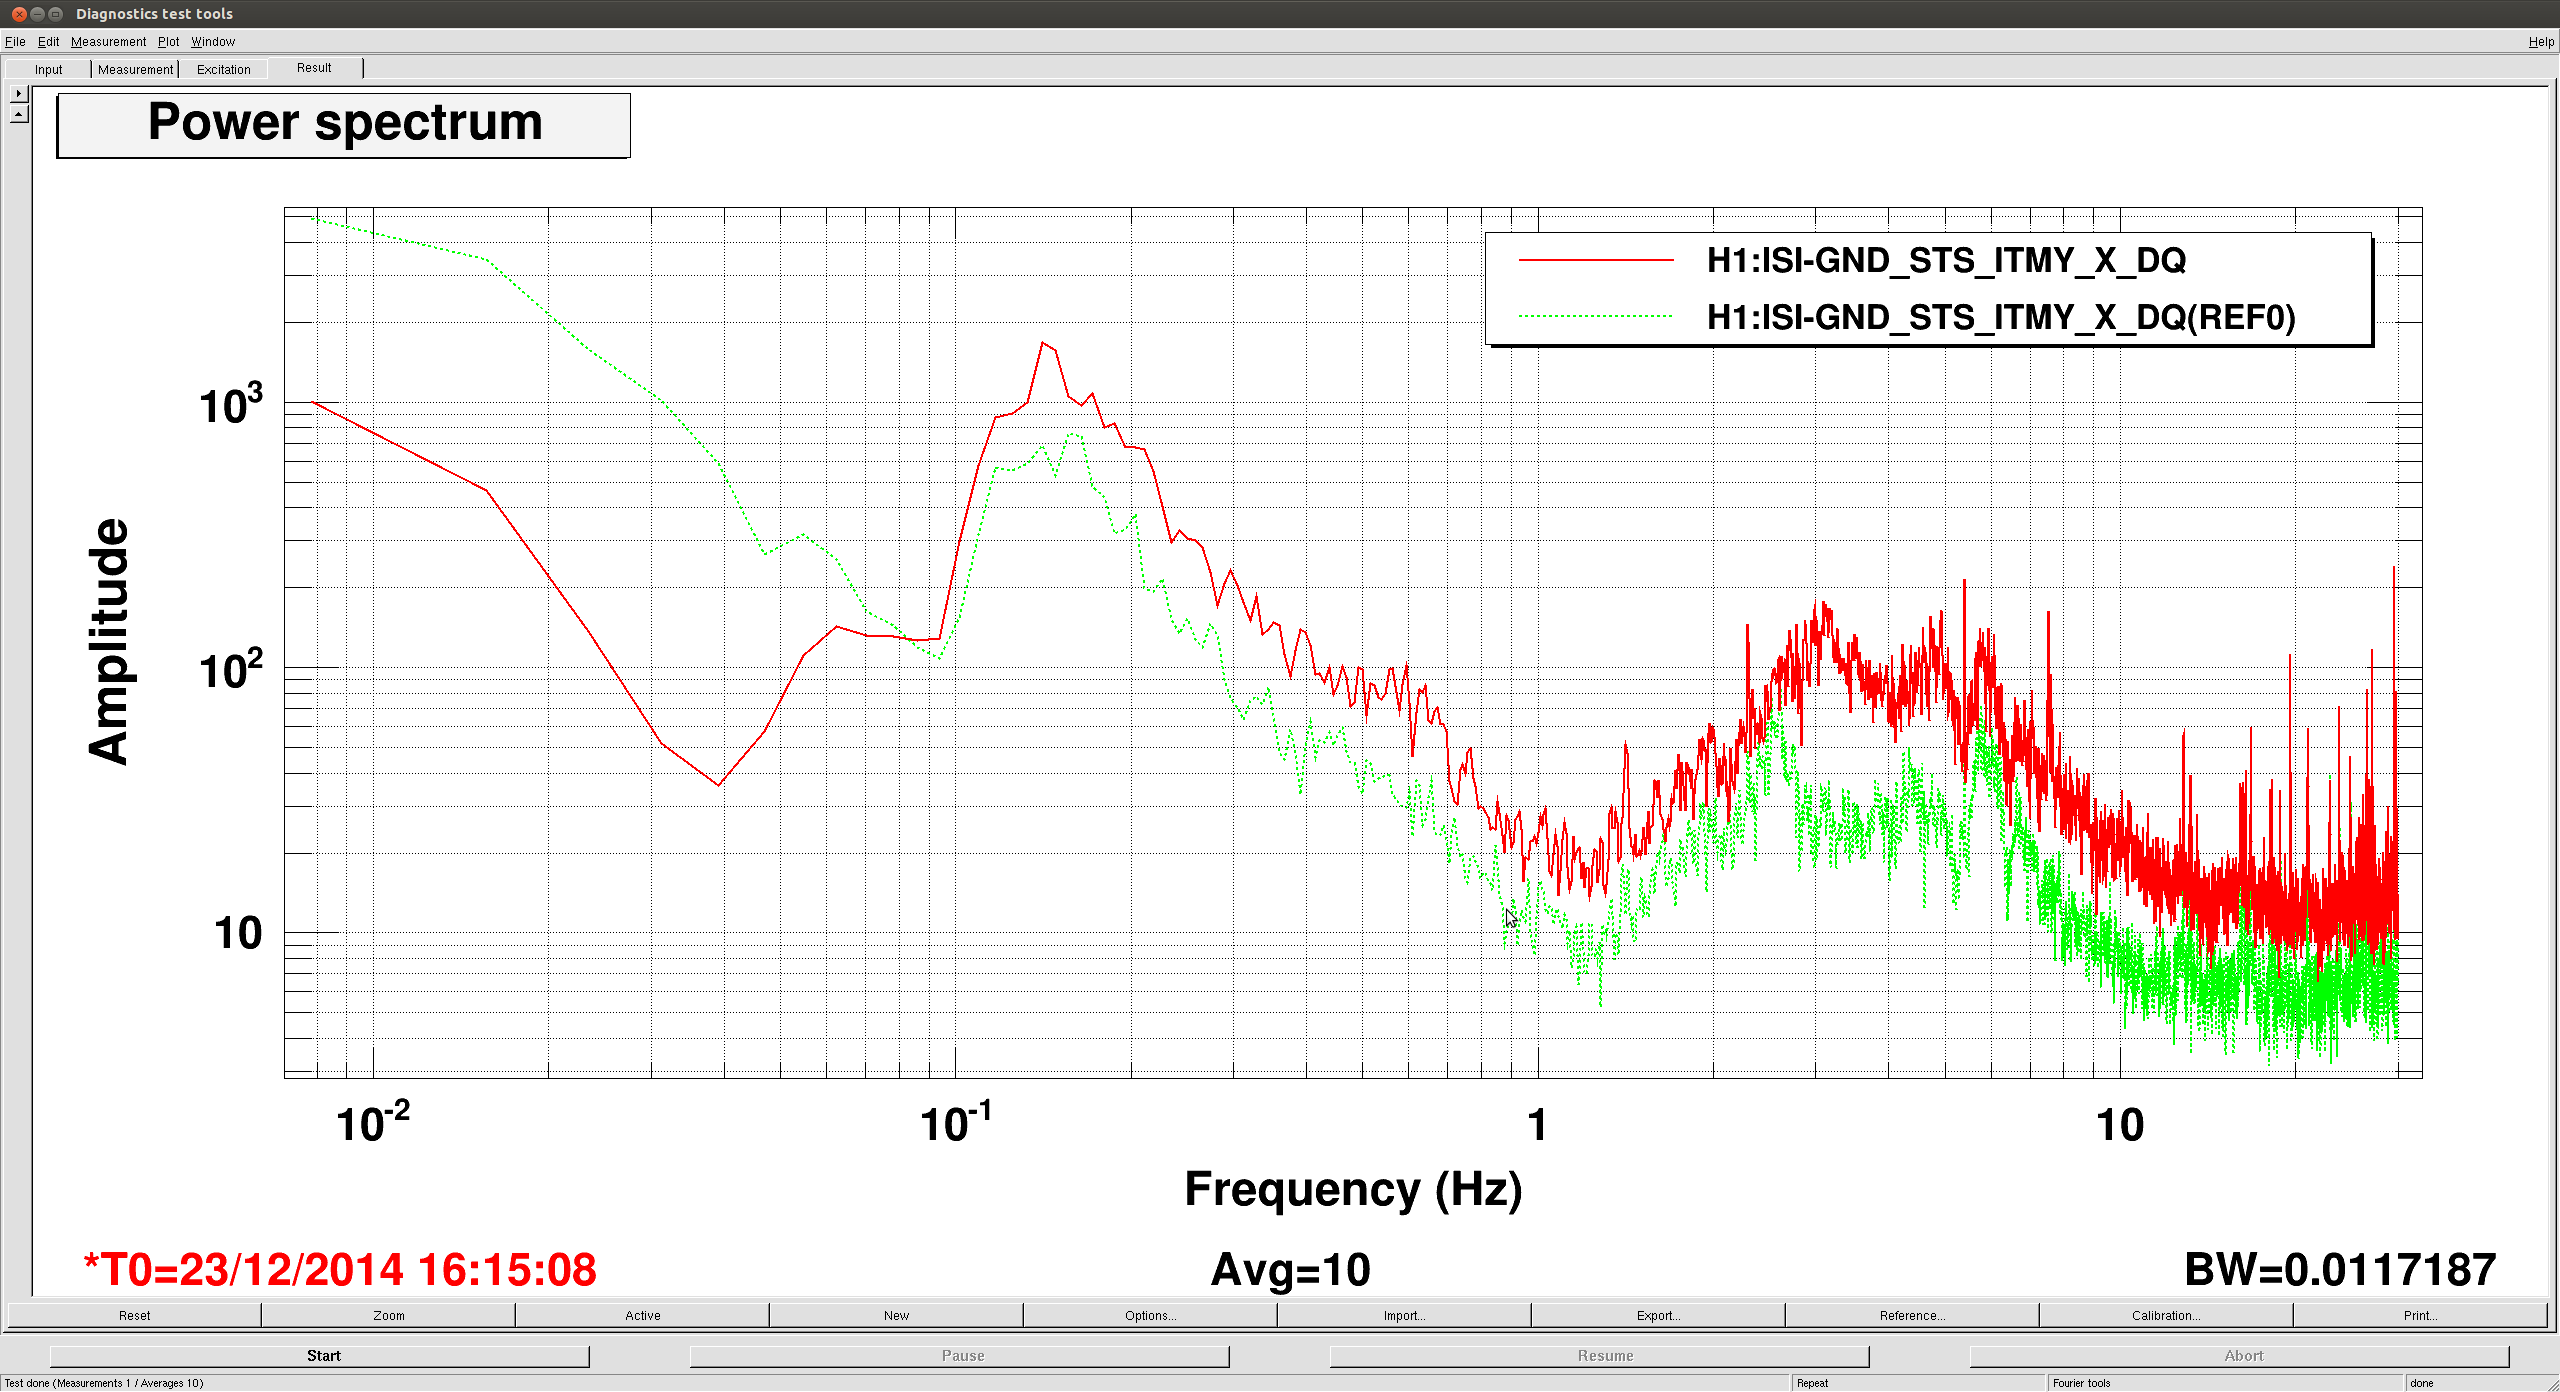
All the measurements using the corner station STS B as input to the sensor correction (ITMX, BS, ITMY) show a factor of two mismatch with the hepi and platform sensors in the X DOF only. There is certainly a calibration error with the STS B seismometer. I checked the calibration filter in the input filter banks and it looks correct (10.17 nm/s /cts). We should investigate more. The other chambers and dofs need a relatively small correction.
The ISI gains (T240/STS for BSCs and GS13/STS for HAMs) are
|
|
X |
Y |
Z |
|
HAM2 |
1.036 |
0.995 |
0.877 |
|
HAM3 |
0.976 |
0.958 |
0.812 |
|
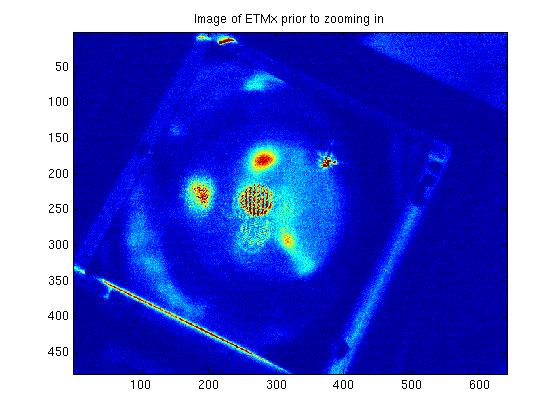
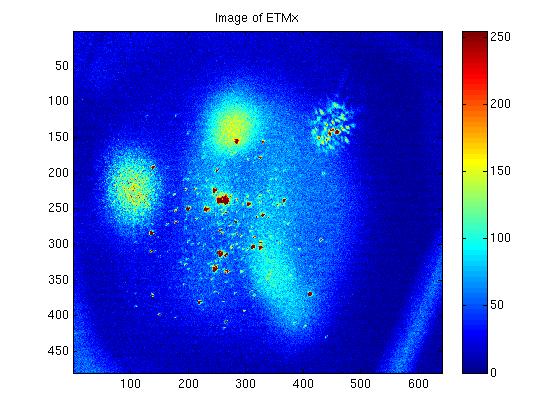
ETMX (T240 for gnd sensor) |
1.114 |
1.106 |
1.105 |
|
ETMY |
0.985 |
0.974 |
0.995 |
|
ITMX |
1.964 |
0.976 |
0.993 |
|
ITMY |
1.982 |
0.984 |
0.993 |
|
BS |
1.99 |
0.986 |
0.994 |
The BSC - HEPI gains (L4C/STS) are
|
|
X |
Y |
Z |
|
ETMX |
1.110 |
1.107 |
1.091 |
|
ETMY |
0.998 |
0.991 |
0.969 |
|
ITMX |
2.167 |
1.063 |
0.972 |
|
ITMY |
2.011 |
1.006 |
0.963 |
|
BS |
2.09 |
1.055 |
0.924 |
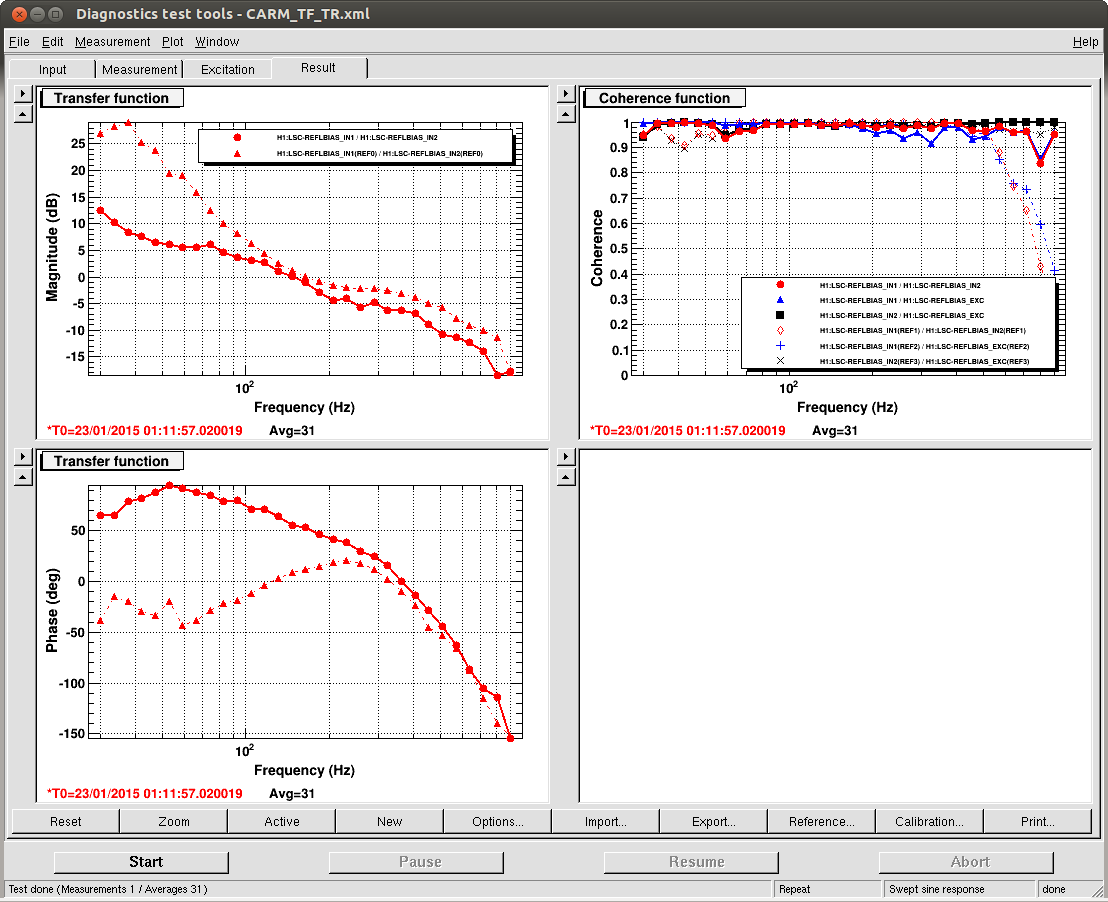
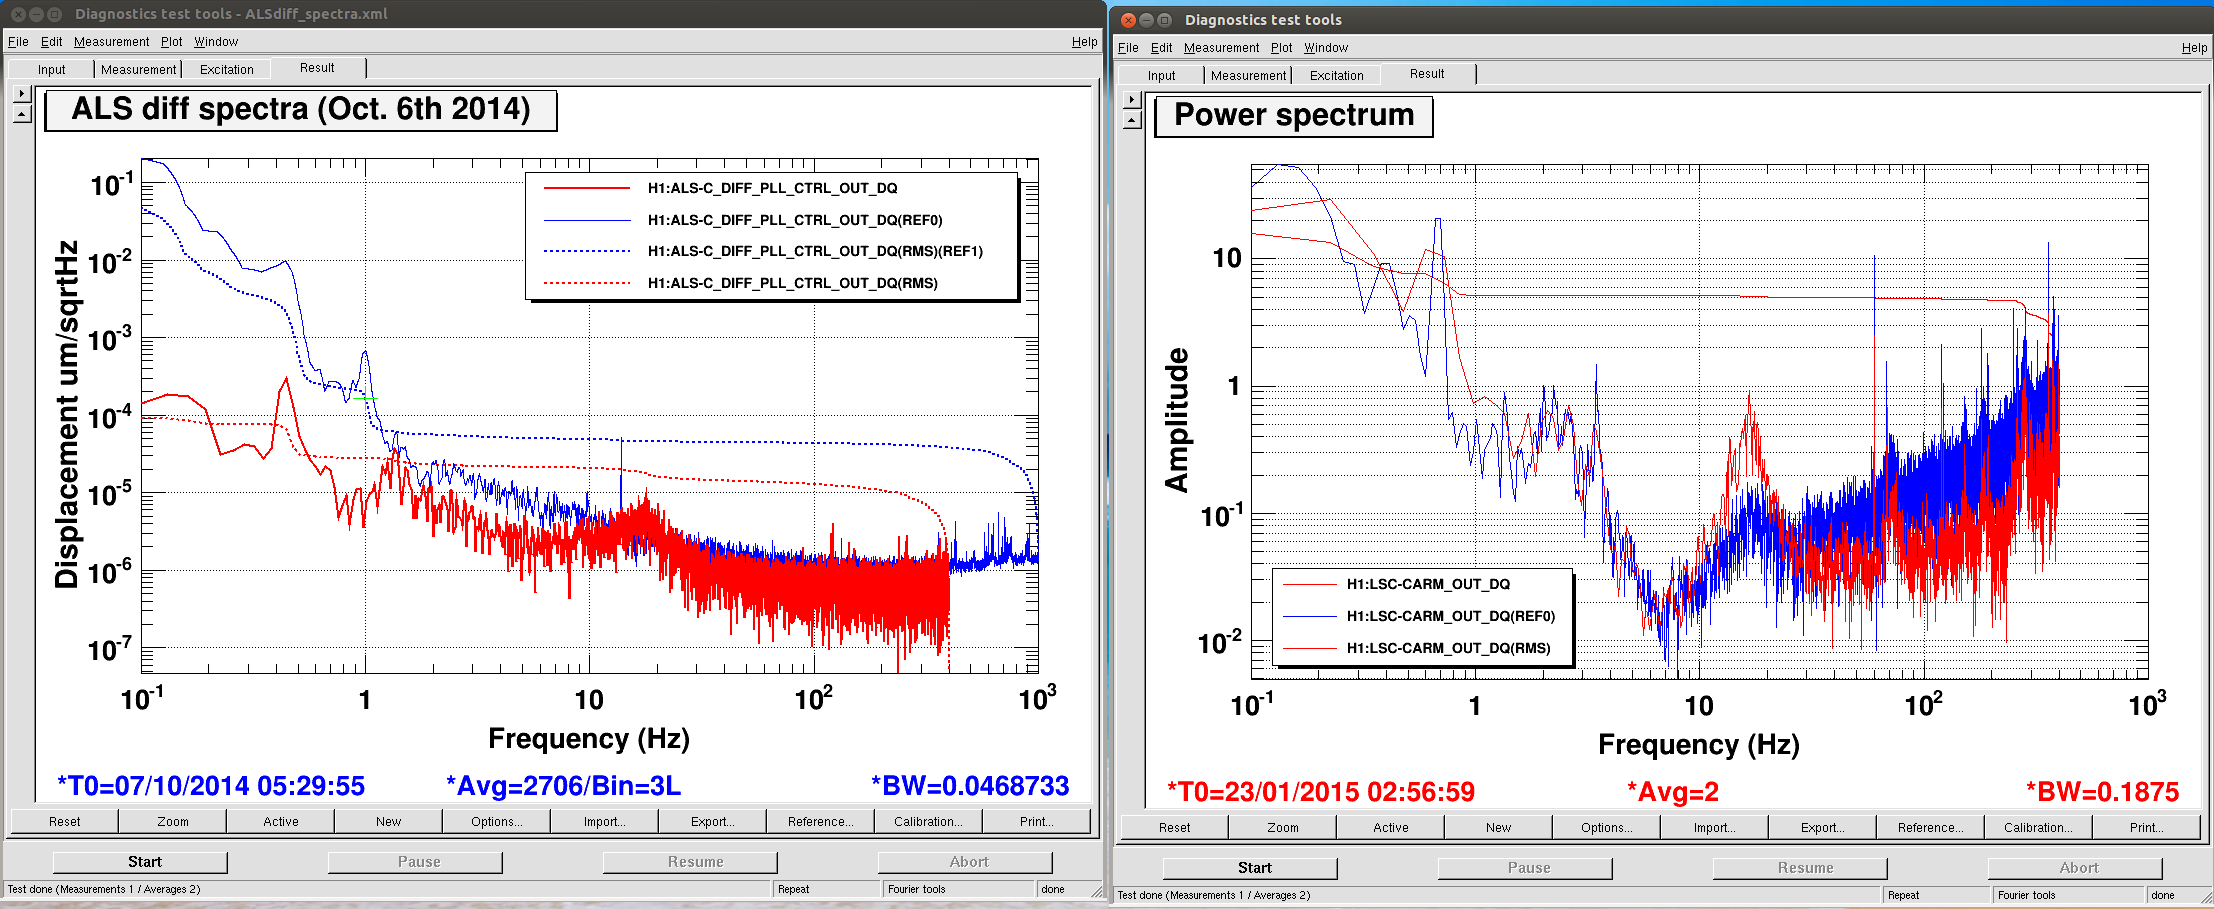
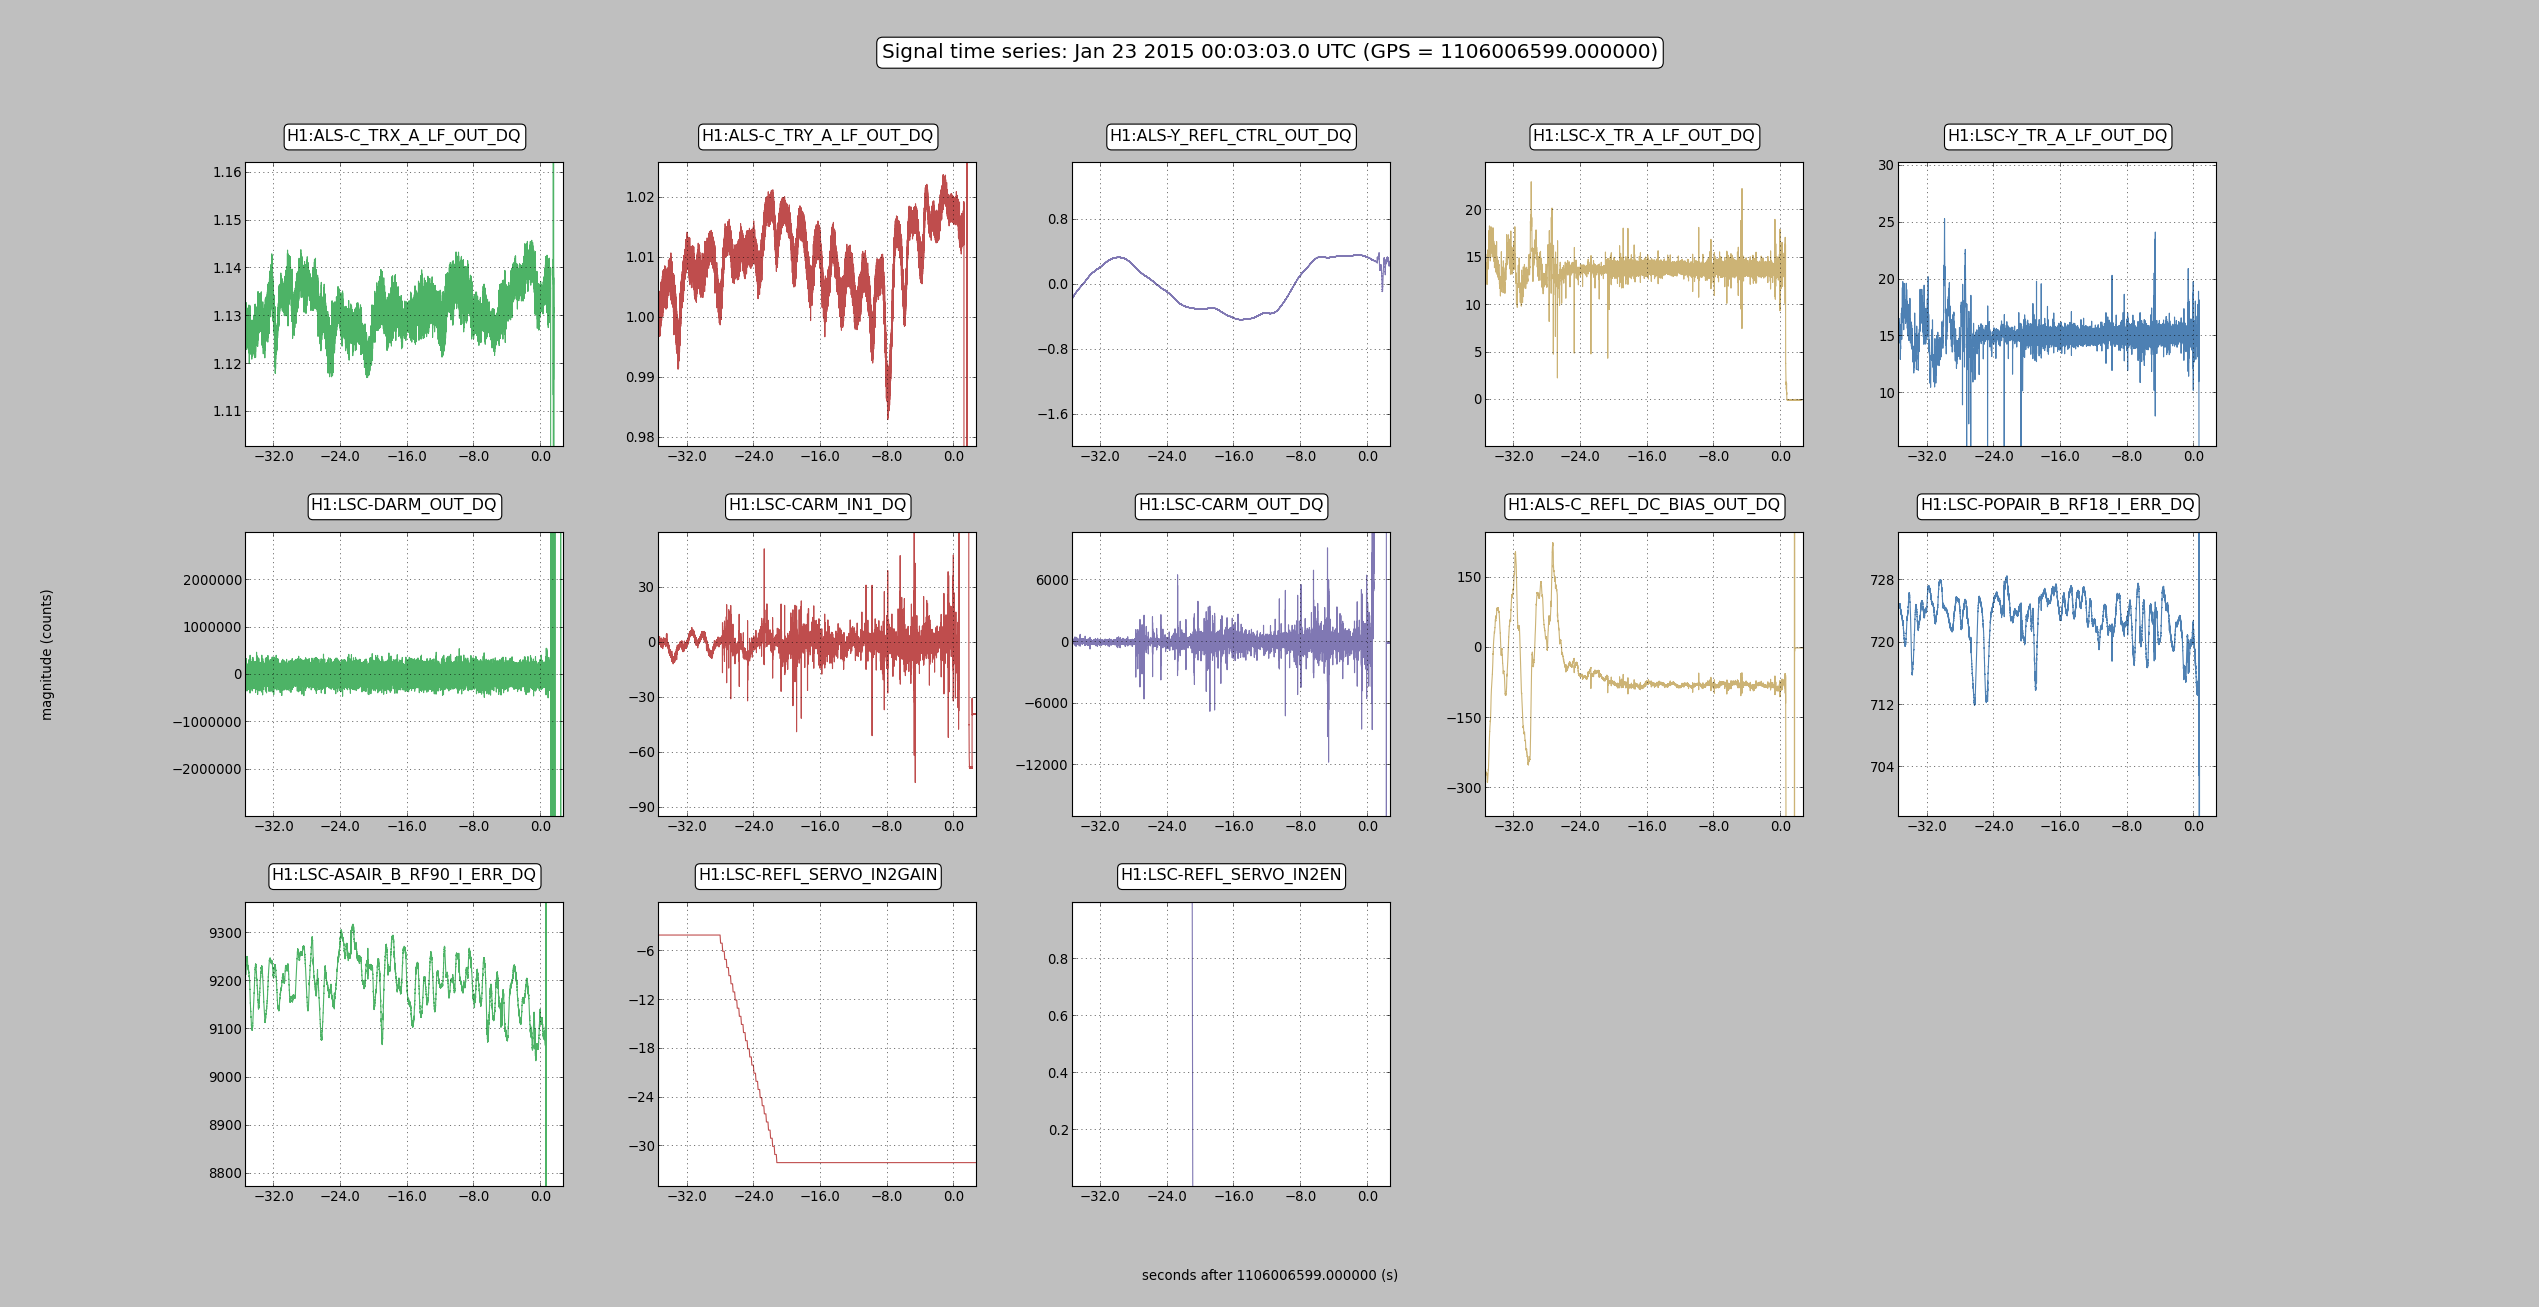
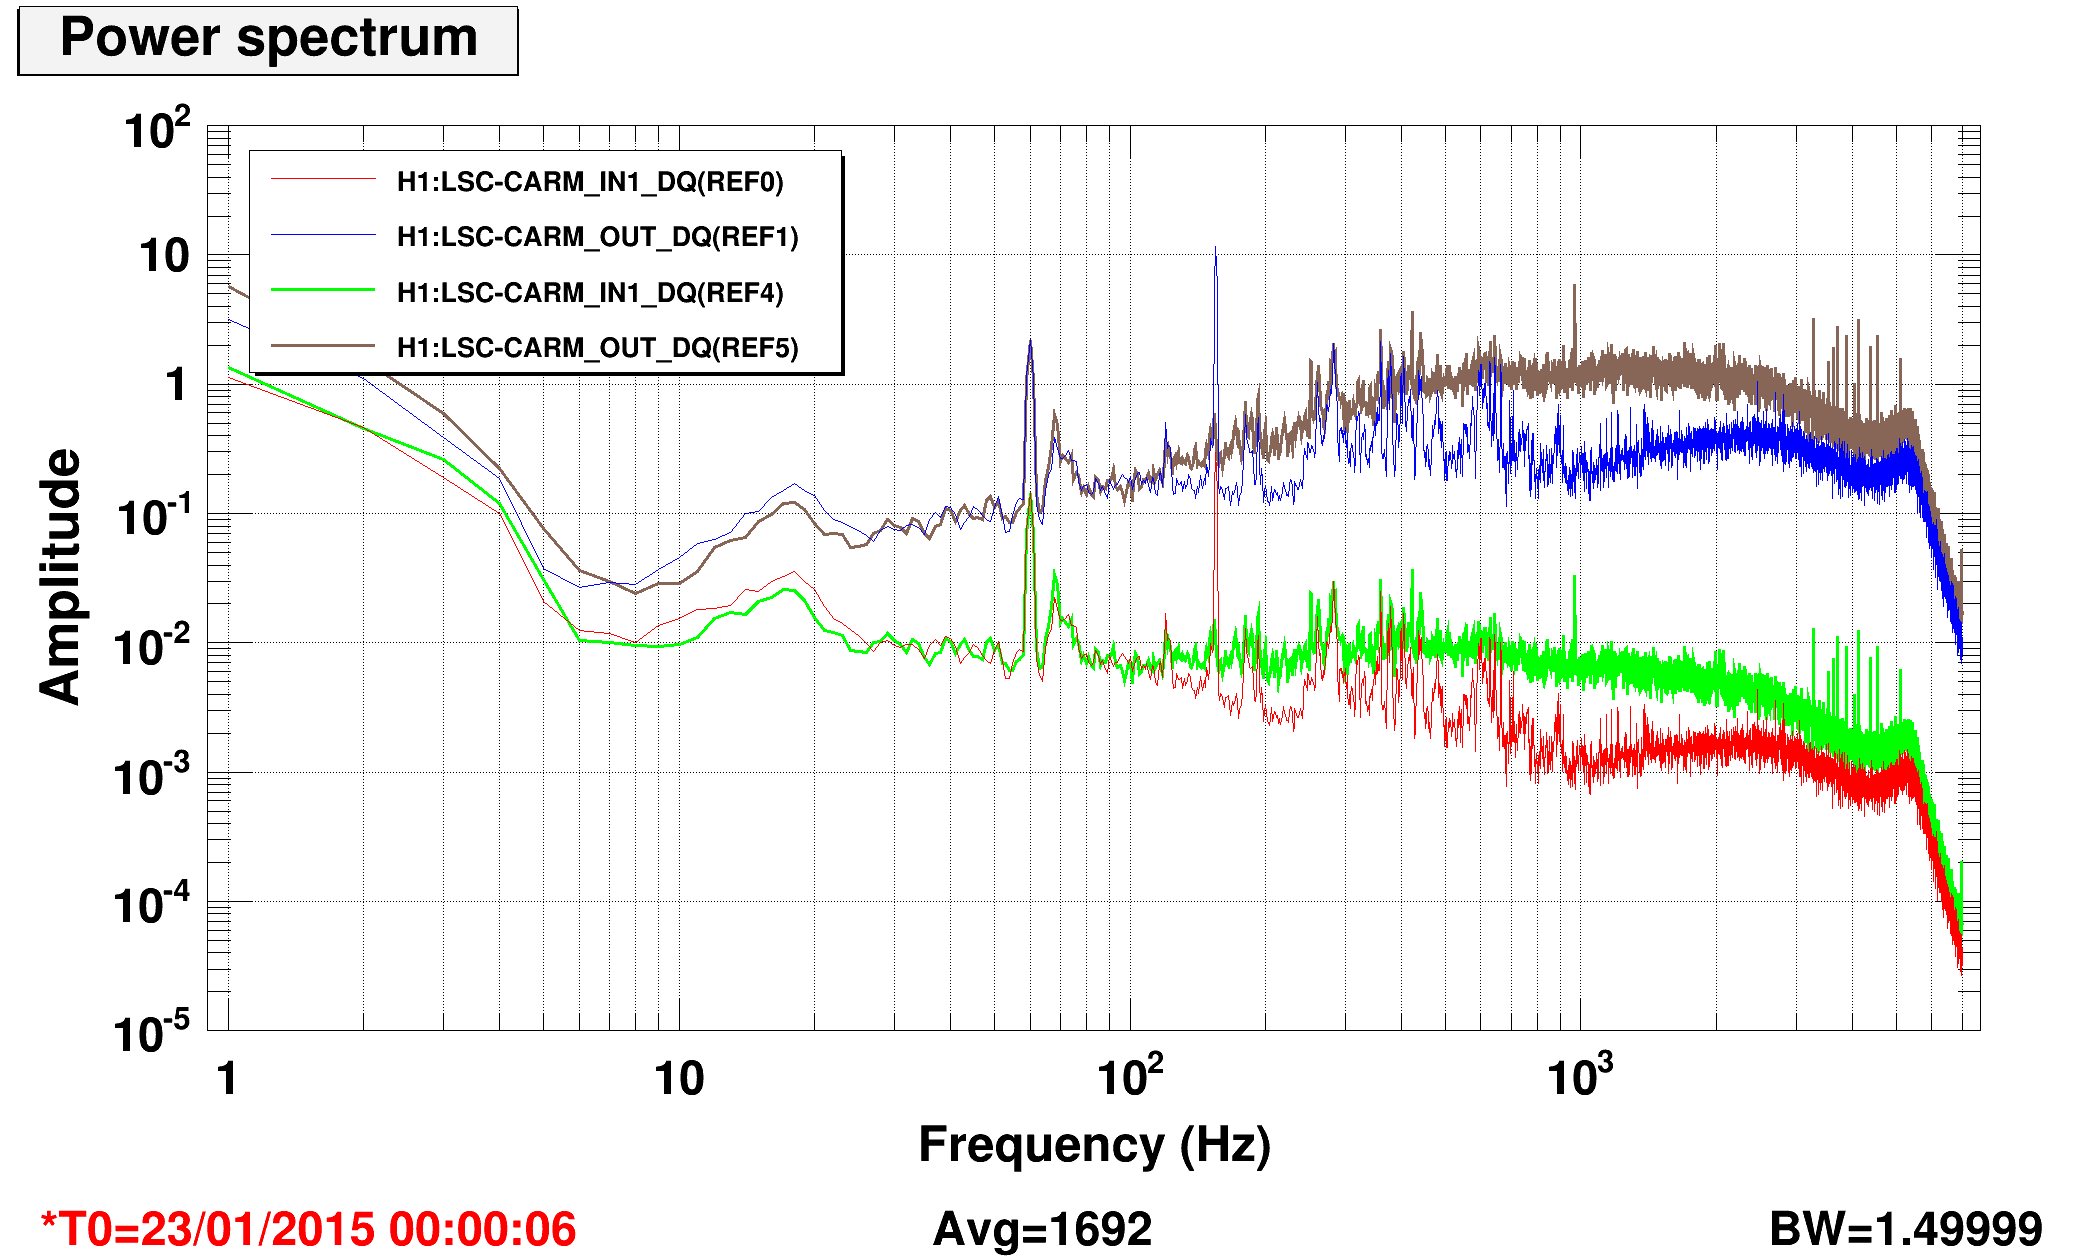
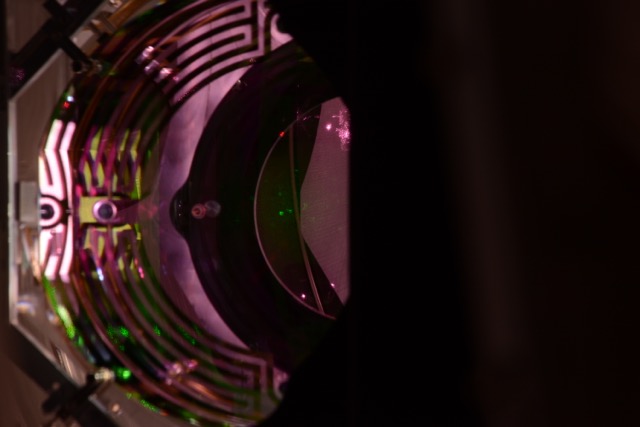
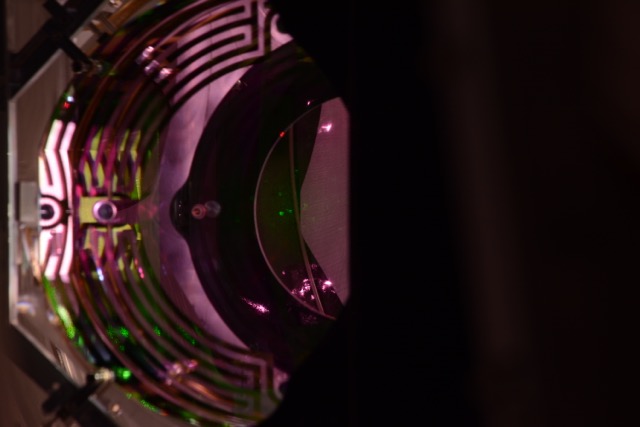
Attached are examples of the transfer functions for ITMY
To calculate the gains I wrote a script for the bscs in a similar fashion as Sebastien's : it is called BSC_gain_matching_calculation(IFO,Chamber,start_time,duration) located under /ligo/svncommon/SeiSVN/seismic/BSC-ISI/Common/Misc. The results above were obtained using the following parameters :
start_time=tconvert('01/22/2015 15:35') ;
duration = 45*60 ;