[Koji Dan]
Summary
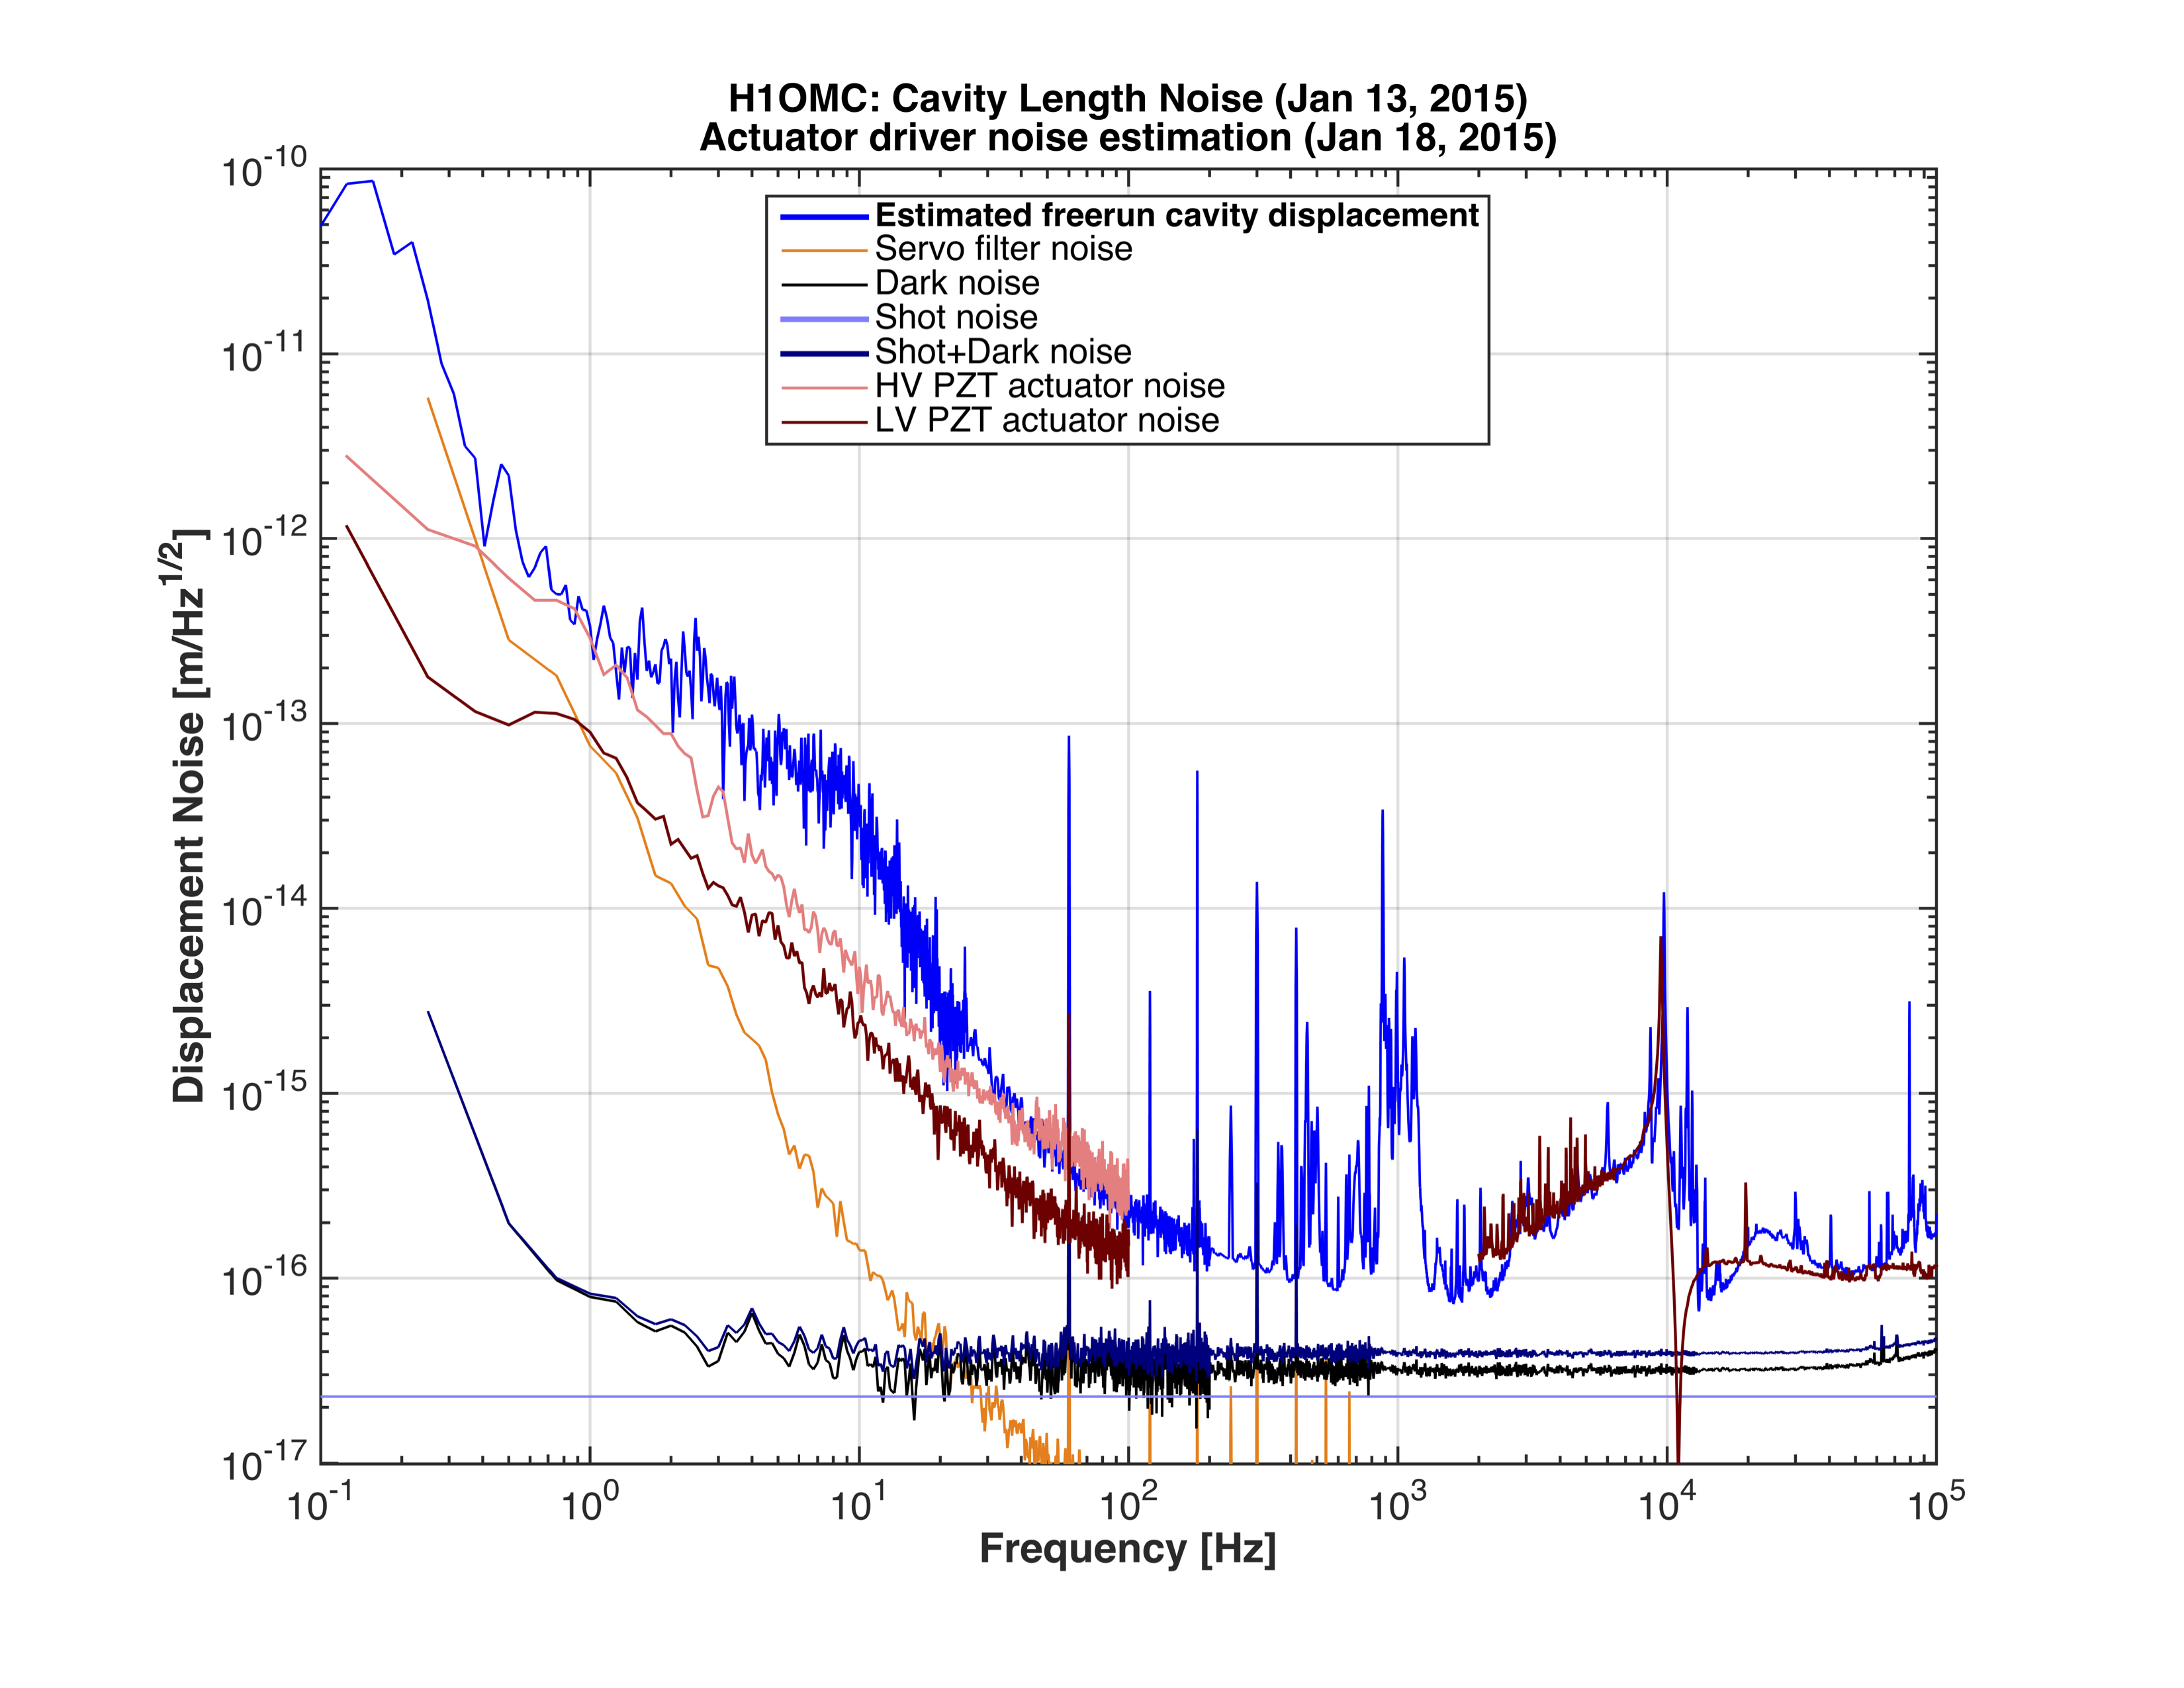
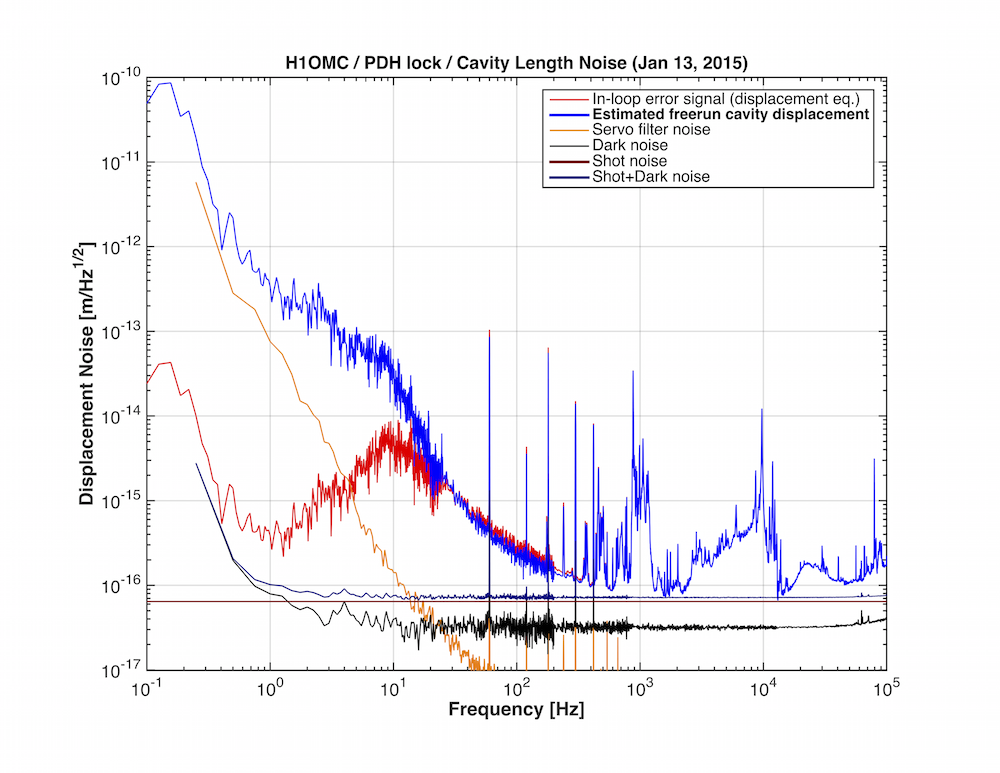
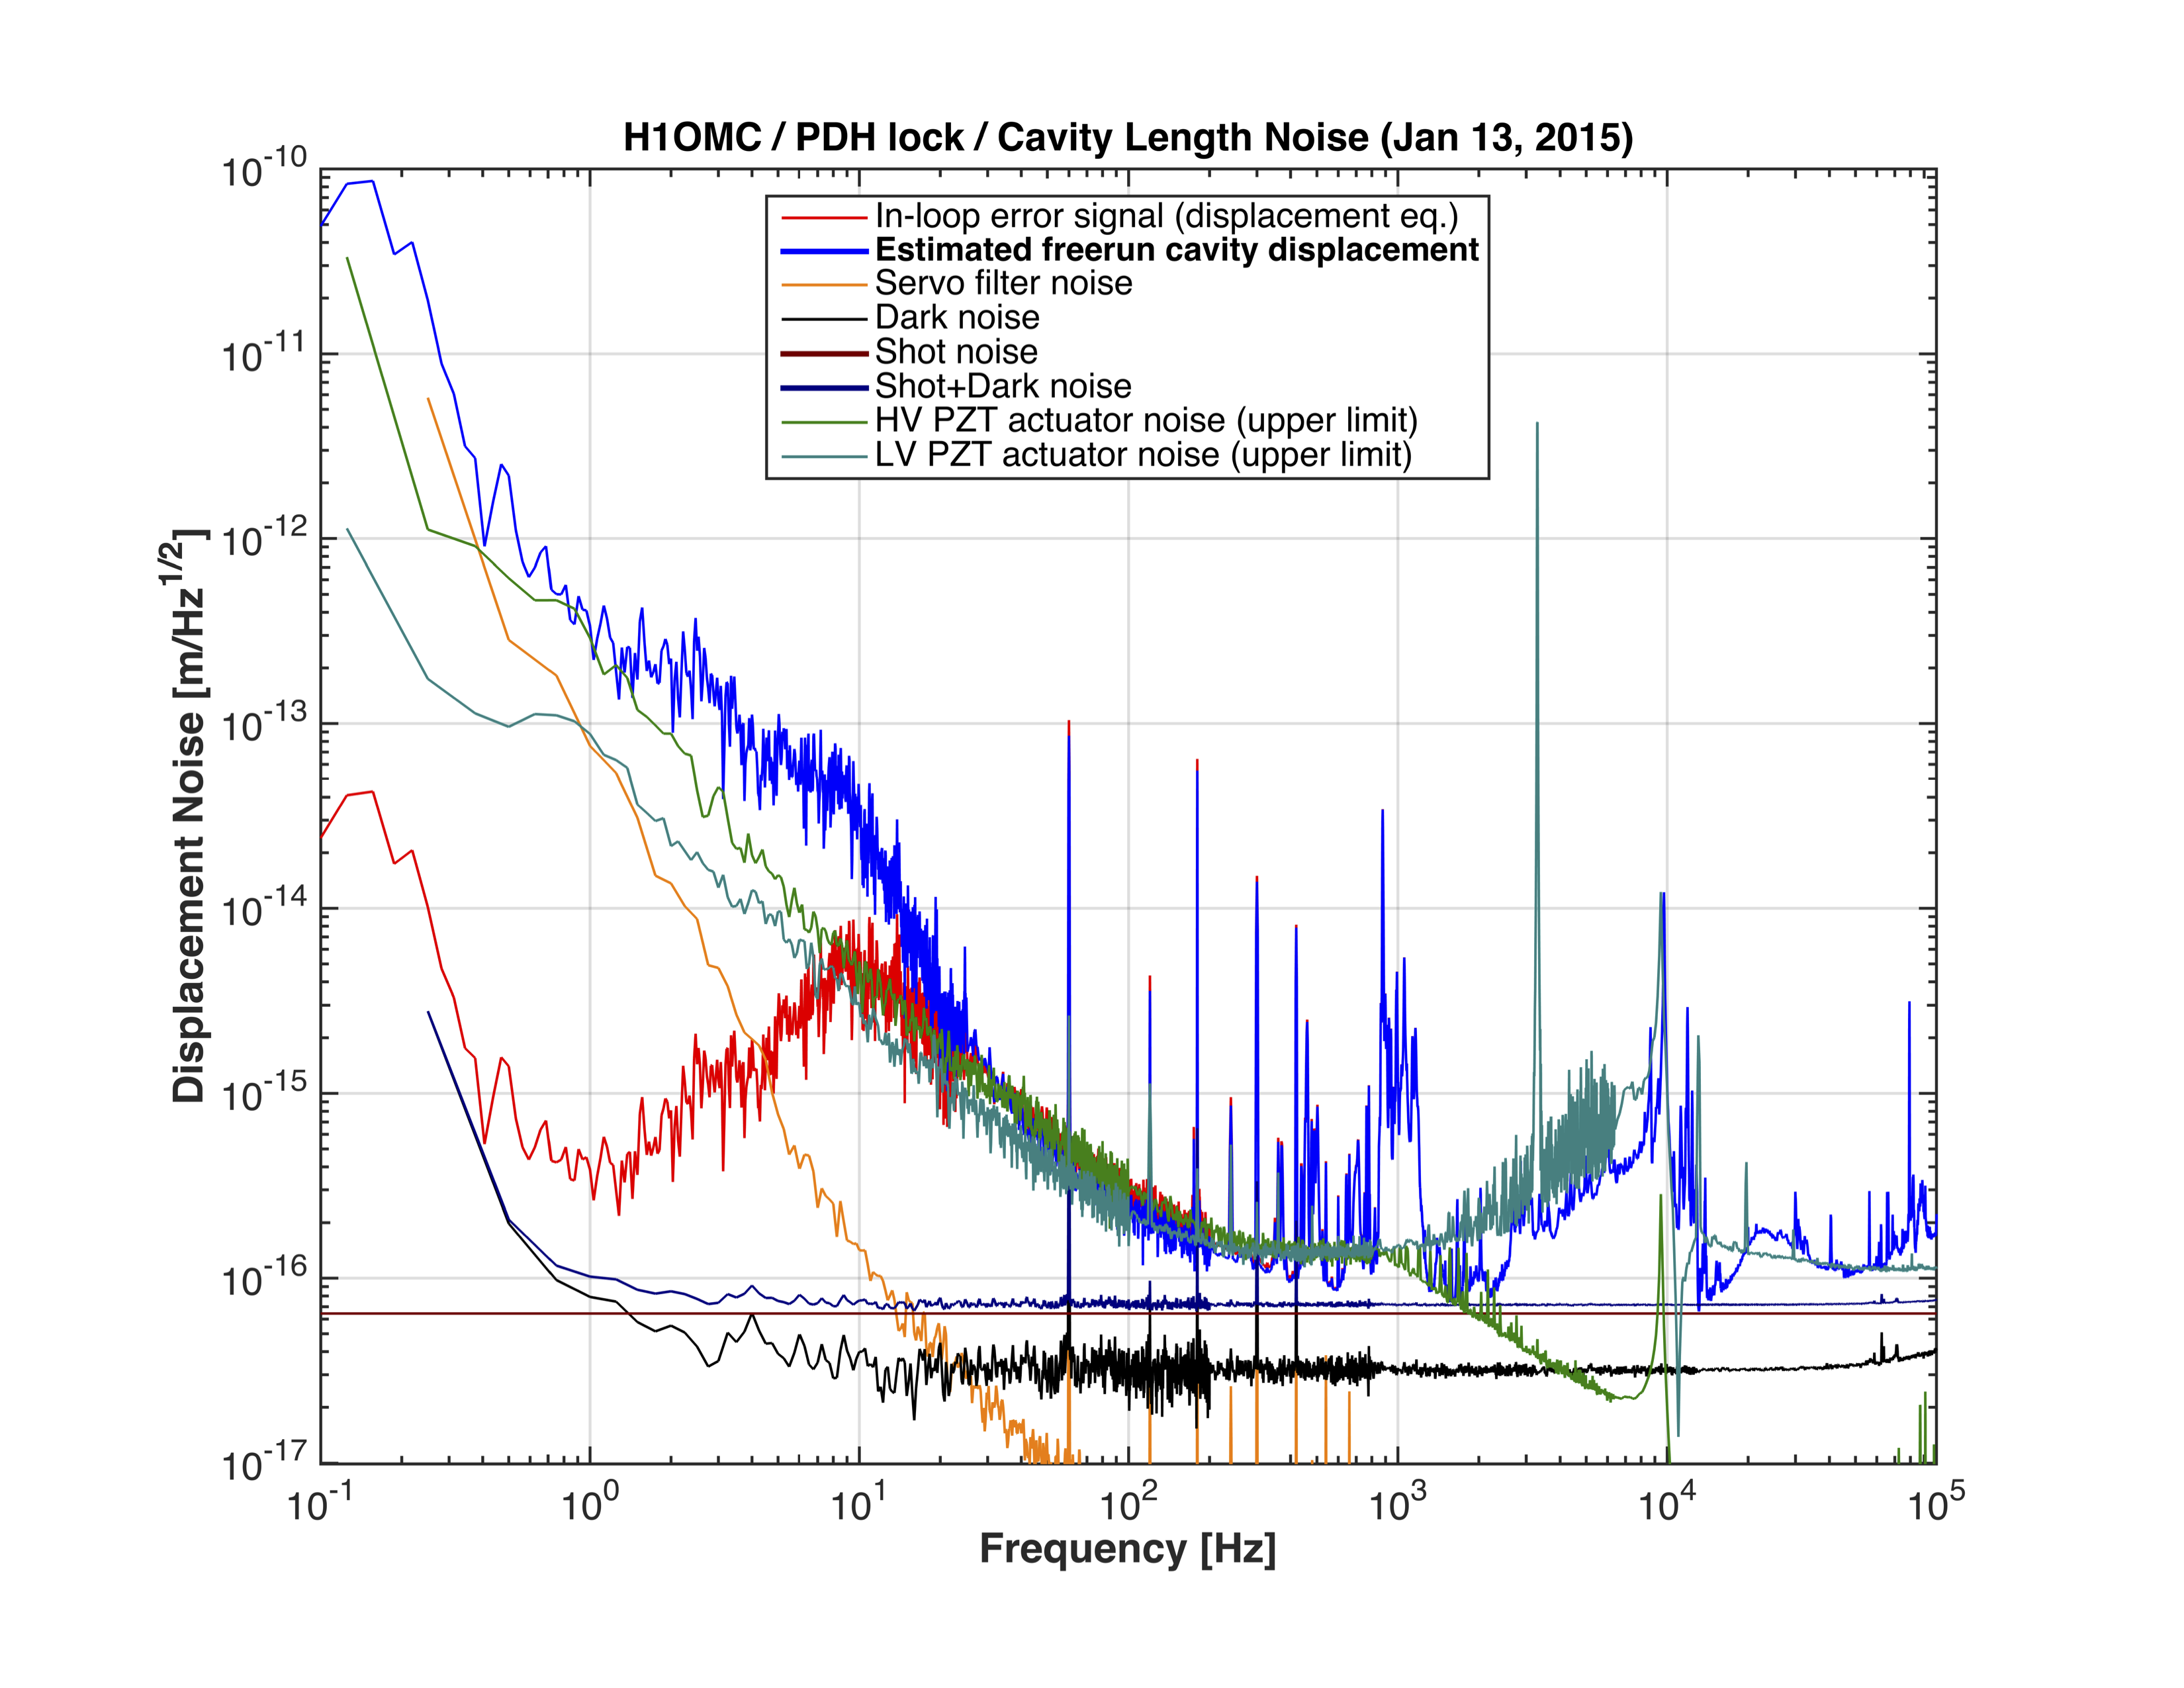
The estimated displacement noise of the OMC cavity due to the actuator noise is shown in Attachment 1
-
From 0.3Hz to 1Hz, and from 30Hz to 100Hz, the HV PZT noise is likely to limit the OMC cavity length noise.
-
Above 20kHz, the LV PZT noise is likely to limit the OMC cavity length noise. Particularly, the driver noise is exciting the OMC PZT prism parasitic resonance at ~10kHz.
-
In other frequency, it is hard to declare anything definitive as the PZT noise measuements were dominated by readout noises.
Motivation
There was a suspicion that the OMC PZT driver noise was limiting the OMC cavity length noise. (LHO ALOG 16089). In the previous measurement, the output monitor ports for the HV and LV PZT drive were used. However, it was highly likely that the readout noise levels of these monitor ports are not low enough to measure quiscent noise levels of the PZT drivers. Therefore we wanted to try direct measurements of the LV and HV PZT driver noises at the output of the PZT drivers.
Method
First of all, the HV power supply of the OMC PZT driver was turned down from 100V to 10V in oder to insure our safety. Of couse, this is not an ideal condition in terms of the proper noise measurement. However this should not be a problem, in principle, as the noise of the final HV stage should be limited by the OP27 at the input stage of this section. (The HV amp section of this board has cascaded amps in a single feedback circuit.)
A DB25 breakout board was inserted between the driver rack unit and the output cable to the vacuum feedthrough.
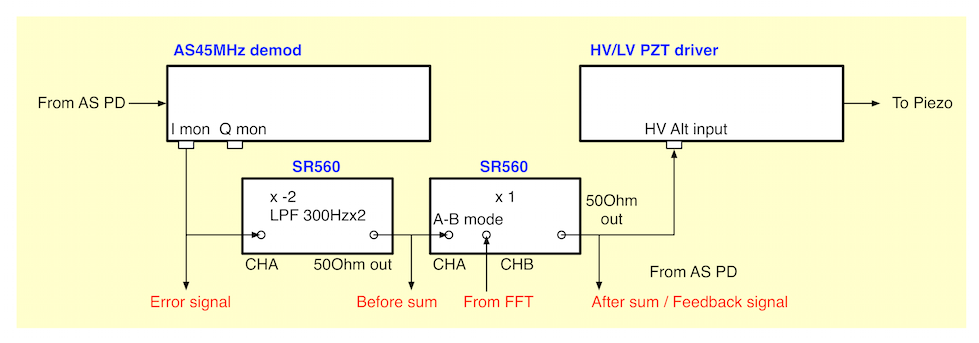
Pomona grabber clips were attached at the pins across each PZT electrodes. The voltage was fed to an AC coupled SR560 with a gain of 100 and HPF with fc at 3Hz (6dB/Oct).
After the measurement, the breakout board was removed, the cable was restored, and the HV power supply was reverted from 10V to 100V.
HV driver results
Here the result includes the explanation including the measurement of the monitor outputs.
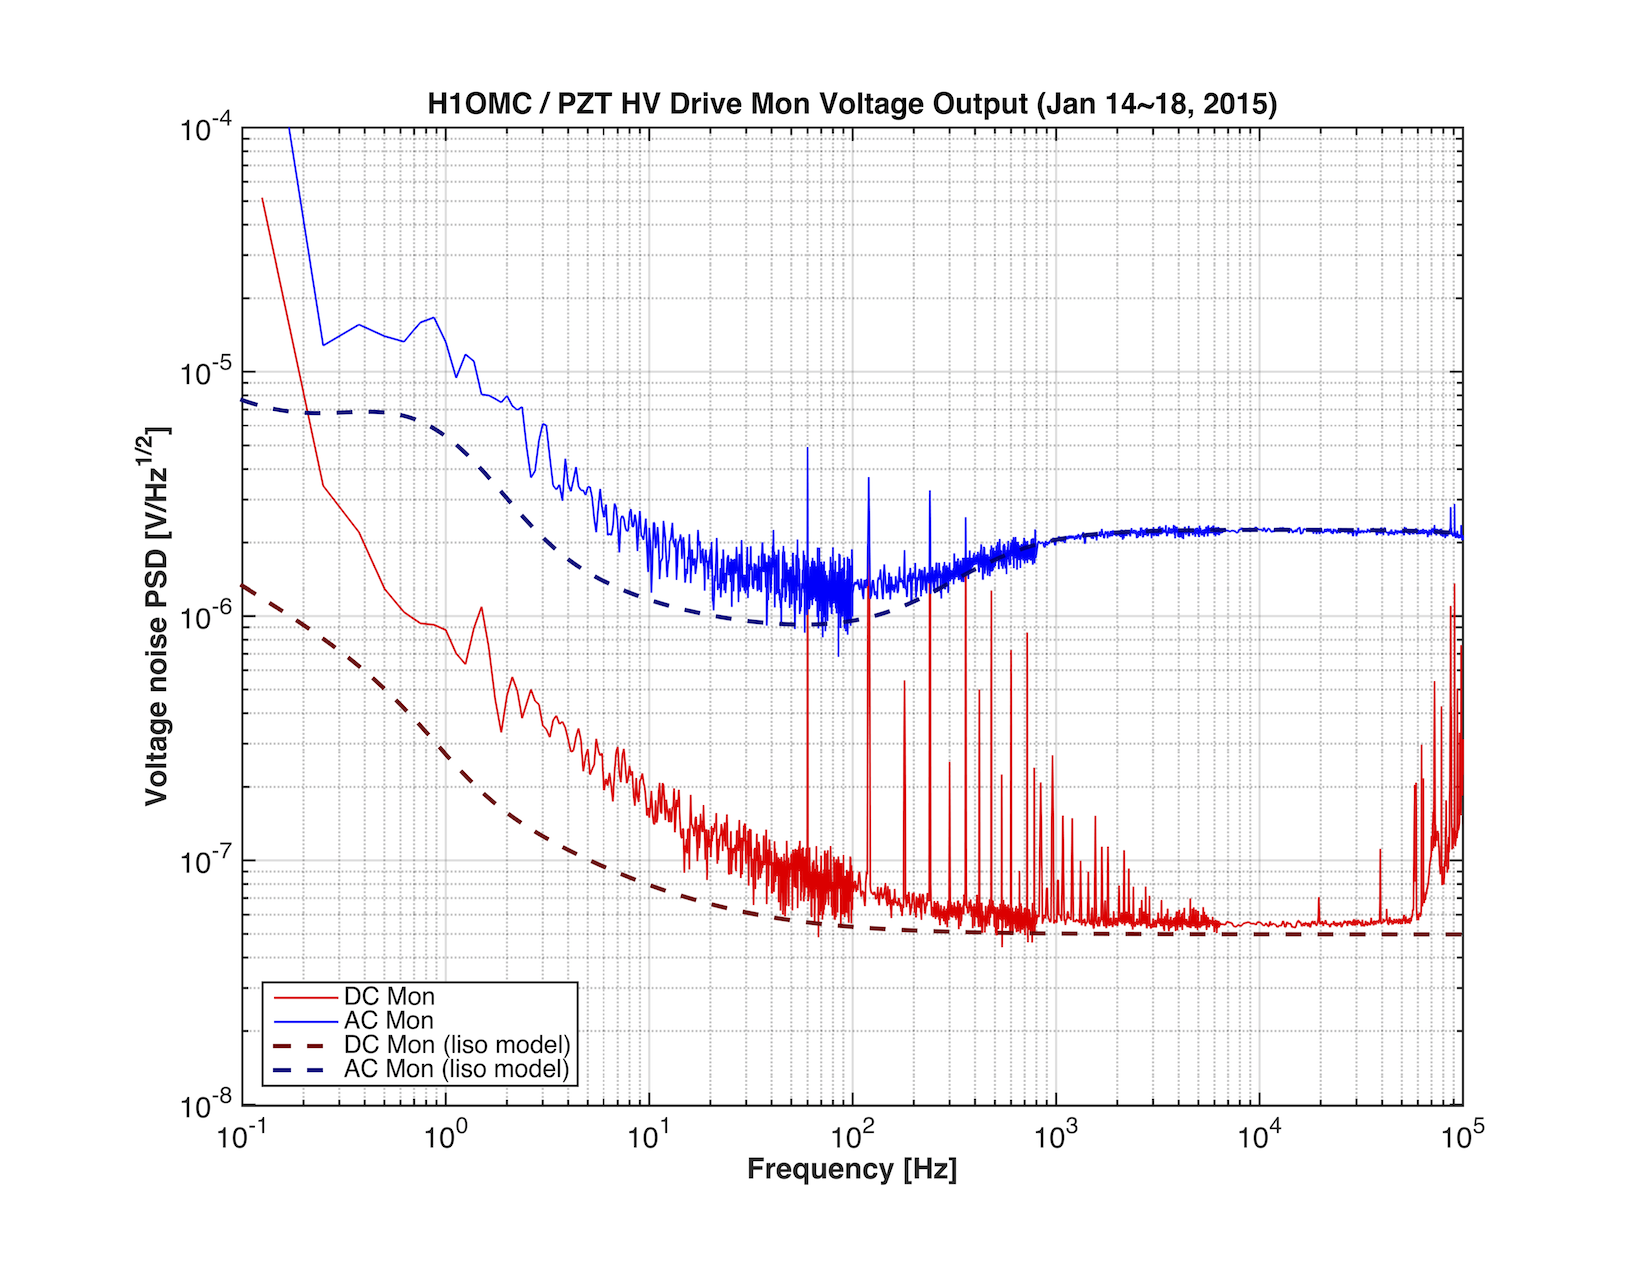
1. Evaluation of the AC/DC mon outputs (Attachment 2)
The raw output noise levels of the AC/DC monitor were compared with the readout circuit noise model by LISO. Basically this plot indicates that the outputs are limited by the noise of the readout circuit above 100Hz. Below 100Hz, it looks the measure noise levels are above the modeled noise levels. The difference is too small to declare the measure noise level is the true indication of the PZT noise.
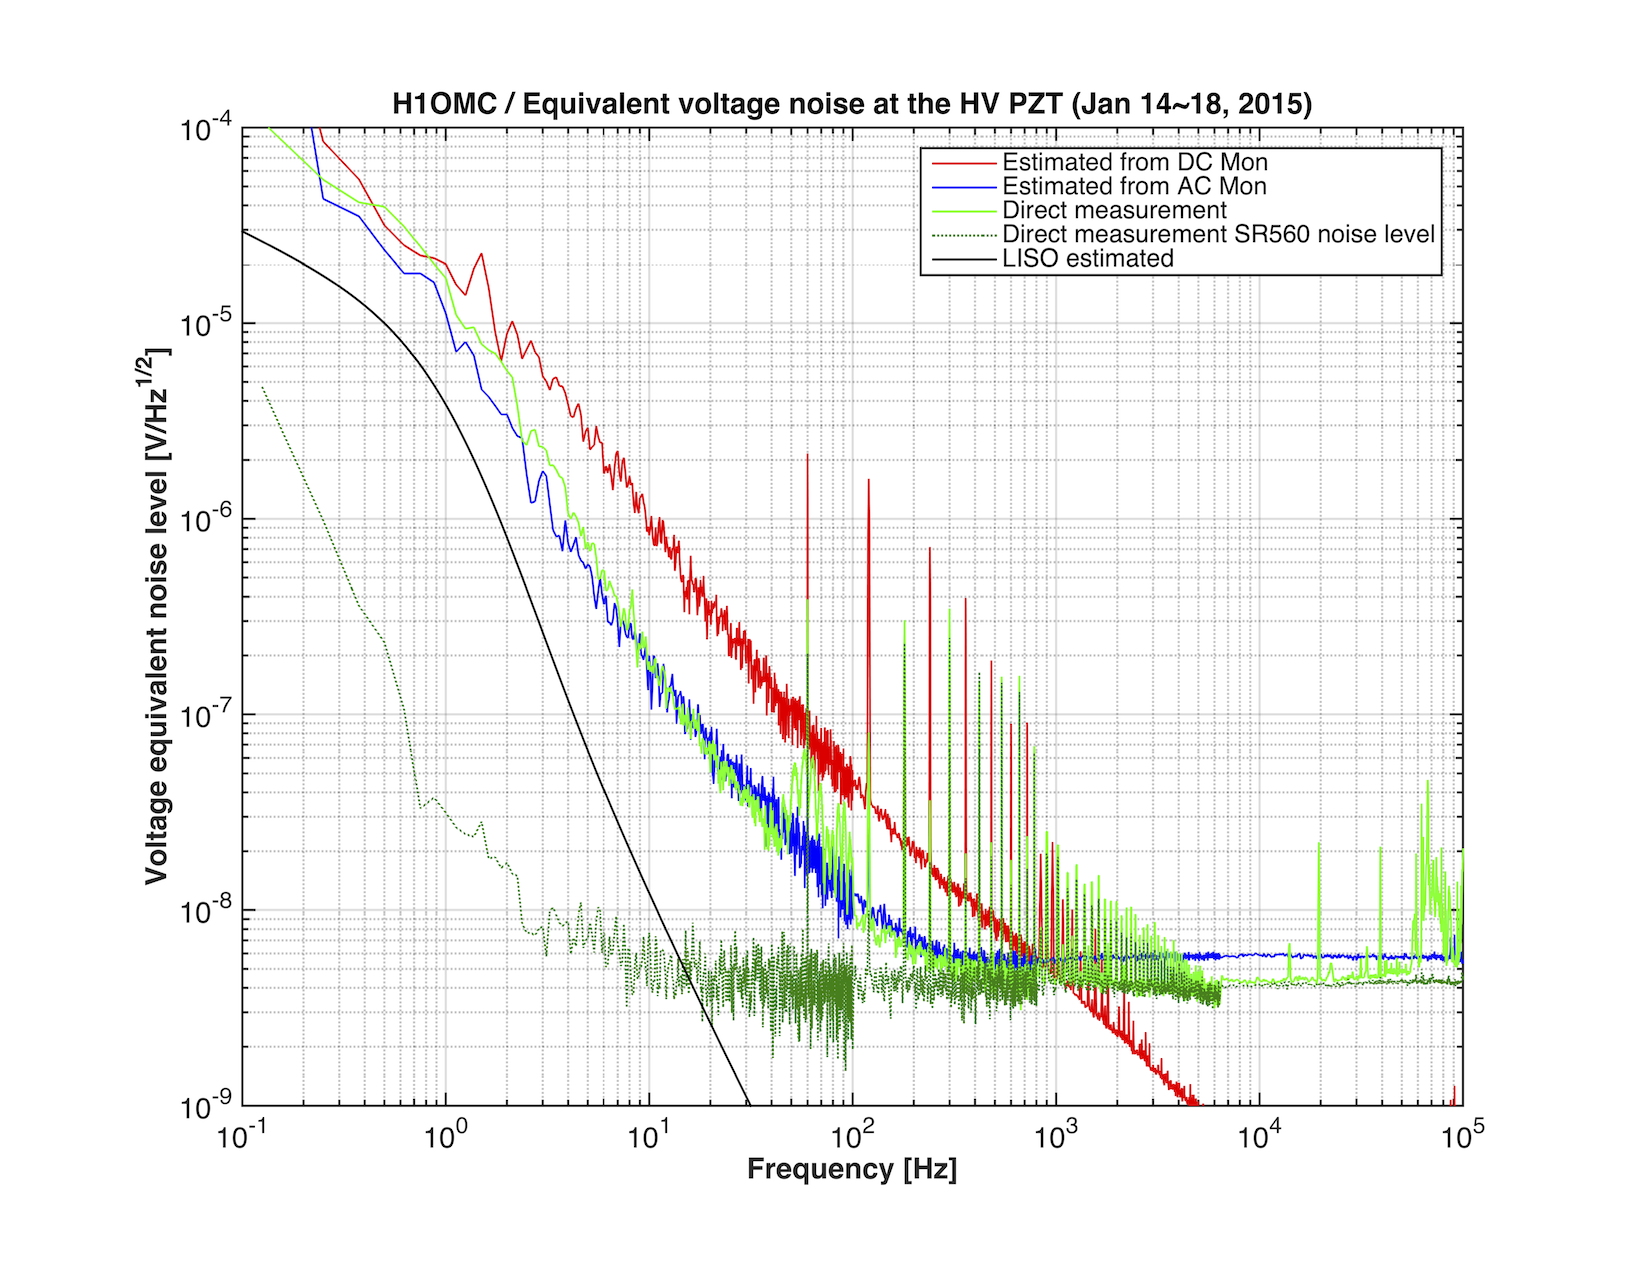
2. Direct measurement (Attachment 3)
The noise levels across the HV PZT (green) was shown in the figure. Here AC/DC Mon measured voltage noise levels were converted to the equvalent output voltage for comparison.
The noise level of this measurement (indicated by a dark green dotted curve) was 4nV/rtHz down to 10Hz, which was as indicated in the SR560 spec. So this noise level is quite reliable. We can declare that the measurement below 100Hz indicates the actual voltage noise across the PZT. Otherwise, the minumum of all three measurement at each frequency above 100Hz should be taken as an upper limit.
The black curve in the plot is the modeled noise by LISO. The measued noise was consistently higher than the model. The reason of the descripancy is not known.
In the first plot, the noise level from the direct measurement was plotted below 100Hz after converting it to the displacement of the cavity.
LV driver results
Here the result includes the explanation including the measurement of the monitor outputs.
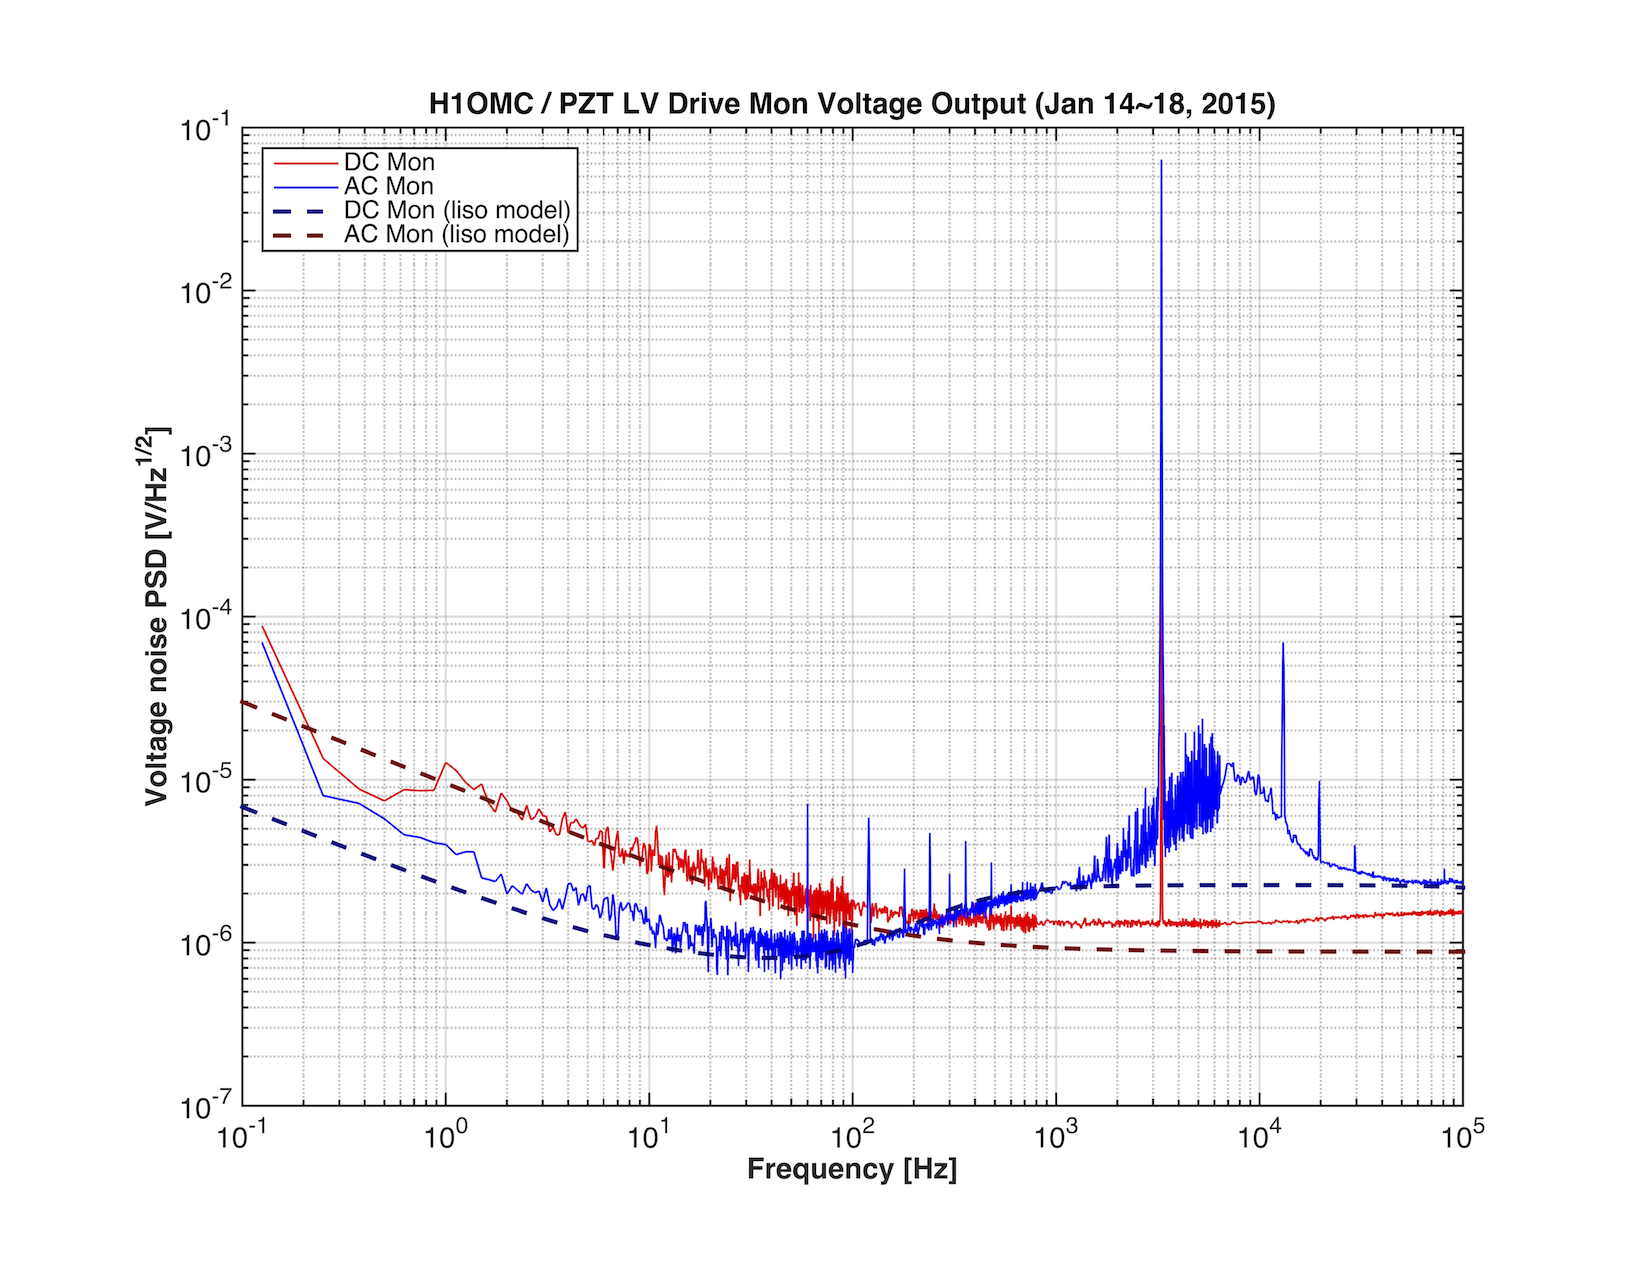
1. Evaluation of the AC/DC mon outputs (Attachment 4)
The raw output noise levels of the AC/DC monitor were compared with the readout circuit noise model by LISO. The circuit noise dominates the outputs except for the AC Mon between 2kHz and 20lHz.
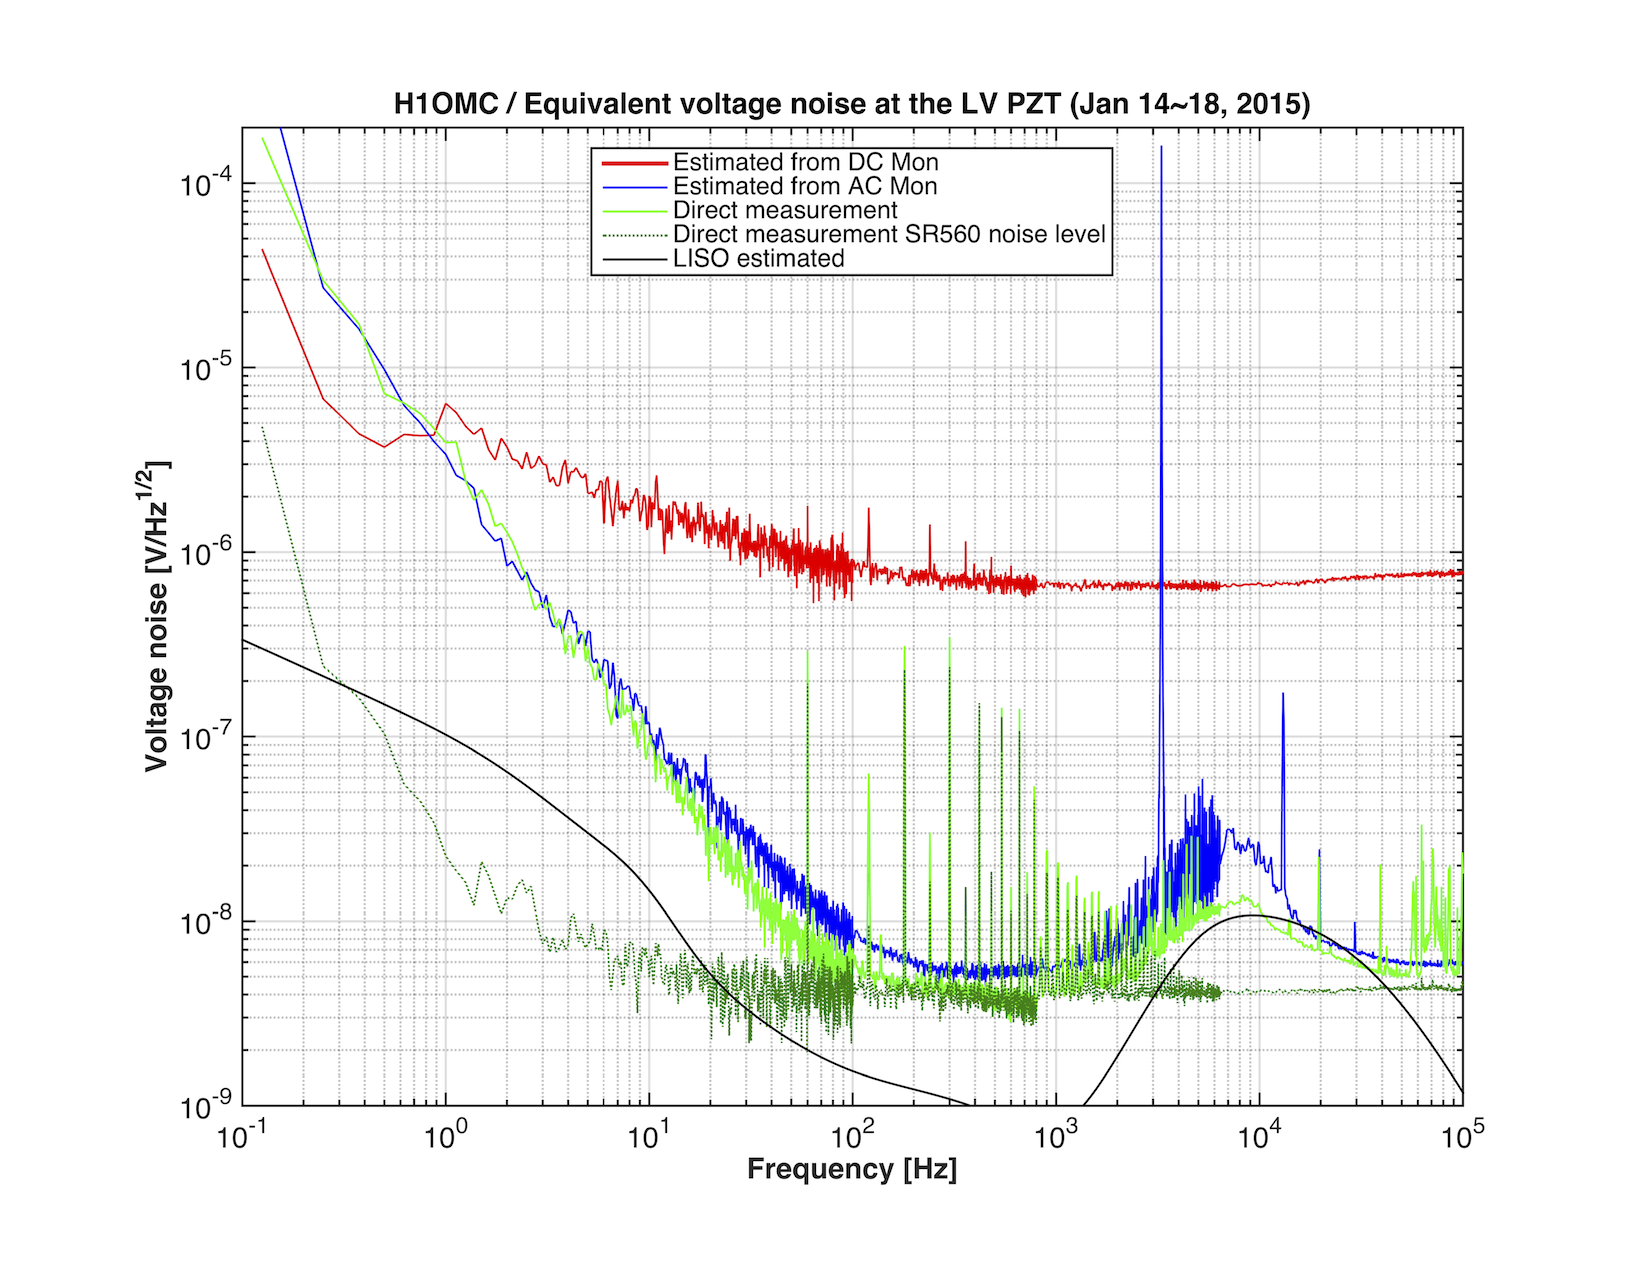
2. Direct measurement (Attachment 5)
The direct measurement indicates better noise level than the result of the AC monitor in all frequency. The direct measurement has clear gap from the measurement noise level below 100Hz and above 2kHz. So the measurement is reliable in these bands, and otherwise the level is an upper limit.
The black curve in the plot is the modeled noise by LISO. The measued noise was consistently higher than the model. The reason of the descripancy is not known. 20KHz.
In the first plot, the noise level from the direct measurement was plotted below 100Hz after converting it to the displacement of the cavity.