Displaying reports 71981-72000 of 83038.Go to page Start 3596 3597 3598 3599 3600 3601 3602 3603 3604 End
Reports until 17:21, Wednesday 16 April 2014
LHO VE
kyle.ryan@LIGO.ORG - posted 17:21, Wednesday 16 April 2014 (11396)
"Full Try-cock" line clogged at CP5 LN2 dewar
Praxair drivers had noted this on previous occasions -> I installed a 3/8-1/4 tube adapter to the line and briefly applied 40psi of helium (only because it was "handy") and cleared the line out -> seems to be working fine now
H1 AOS (TCS)
david.hosken@LIGO.ORG - posted 17:08, Wednesday 16 April 2014 (11395)
TCS Signet 2537 paddlewheel flow sensor settings
DavidH/Greg

The calibration factors for the TCSX and TCSY paddlewheel flow sensors were adjusted so that their digital displays matched the measured flow rates for the in-line flow meters. Each chiller operated at ~60psi, while a flow rate of ~3.5GPM was displayed.

Initially a K-factor value of 335.000 was used, given the molded Tee fitting that houses the sensor. This resulted in the digital display to read high.
 
The flow sensor settings can be changed by using the menu function on the sensor itself. The following settings are now being used, and are the same both TCSX AND TCSY.

Model 2537 4 to 20mA Output
Flow Unit = Gallons per min (G/m)
K-Factor (PULSES per VOLUME UNIT) = 385.000
Average = 0 seconds(Default factory setting)
Sensitivity = 0 (Default factory setting)
4 Set (Set flow RATE to be represented by 4 mA) = 0.0000
20 Set (Set flow RATE to be represented by 20 mA) = 10.000
Contrast (Adjust visibility of liquid crystal display) = 3

Sample displays for the paddlewheel sensor/inline flow meter after this adjustment to the K-factor are attached.  
Images attached to this report
H1 SEI
stefan.ballmer@LIGO.ORG - posted 16:53, Wednesday 16 April 2014 (11394)
ETMX ISI tripped
While switching blends back to TCrappy

It continues to trip as I am trying to bring it back, basically as soon as I reset the watchdog it trips again.  

this is sheila

Images attached to this report
H1 SEI
hugo.paris@LIGO.ORG - posted 16:03, Wednesday 16 April 2014 - last comment - 14:37, Friday 18 April 2014(11391)
BSC-ETMY - Performance

JimW and I worked on getting the performance of BSC-EY comparable to the performance of BSC-EX, before handing off to SUS.

BSC-EY now has the following control tools installed:

We compared the performance of BSC-EY with the performance of BSC-EX, with both platforms under BSC-EX's most used configuration:

Attached Plots show comparable performance of the ISIs, at the projected suspension point, for similar ground motion at both end stations. (plots calibrated in nm and nrad).

One can notice a 10Hz peak, on BSC-EY spectra. We went ahead and took performance spectra at EY with the Isolation off. The peak is also there when the isolation and damping loops are off. Hence, the peak seen at 10Hz is neither caused, nor amplified, by the ISI active controls.

Since SUS provides plenty of isolation at 10Hz, we decided to give them the go ahead to start their testing.


Meanwhile, JimW and I kept investigating. We noticed that HEPI L4Cs were seeing the 10Hz peak too, and that it is mostly seen on the vertical L4Cs (see Page 1 of last attachment). We were able to reduce this peak's amplitude by a factor of ~10 by simply turning HEPI position loops off (see Page 2 of last attachment). It looks like HEPI-EY position loops are somehow amplifying the 10Hz peak, but they are not its source, as the peak still appears clearly with HEPI off.

Non-image files attached to this report
Comments related to this report
hugo.paris@LIGO.ORG - 14:37, Friday 18 April 2014 (11442)

I previously wrote that the ~10Hz peak was mostly seen on the vertical L4Cs, while it is actually seen on the Horizontal L4Cs.

H1 SUS (AOS, ISC, SYS)
jeffrey.kissel@LIGO.ORG - posted 15:26, Wednesday 16 April 2014 - last comment - 15:47, Wednesday 16 April 2014(11392)
H1 SUS ETMY UIM & PUM Coils Balanced
J. Kissel

Thanks to Thomas' incremental improvements to the H1 SUS ETMY optical lever (see LHO aLOGs 11356 & 11387), he got the noise low enough that we were comfortable pushing forward with the large suite of measurements needed to get the QUAD ready for ISC use. the first on this list is the coil balancing on the middle two stages, which has now been completed (following instructions in LHO aLOGs 9453, 9079 and parameters taken from LHO aLOG 10493) with the results below.

The final balanced gains are

H1 SUS ETMY
Channel     Balanced COILOUTF Gain
L1 UL            -0.957
L1 LL            +1.021
L1 UR            +0.976
L1 LR            -1.042

L2 UL            +0.964
L2 LL            -1.039
L2 UR            -0.959
L2 LR            +1.034

The SNR was particular good this time around (thanks to TBetter instead of TCrappy filters on the ISI? [Less wind/ better ground motion]), so I was able to determine these values to 0.25% (instead of the usual 0.5%). The first page of each attachment shows the ASDs of the optical lever signals during a pringle drive at each respective stage, before and after balancing. The second page compares the coherence between blanaced and unbalanced. In summary,

   DOF                  Reduction Factor @ 4.1 [Hz]
L1 Pringle to L3 P           > 9.4               (peak is in the noise, and only ~70% coherent)
L1 Pringle to L3 Y             38 

L2 Pringle to L3 P           > 1.8               (peak is in the noise, totally incoherent)
L2 Pringle to L3 Y             33

Now we begin measuring L P Y of each stage to P&Y of the test mass, to gather all data necessary for 
- iStage L to test mass P&Y for frequency dependent length to angle decoupling, 
- iStage P to test mass Y & iStage Y to test mass P for frequency dependent alignment decoupling, and 
- iStage P to test mass P & iStage Y to test mass Y for alignment plant compensation.
Non-image files attached to this report
Comments related to this report
jeffrey.kissel@LIGO.ORG - 15:47, Wednesday 16 April 2014 (11393)
Measurement Details
-------------------

Coil Driver Configuration:
       BIO State    Compensation
UIM        1             ON
PUM       -2            OFF

Demodulator filters used:
SIG band pass: BP4.0Hz = butter("BandPass",2,3.5,4.0)
DEMOD I & Q low-pass: CLP50mHz = cheby1("LowPass",2,3,0.05)

Demodulator Drive Parameters (for both measurements)
   Freq [Hz]     Amp [ct]     Sin [ct]    Cos [ct]
P   4.0          115000         10000     10000
Y   4.0          115000         10000     10000

SEI Configuration (for both measurements):
HPI: Level 1 Isolation, "Pos" position sensor only blend filters
ST1: Level 3 Isolation, "TBetter" blend filters (in all DOFs)
ST2: Level 3 Isolation, "TBetter" blend filters (in all DOFs)

Measured using a 200 second average (shorter than yesterday) of the demodulated signals, i.e.
tdsavg 200 H1:SUS-ETMX_LKIN_P_DEMOD_I_OUT H1:SUS-ETMX_LKIN_P_DEMOD_Q_OUT H1:SUS-ETMX_LKIN_Y_DEMOD_I_OUT H1:SUS-ETMX_LKIN_Y_DEMOD_Q_OUT

H1 ETMX L1
     Demod Phase [deg]          Unbalanced Value [ct]    Balanced Value [ct]
P       77            I         +1.311 pm ~0.2           -0.017 pm ~0.2
                      Q         -0.157 pm ~0.2           -0.132 pm ~0.2
Y       78            I         -9.510 pm ~0.2           -0.063 pm ~0.2
                      Q         -0.243 pm ~0.2           -0.236 pm ~0.2

H1 ETMX L2
     Demod Phase [deg]          Unbalanced Value [ct]    Balanced Value [ct]
P       -33.5         I         -0.243 pm ~0.5           -0.044 pm ~0.5
                      Q         -0.060 pm ~0.5           -0.003 pm ~0.5
Y       -33.5         I         -3.874 pm ~0.5           -0.041 pm ~0.5
                      Q          0.267 pm ~0.5           -0.121 pm ~0.5
note that the quote pm values are the by-eye, peak-to-peak amplitude of the demodulated signal which oscillates with a ~25 sec period. I quote values to a much higher precision because I'm averaging over 200 seconds.

To perturb the PIT or YAW balancing by 5%, 1%, 0.5%, and then by 0.25%:
/ligo/svncommon/SusSVN/sus/trunk/Common/PythonTools/perturbcoilbalance_fourosem.py H1 ETMX L1 [PIT/YAW] [0.05/0.01/0.005/0.0025]
/ligo/svncommon/SusSVN/sus/trunk/Common/PythonTools/perturbcoilbalance_fourosem.py H1 ETMX L2 [PIT/YAW] [0.05/0.01/0.005/0.0025]

Exact balanced values:
Measured using a simple command line caget, i.e.
caget H1:SUS-ETMX_L2_COILOUTF_UL_GAIN H1:SUS-ETMX_L2_COILOUTF_LL_GAIN H1:SUS-ETMX_L2_COILOUTF_UR_GAIN H1:SUS-ETMX_L2_COILOUTF_LR_GAIN

H1 ETMX L1
 Coil     COILOUTF Gain
UL         -0.957006
LL         +1.02136
UR         +0.976339
LR         -1.04199

H1 ETMX L2
 Coil     COILOUTF Gain
UL         -0.964279
LL         +1.03047
UR         +0.95947
LR         -1.03428
Of course, these values are set at arbitrary precession, they're rounded to the values quoted in the main entry (a) because the measurement uncertainty is no better than 0.25%, and (b) the MEDM screen does not display out to higher precession, so further precision would not be visible.
H1 PSL
sheila.dwyer@LIGO.ORG - posted 14:13, Wednesday 16 April 2014 (11390)
PSL back to science mode


H1 SEI (INS)
hugh.radkins@LIGO.ORG - posted 13:44, Wednesday 16 April 2014 (11389)
WHAM5 SEI HEPI Activities/Status--6 Actuators Attached, 2 to go

Scott & I got the last Horizontal L4C leveled and then a few more Actuators attached.  Should complete this initial install tomorrow morning.  IAS in the afternoon.  I say initial because commissioning may find some details that need addressing.

H1 ISC
sheila.dwyer@LIGO.ORG - posted 12:33, Wednesday 16 April 2014 (11381)
X arm transmission increased

Since the Faraday swap on monday, we have more green power. 

On the table we measured 50mW going towards the chamber, where previously we had measured 47mW (6% increase).  On QPD A we had a 10% increase in the sum, on QPD B a 30% increase in the sum.

Alexa and I measured 19uW arriving on ISCT1, compared to 12 uW measured in alog 9191 ( 60% increase from January)

We also noticed that the beam quality was better than it had been.  We measured some profiles, it is a guassian beam, they will be attached to this post later.

When the arm is locked we see a 35% increase in the transmitted power measured by the COMM BBPD, compared to last week. 

Non-image files attached to this report
H1 ISC
daniel.sigg@LIGO.ORG - posted 11:49, Wednesday 16 April 2014 (11385)
VCO Phase Noise

We measured the phase noise of the low noise VCO. We used the COMM PLL which deploys a single stage frequency-difference divider (FDD). The PLL was locked to a fixed frequency oscillator (ifr locked to GPS running at 78.95 MHz). The output filters of the PLL were: boost engaged, generic disabled, VCO comp off and low pass off. We added a SR560 with 3 kHz low pass and a gain of 10 to clean up the high frequency part. We then looked at the error point of the common mode board (H1:LSC-REFL_SERVO_ERROR). The calibration is as follows:

25kHz/V (VCO sensitivity) / 25 (boost gain) * 5 (gain divider in VCO output path) / 10 (SR560 gain) / 100 (gain in ERROR readback) * 1V/3200cts = 0.0016 V/cts

For the SSB (single-sided sidebands) we divided by an other sqrt(2). This plot matches nicely to the high frequency SSB curve measured in T0900451. Above 100 Hz we see some excess phase noise which is most likely due to the ifr. The two curves together characterize the low noise VCO all the way from 1 mHz up to 100 kHz. To get the phase noise of the VCO without the FDD we can just multiply the attached curve by 10.

The rms frequency noise of the VCO was previously measured in alogs 6972 and 6865. The numbers were 2 Hz rms for a VCO with FDD and 16 Hz for a VCO without. This is in good agreement with the current measurement.

Non-image files attached to this report
H1 SEI
patrick.thomas@LIGO.ORG - posted 11:15, Wednesday 16 April 2014 (11388)
ETMY ISI ACT watchdog trip plot


Images attached to this report
H1 General
travis.sadecki@LIGO.ORG - posted 10:51, Wednesday 16 April 2014 (11384)
HEPI/Cleanroom interference at BSC1 and BSC3

Although it seems the watchdog trips at the ITMs are understood, there is now another variable to consider.  The cleanroom that has been inserted into the beer garden for the upcoming ITM swaps has some of it's curtains draped over the HEPI crossbeams.  With the cleanroom not currently running and no plans to move the cleanroom in the near future, the interference should be rather static.  See pics for a reference to the extent of the interference (and let us know if it is a problem).

Images attached to this report
H1 SEI
patrick.thomas@LIGO.ORG - posted 09:46, Wednesday 16 April 2014 (11382)
ITMX ISI watchdog trip plots
Possibly due to craning in the LVEA.
Images attached to this report
H1 SEI
patrick.thomas@LIGO.ORG - posted 09:00, Wednesday 16 April 2014 (11378)
ETMX ISI L4C watchdog trip plot
Tripped April 15 17:10:34 PDT.
Images attached to this report
H1 TCS
david.hosken@LIGO.ORG - posted 17:32, Tuesday 15 April 2014 - last comment - 09:35, Wednesday 16 April 2014(11372)
TCS update/status
DavidH, Greg, Thomas

TCSX: Plumbing sorted (except for one last connection to water-cooled beam dump, awaiting fittings), optics mounted and optical mounts are positioned on the table ready for alignment. Optics that are not within table are accounted for. Last few cables are to be connected.

TCSY: Enclosure re-cleaned, plumbing connected up (except for beam dump) and water manifolds in final positions, laser/RF driver cables are all dressed and connected to feed-throughs.

See images for current TCSX/Y table layouts
Images attached to this report
Comments related to this report
justin.bergman@LIGO.ORG - 06:45, Wednesday 16 April 2014 (11374)

Have we located the keys for the table door locks?

greg.grabeel@LIGO.ORG - 09:35, Wednesday 16 April 2014 (11380)
They were found in the enclosure after David was able to tidy up.
H1 SEI
stefan.ballmer@LIGO.ORG - posted 16:35, Tuesday 15 April 2014 - last comment - 08:57, Wednesday 16 April 2014(11368)
ITMX and ETMX damping now
ITMX and ETMX ISIs are damping now, so that seismic people (Rich) can get an input spectrum on a windy day. I will be walking around the end station optics table, but quietly. 

Sheila
Comments related to this report
sheila.dwyer@LIGO.ORG - 08:57, Wednesday 16 April 2014 (11377)

Don't know why it tripped

Images attached to this comment
H1 IOO (ISC)
kiwamu.izumi@LIGO.ORG - posted 14:27, Tuesday 15 April 2014 - last comment - 08:33, Wednesday 16 April 2014(11359)
IMC was not locking, fixed by steering PZT pit

[Sheila, Kiwamu]

Sheila had a difficulty in relocking the IMC. So I looked into it to figure out what is happening and fixed it by steering the PZT pit.

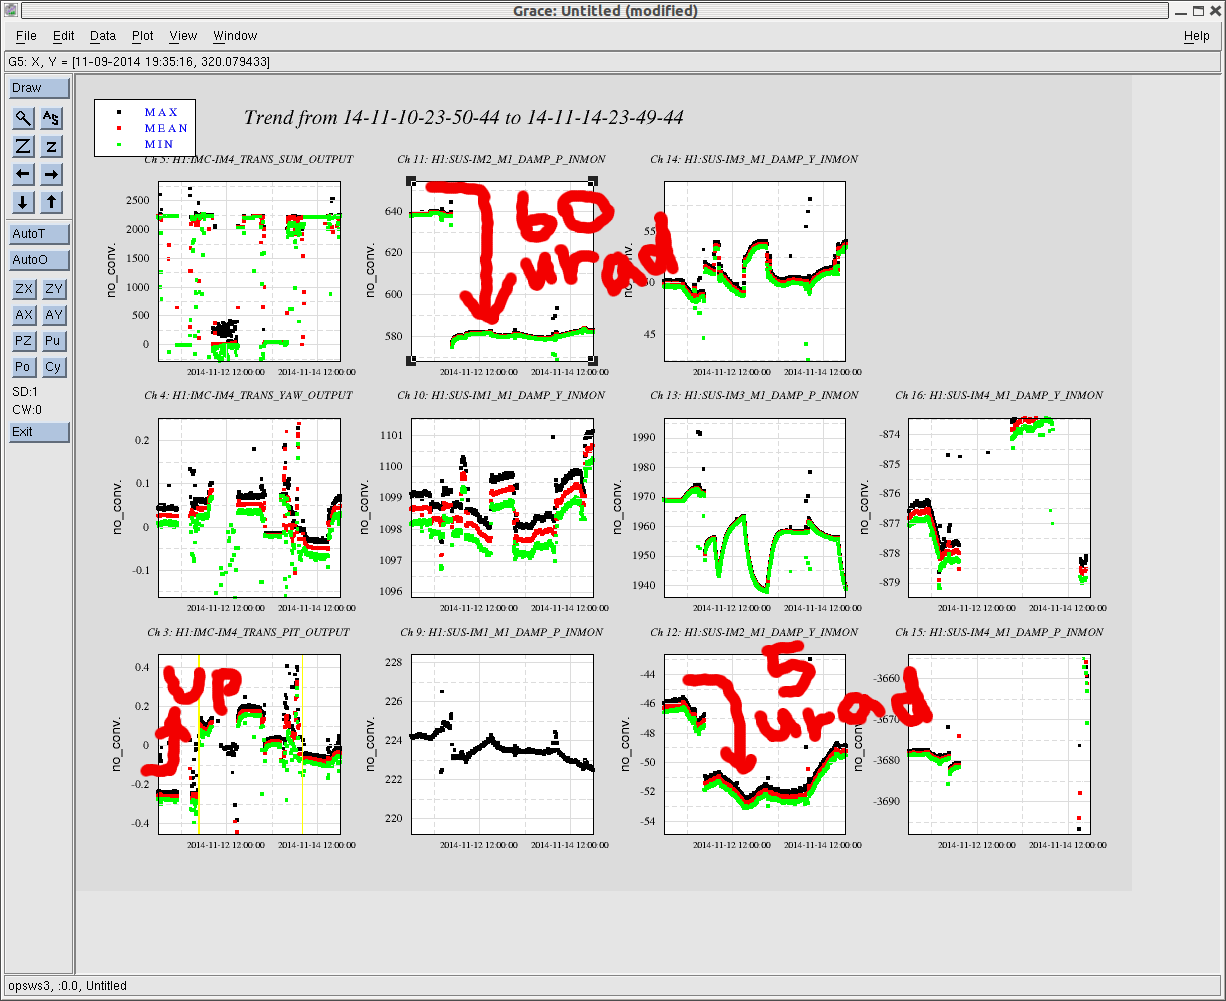
It was apparently due to a misalginment, mainly in pitch according to the GigE views. Looking at one-day trend, I found that the PZT pit suddenly had changed its value from 400 to -240 counts at around 8:20 am local. A mysterious point is that , after the PZT jumped, the IMC was still able to lock itself for approximately 4 hours.Then it ran into a situation where it was not able to hit the LSC trigger. I didn't see a significant drift in any of the MC suspensions. I fixed it by steering the pitch of PZT back to +300 counts. It relocked right away and we ran the offload script so that it doesn't loose the good alignment by a unclok. We should keep our eyes on this PZT.

The attached is the one day trend.

Images attached to this report
Comments related to this report
daniel.sigg@LIGO.ORG - 08:33, Wednesday 16 April 2014 (11376)

I changed the PZT offsets this morning to account for the temperature drop in the laser room over night. Robert then increased the nominal, so it is expected that the alignment shifts back towards the older settings. The correct way is to use the centroid of the reflected beam when not locked and steer the PZT to the same position. Dave added theses channels to the frame, so they can be trended (if you can figure out how they are named). We probably should add an error condition to the IMC locker which checks this at the beginning.

H1 SEI (AOS, SUS)
sheila.dwyer@LIGO.ORG - posted 09:41, Tuesday 15 April 2014 - last comment - 11:07, Wednesday 16 April 2014(11344)
X arm opLev spectra

Here are spectra of the ETMX and ITMX oplevs.  All blends are on Tbetter, sensor correction was on for ETMX and off for ITMX. 

We are bothered right now by large amplitude motion (around 1urad pp) in yaw at very low frequencies.

Images attached to this report
Comments related to this report
thomas.vo@LIGO.ORG - 14:04, Tuesday 15 April 2014 (11356)AOS, SEI, SUS
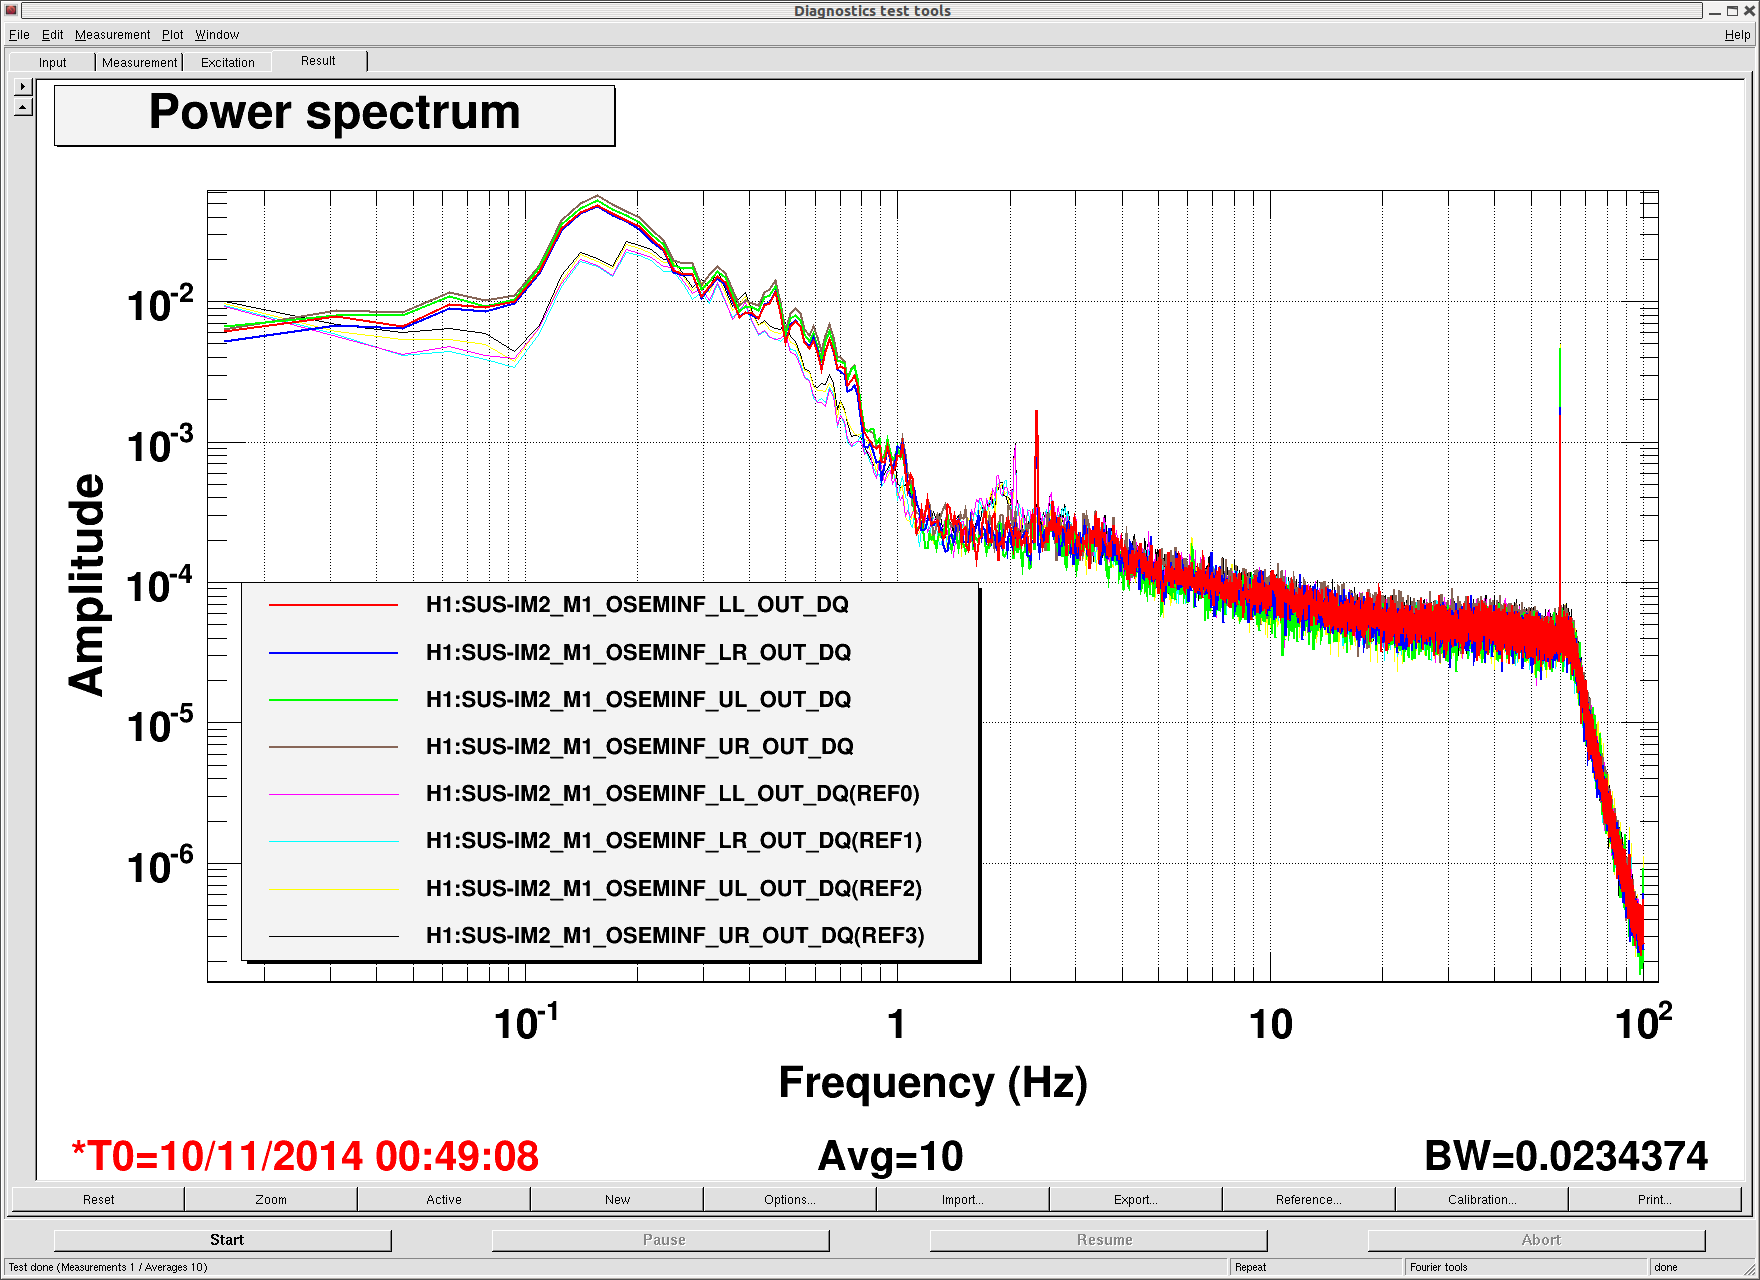
We've seen this on ITMY before and changing out the laser seemed to fix the problem.  I've attached some graphs indicating more clearly what might be occurring.  The time series indicates that the power is dropping on all quadrants in with 20 second intervals; although this is very difficult to see by looking at the normalized pit and yaw signals,you can see it very clearly when looking at the individual segments.  Similarly, in the spectra, there is only a small indication at 1.0-2.0 Hz that something weird may be going on but when we look at an individual segment, you can see weird spikes starting at 0.056 Hz and then the harmonics following through to higher frequencies.  For comparison, I included the ETMX Segment1 spectra and you can see that we shouldn't see those spikes.
I'll be investigating this today but my first guess would be either the laser or laser power that's causing a dip in power every 20 seconds, which is pretty odd because we got this laser new "off the shelf" from microlasers.
Images attached to this comment
Non-image files attached to this comment
thomas.vo@LIGO.ORG - 11:07, Wednesday 16 April 2014 (11387)AOS, SUS

Some improvement but still oscillatiing a bit.

I've attached new spectra comparing the WIT sensors and the optical lever to show that we can see real motion of the optic for the coil balancing procedure that the SUS team is trying to perform.  Also attached is the comparison between ETMX and ETMY, although the ISIs are in a different state, we can see that they are comparable.  The last image attached is a trend showing that we still see this power oscillation with a peak to peak of about 240 counts with a period of ~3 seconds.  This is much better than the p-to-p of 2500 counts every 19-20 seconds in the previous laser configuration.

Trying to hunt down the exact noise source proved to take longer than I thought it would.  I ended up switching between three  variables and chooising the best configuration: The laser, the power supply, and the outlet.  We have not switched this laser to run with the power board yet but once we implment this change, it'd be interesting to see if this oscillation goes away or gets worse.  Richard thinks that the noise comes from the thermo-electric coolers in the laser itself, in which case switching to the power board probably will probably not change this artifact.

Images attached to this comment
LHO VE
rainer.weiss@LIGO.ORG - posted 21:25, Monday 14 April 2014 - last comment - 10:59, Wednesday 16 April 2014(11340)
Results from the y2 accumulation 04/10/2014
The hydrogen outgassing rate measured is 75% of that measured in 2000. The atmospheric accumulation is about
6.9 x 10^-8 torr liters/sec and seems high relative to that in y1 and the accumulations made at LLO. The value suggests
a small leak. If this is in the beamtube it is at the threshold of not being able to be found with our
current techniques.

The results of the accumulation were more difficult to calculate and have more uncertainty due to the method of 
connecting the RGA to the beamtube. The connection was made by a corrugated small diameter tube rather than a mount
directly on the beamtube. The pumping speed of the tube and the pumping speed of the RGA as an ion pump need to
be accounted for. The attached pdf file shows the influence of the connecting tube and presents the results.
Non-image files attached to this report
Comments related to this report
michael.zucker@LIGO.ORG - 04:16, Tuesday 15 April 2014 (11341)
Yep, this level of air leak would be challenging to locate by current techniques. It's probably small enough not to directly impact sensitivity, but it seems important to establish whether there's a degradation process at work, like LLO Y. 

We should consider a repeat accumulation, perhaps with three sampling points along the 2km module. 
john.worden@LIGO.ORG - 10:50, Tuesday 15 April 2014 (11348)

I estimate some 3000 cm^2 of viton in the large valves exposed to this volume. This may account for some of the air. Anyone know the outgassing rate of viton after 140,000 hours under vacuum?

We should probably reconfigure the RGA to eliminate local orings and the low conductance of the flex hose. Kyle and I felt we had nothing to loose by trying the quick and dirty method first. Practice makes better.

john.worden@LIGO.ORG - 10:59, Wednesday 16 April 2014 (11386)

Correction on the surface of viton contained in the LN pumps and large gate valves.

There are 4 gate orings entirely in the vacuum (45 inch diam) and 2 gate orings 1/2 exposed at the closed gate valves(45inch).

There are 4 flange orings 1/2 exposed where the gate valves bolt to the ln pumps(45 inch diam)

There are 2 bonnet seal orings 1/2 exposed in the two gate valves open to the volume - each is 144 inch long.

Total surface area ~ 6970 cm^2

If the entire air leak is allocated to this we get an outgassing rate for the viton of 1e^-11 tl/sec/cm^2.


H1 SUS
arnaud.pele@LIGO.ORG - posted 16:57, Thursday 30 May 2013 - last comment - 09:59, Wednesday 16 April 2014(6552)
MCs Phase 3b

MC1 MC2 and MC3 Phase 3b M1 to M1 transfer functions have been measured over the past weekend. They all show good agreement with model and previous measurements.

The attached files are showing comparison between model, phase 3a and 3b (except for MC2 3b vs 3b)

MC1 (allhstss_2013-05-29_Phase3b_H1MC1_ALL_TFs.pdf)

MC2 (allhsts_2013-05-29_Phase3b_H1MC2_ALL_TFs.pdf)

MC3 (allhsts_2013-05-29_Phase3b_H1MC3_ALL_TFs.pdf)


files and data have been commited on the svn under the following directories :
/ligo/svncommon/SusSVN/sus/trunk/HSTS/Common/{MatlabTools/Data}
/ligo/svncommon/SusSVN/sus/trunk/HSTS/H1/${MC1/MC2/MC3}/SAGM1/${Data/Results}
 

Non-image files attached to this report
Comments related to this report
arnaud.pele@LIGO.ORG - 09:59, Wednesday 16 April 2014 (11383)

All of those top stage transfer functions look good.
The only thing to note is that MC2 has its pitch (1Hz) and roll modes (1.5Hz) coupled into the vertical mode as seen on the 3rd page of the 2nd pdf. It is significantly reduced by the damping
This coupling increased after pump down (orange/pink vs cyan/green).

Images attached to this comment
Displaying reports 71981-72000 of 83038.Go to page Start 3596 3597 3598 3599 3600 3601 3602 3603 3604 End