J. Kissel, B. Shapiro
The summary says most of it -- we've confirmed with two degrees of freedom of top to top transfer functions. Our best candidate is that the temperature in the VEA is too high. I tried adding a vertical offset in either direction, in hopes that we have enough range to recover the drooping, but it appears we do not. We'll first try restoring the XVEA temperature (if not surpassing it), but we may have to vent again. Cross your fingers.
Details:
Hoping that we could test the newly turned on H1 SUS ETMX ESD for functionailty, Brett and I noticed the optical lever did not appear centered in either the misaligned or aligned state. We could only restore the optical lever centering by putting the alignment offsets at
P Y
Force Realignment +21.3 -122.9
Original Aligned +417.0 77.2
Change +395.7 200.1
Further, I noticed that a P request would cause both P and Y motion, and vice versa.
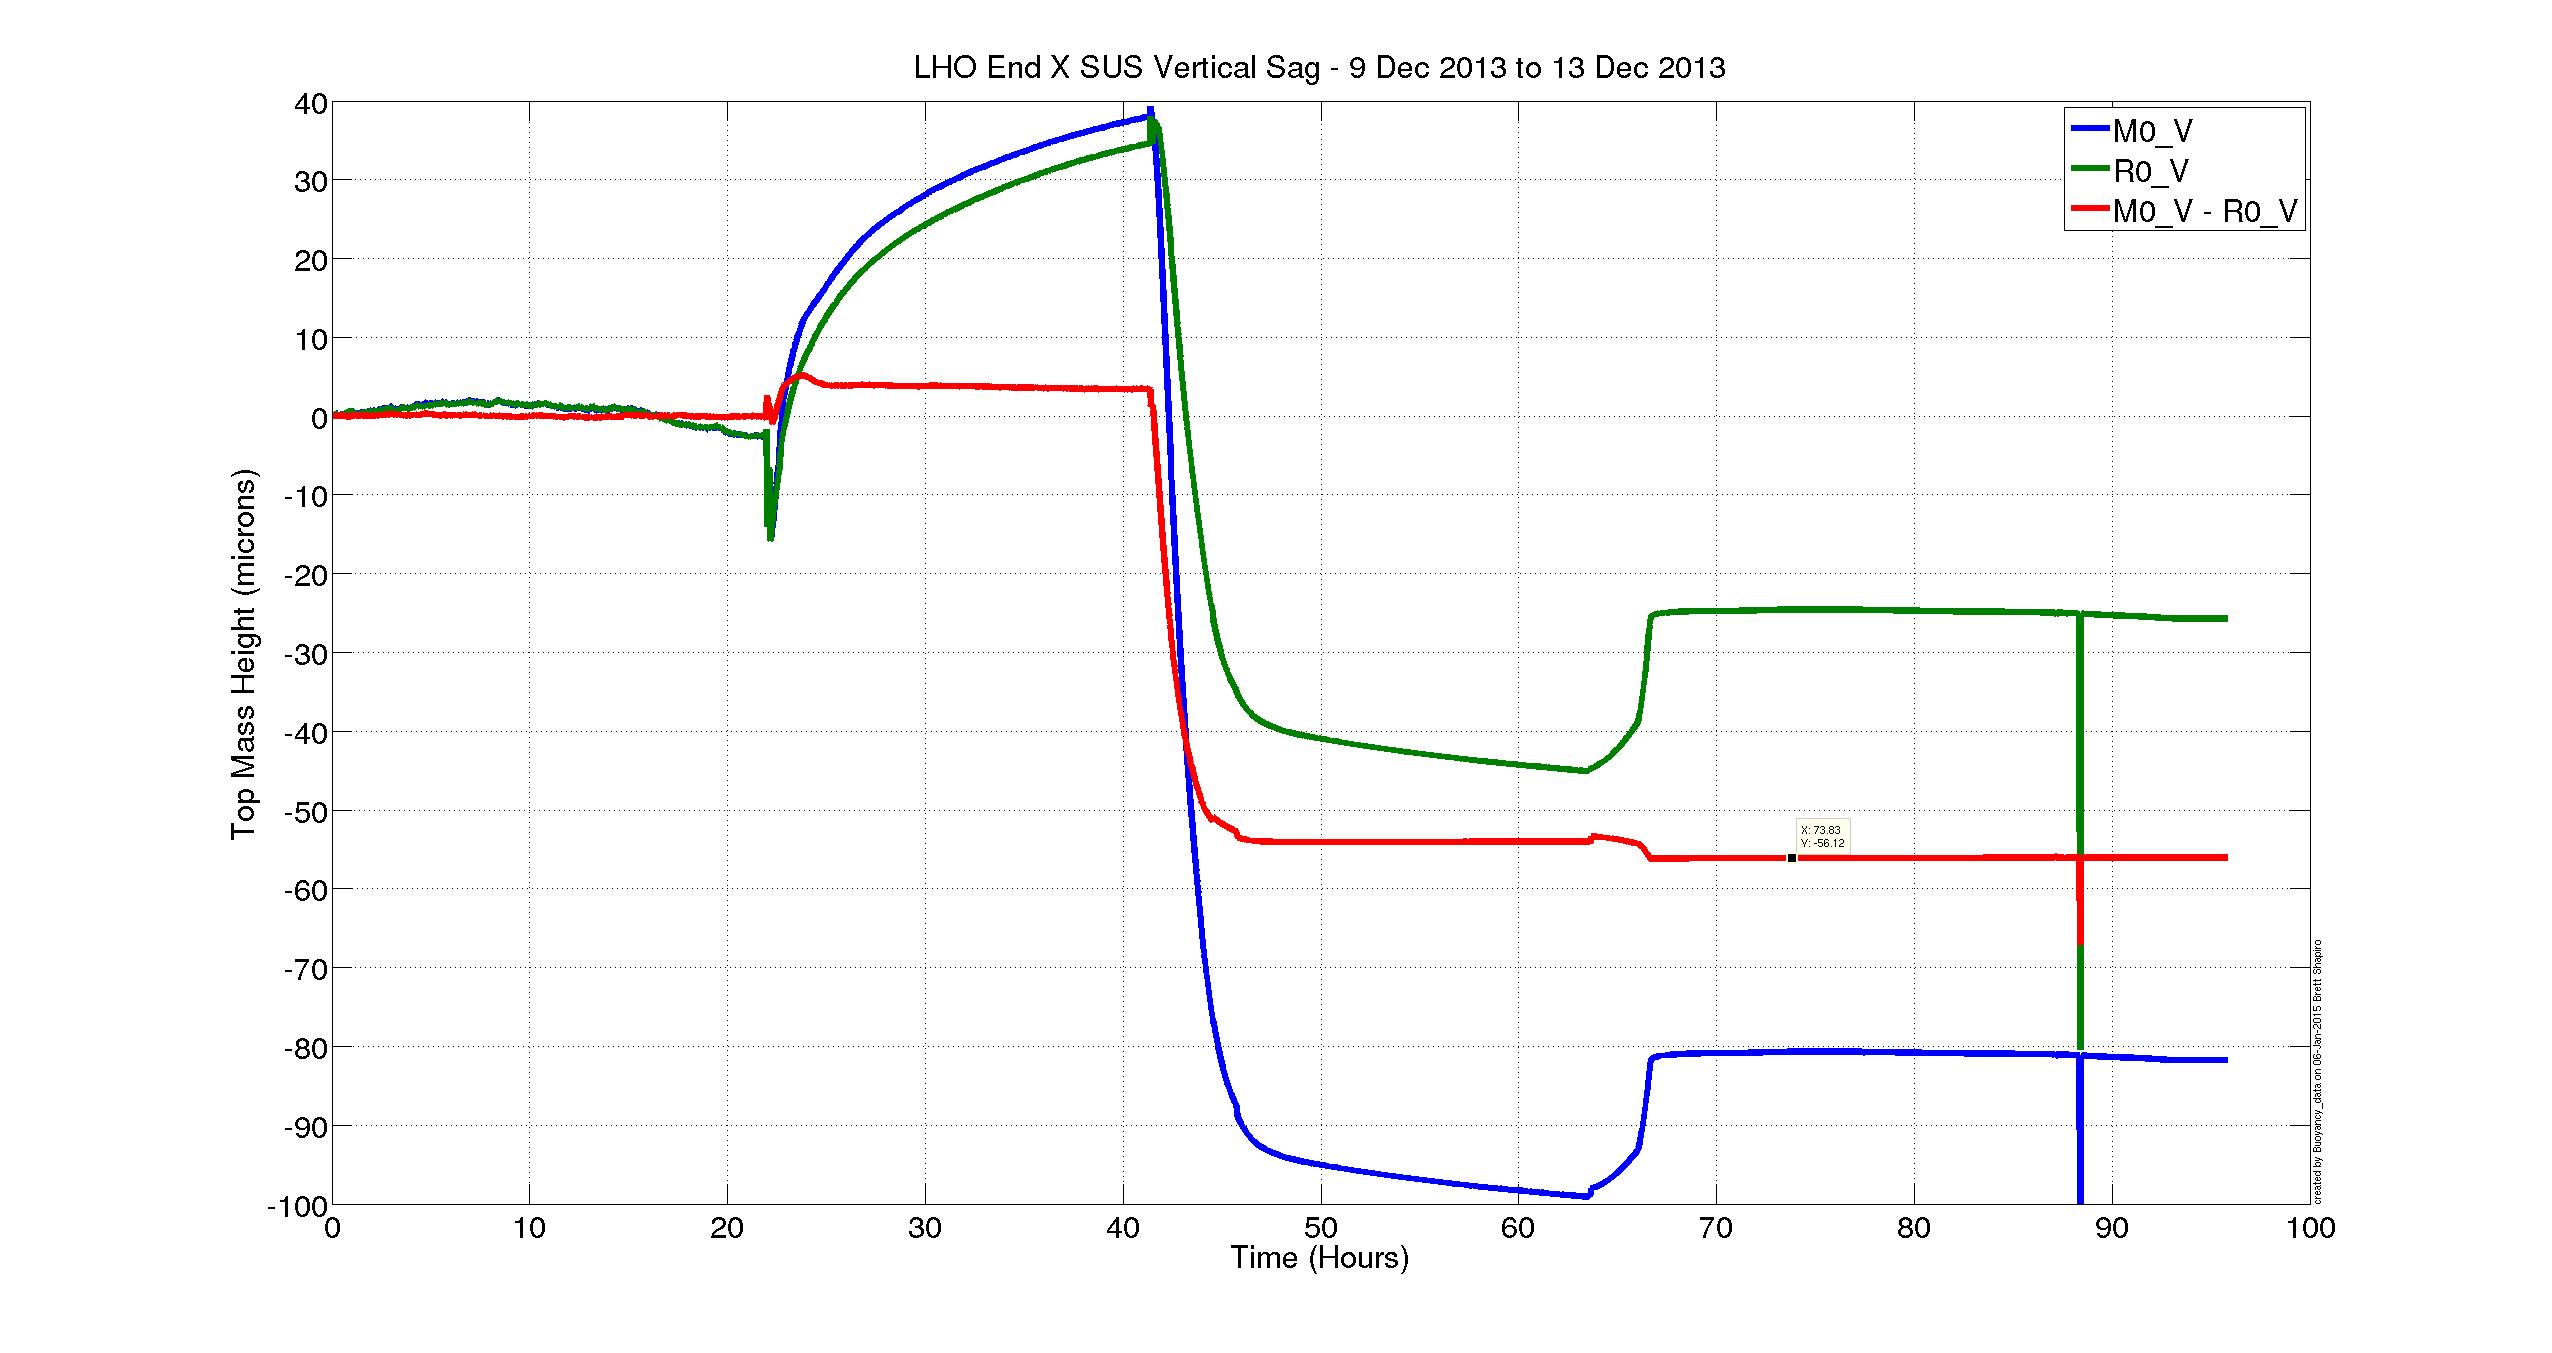
Betsy then trended the temperature in the VEA, see LHO aLOG 15877, and found it ~2 [deg F] or ~1 [deg C], which corresponds to about 100 [um] sag at the TOP mass (see T1400749, specifically LLO aLOG 15636. I note that this is at the TOP mass, because the lower stages will sag MORE, since there are cascading vertical blade springs.
We then, in the interest of time, took the transfer functions we know are the most sensitive to rubbing: P to P and V to V. These transfer functions are attached, for the various vertical offsets applied; see 2015-01-05_2358_H1SUSETMX_M0_Mono_WhiteNoise_*_0p01to50Hz.pdf. The vertical offsets were +/- 200 000 [ct], equivalent to most of the DAC range, which is roughly +/-115 [um_pk]. We can clearly see that the first several modes have shifted significantly, and several DOFs are cross-coupled in. Notable, however, is the highest-frequency modes are unaffected. This implies that the top-mass is free, and the lower masses are restricted, as seen in a QUAD's mode shapes. This makes sense, because for this most recent cleaning (see LHO aLOG 15744), the *only* activity in chamber was to clamp the test mass briefly for cleaning. Further, sadly, even with 100+ [um] of displacement in vertical, we could not move the the suspension free.
Note, we checked the reaction chain with P and V TFs, and it appears free and clear (see 2015-01-06_0152_H1SUSETMX_R0_WhiteNoise.pdf). We did not check the TMS, since it was not touched.
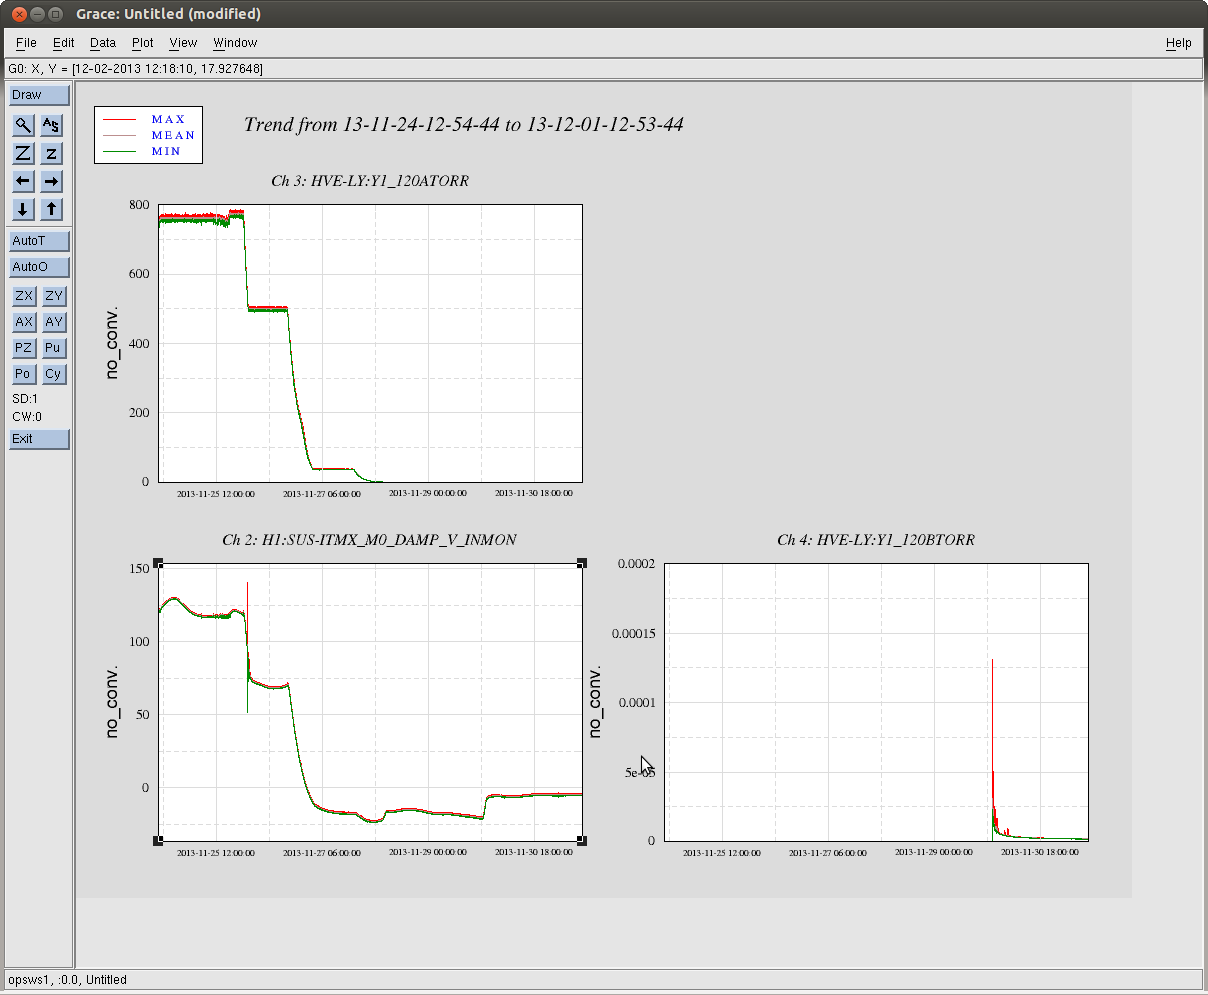
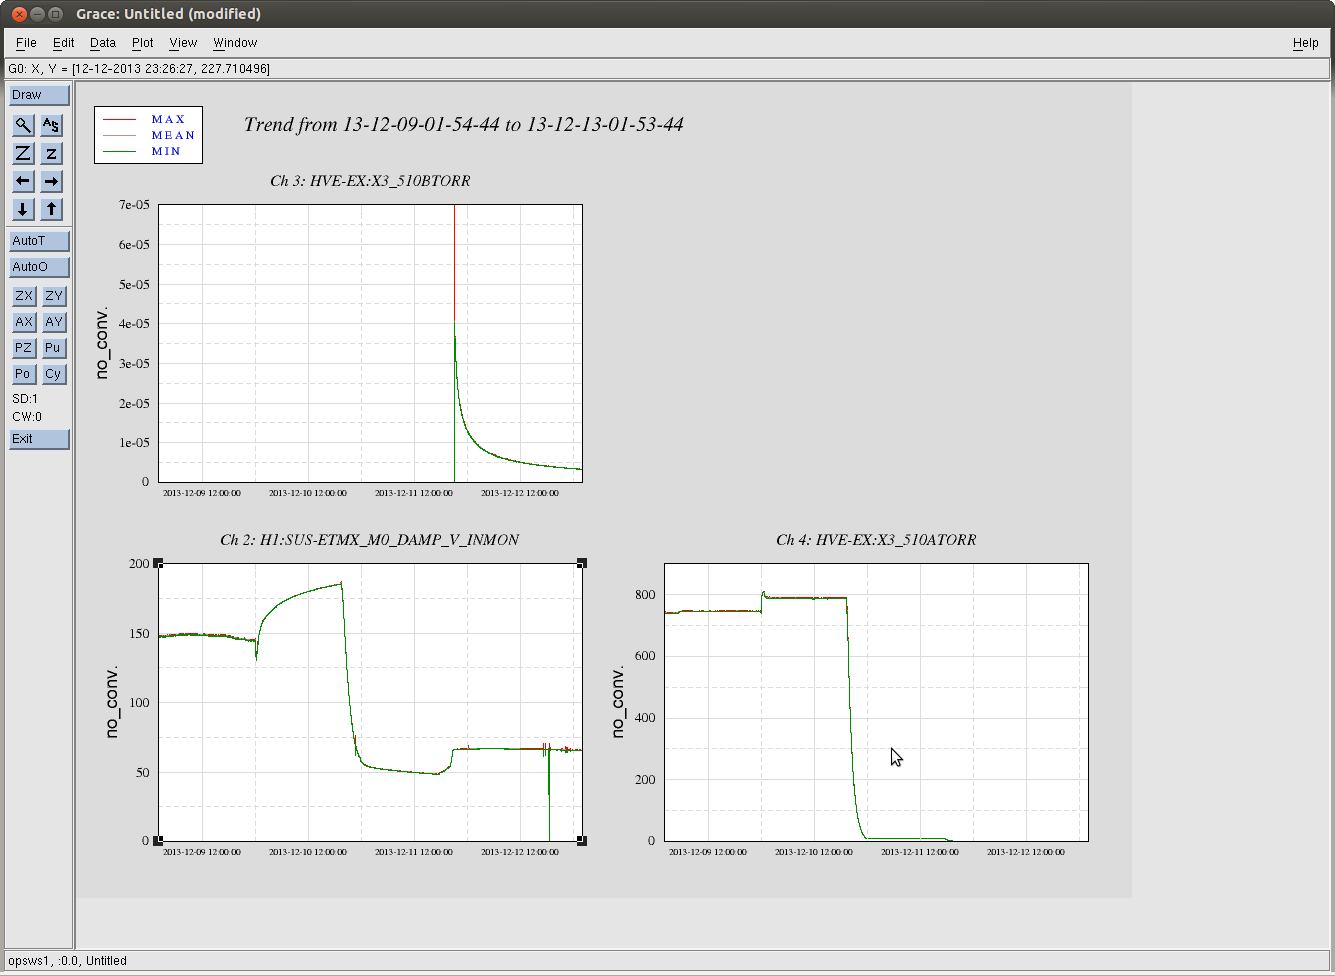
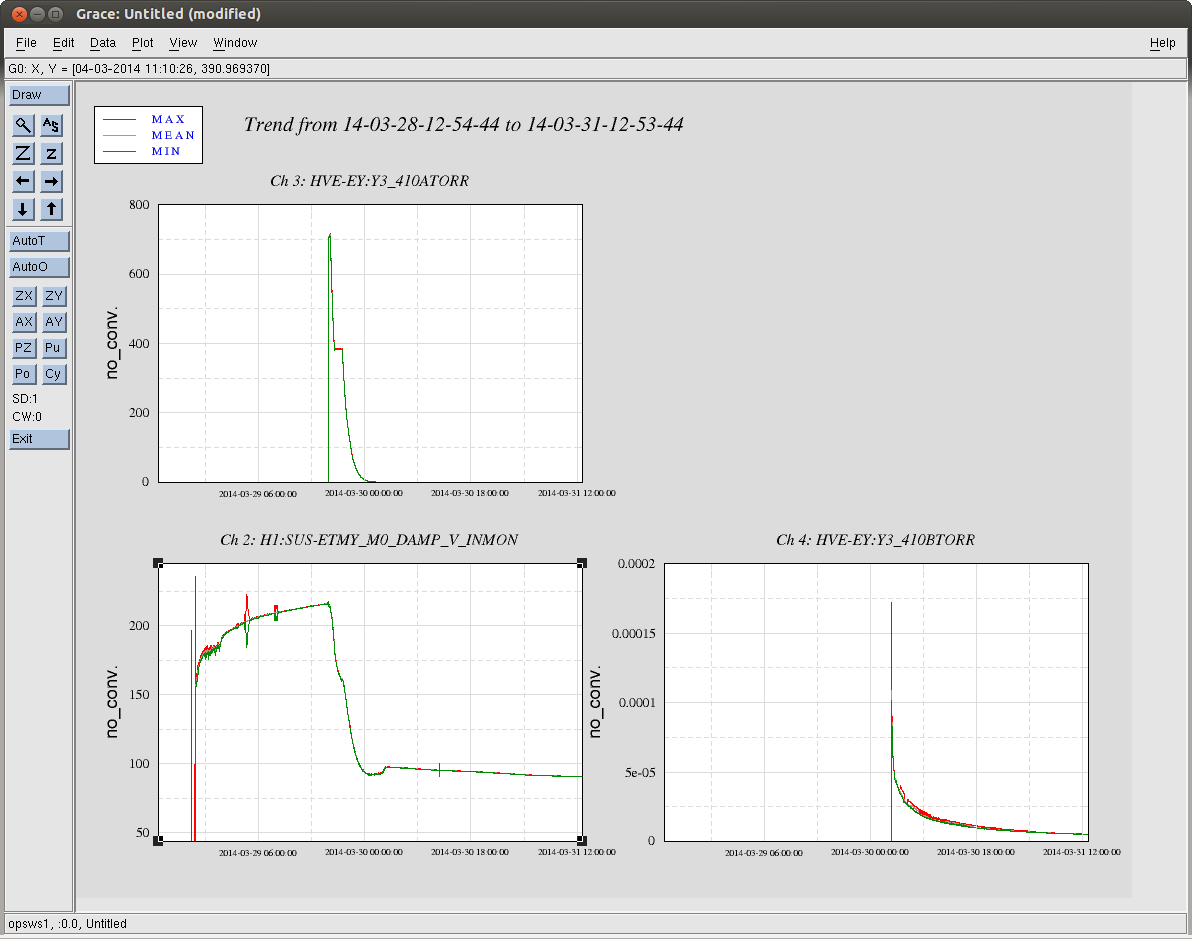
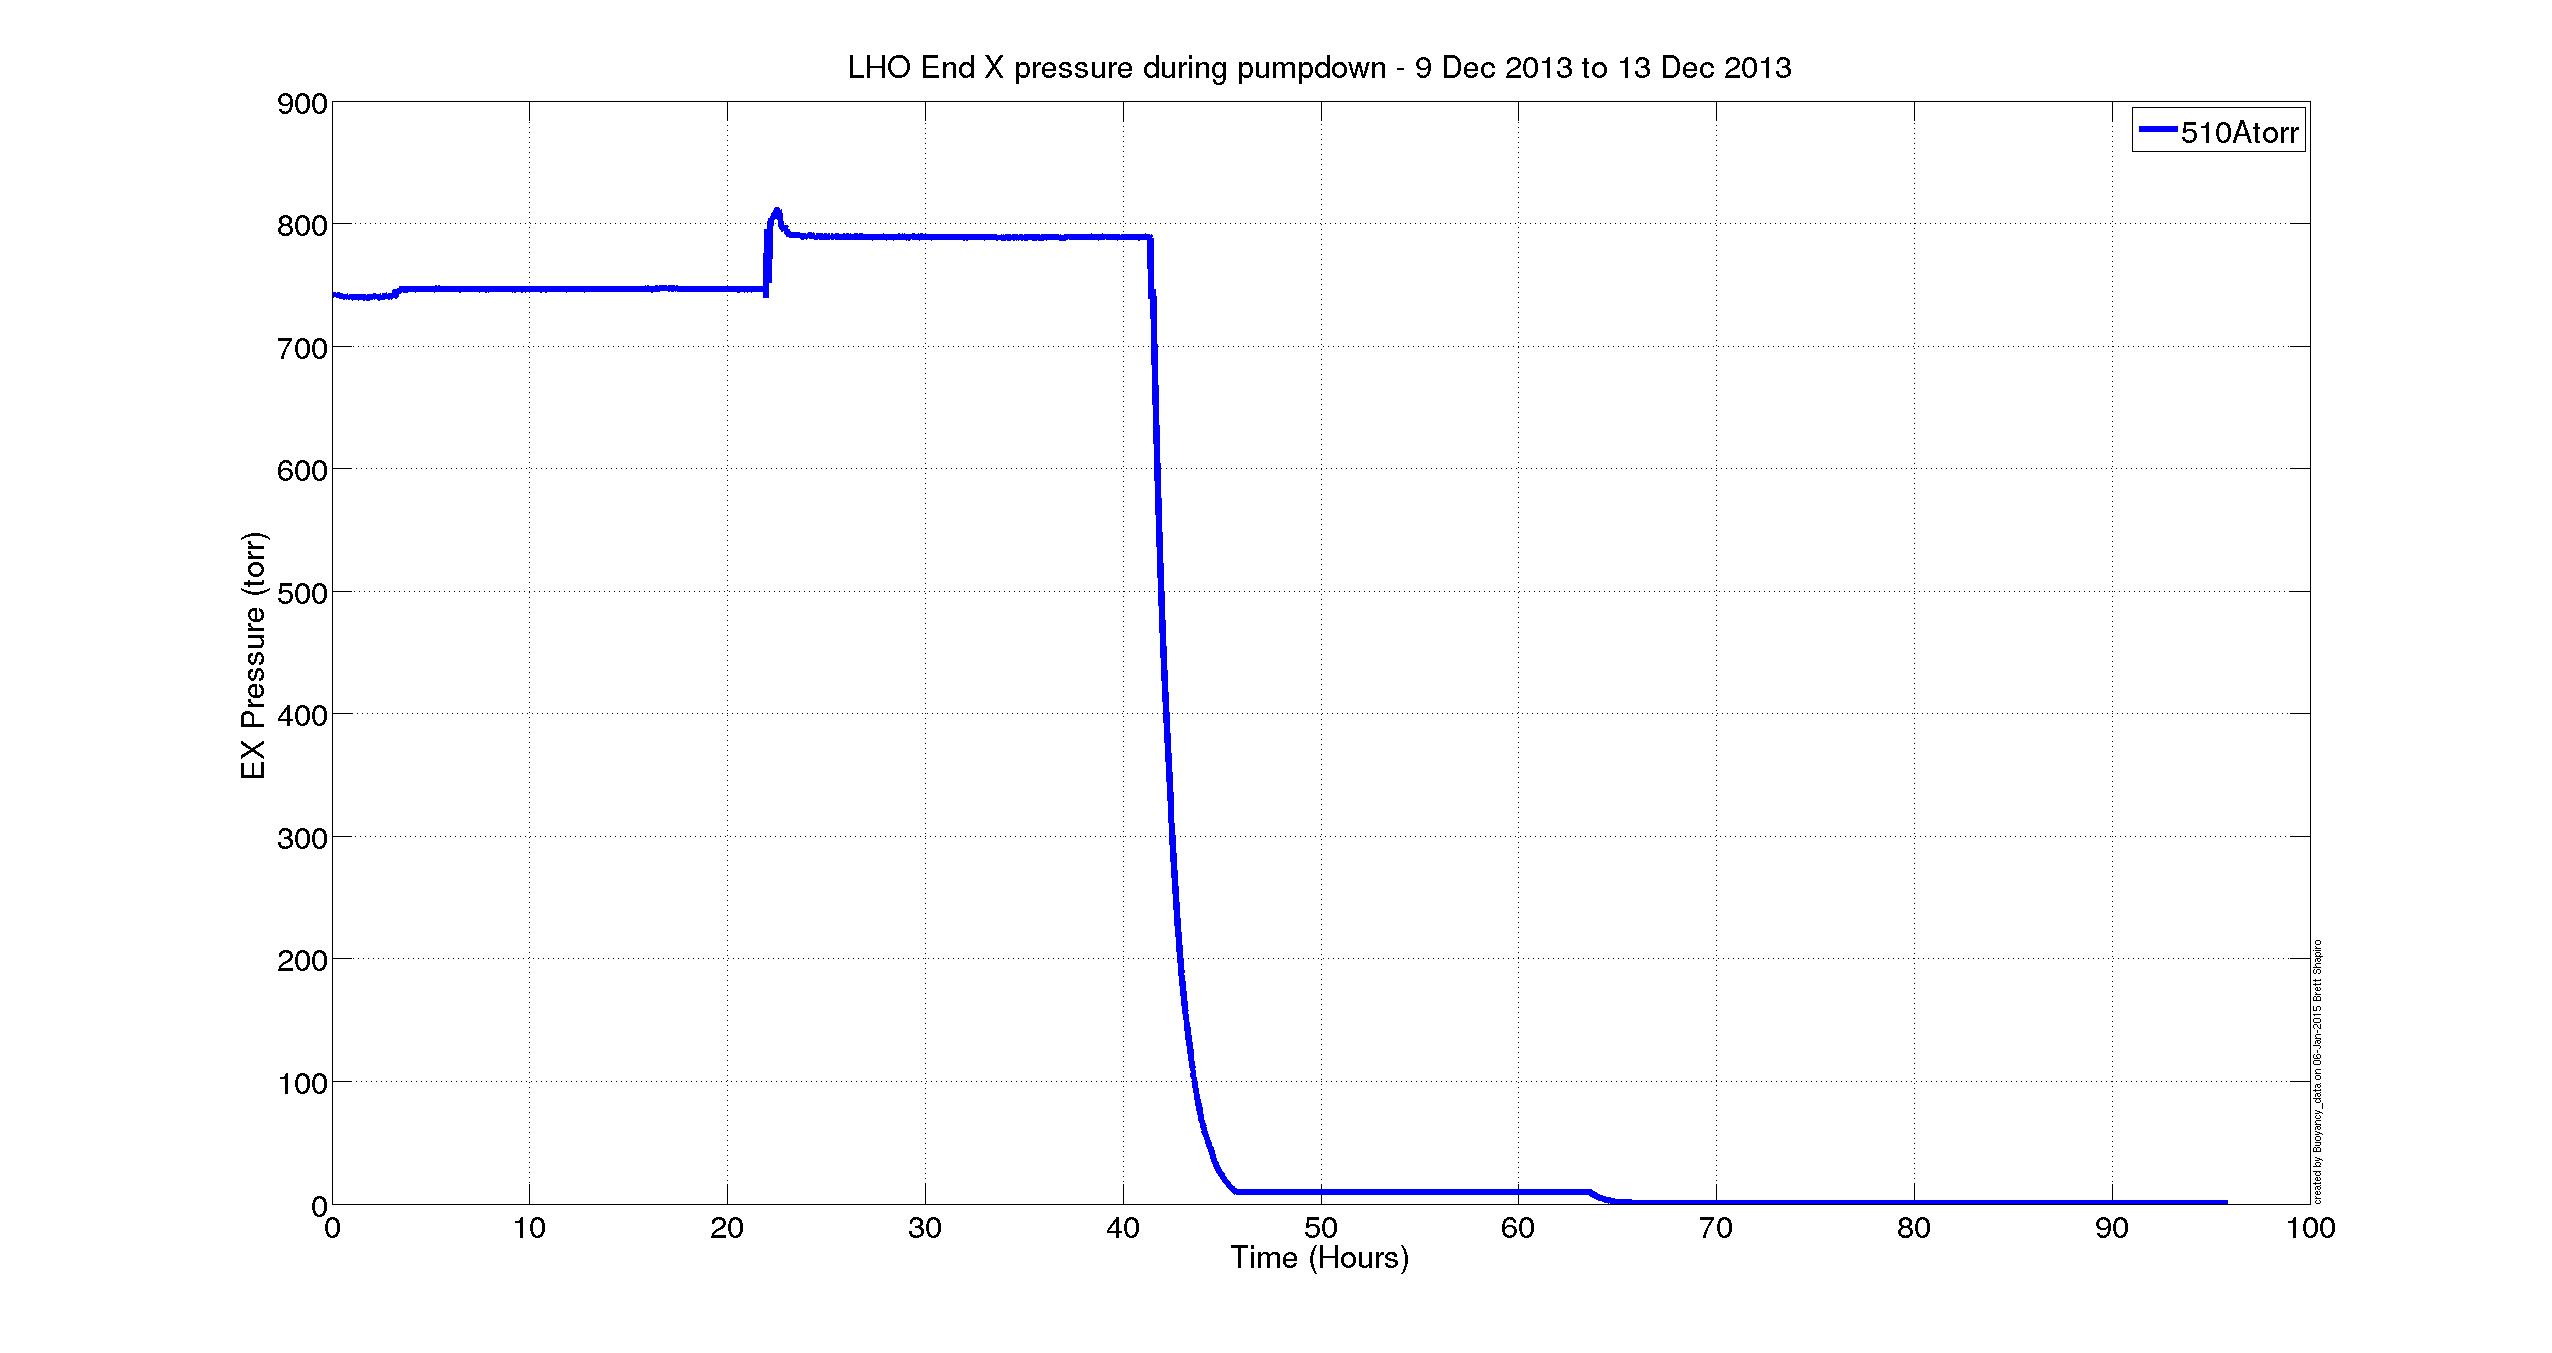
Finally, because we were amazed that the SUS had sagged more that 100 [um], and that we know that Betsy set the EQ stops when the VEA was at ~70 [deg C], Brett compared the top-mass displacement of the main chain, reaction chain, and TMS to gauge the amount of displacement compared to the other SUS in the chamber, which should have roughly comparable sag because they've the same blade springs and overall suspended mass (roughly). We attach two trends, EX_SAG_21DecTo5Jan.png (a 15 day trend that includes the pump down) and EX_SAG_22DecTo5Jan.jpg (a 14 day trend to zoom in on the long term temperature equilibration). From the 21st, one can see that the removal of air [the first big sharp drop], caused all SUS to drop. However, the main chain is expected to drop 170 [um] (see T1100616), and the reaction is expected to drop 100 [um]. While the reaction chain drops as expected, the main chain only drops ~125 [um], indicating a sort of bottoming out. Further, from the 22nd's trend, we see the temperature dependence is different (the bias has been removed for clarity).
So, again. Bad news. Hopefully we can pull this SUS back up with temperature!


Initial Alignment
We also had some problems running the PRM_ALIGN and SRM_ALIGN via the ISC_DOF guardian. The PRM_ALIGN takes a while to bleed off from the M3 to the M1 stage, and thus to offload. We tried going back to the old version of PRM_ALIGN in which we only feed the wfs back to M1; however, we did not succueed -- a lot of settings had been changed and we could not remember the old configuration; we didn't spend too much time trying to debug. We also ended up aliging SRM by hand which turned out to be faster. We should take some time and look at these scripts since a lot has been changed.
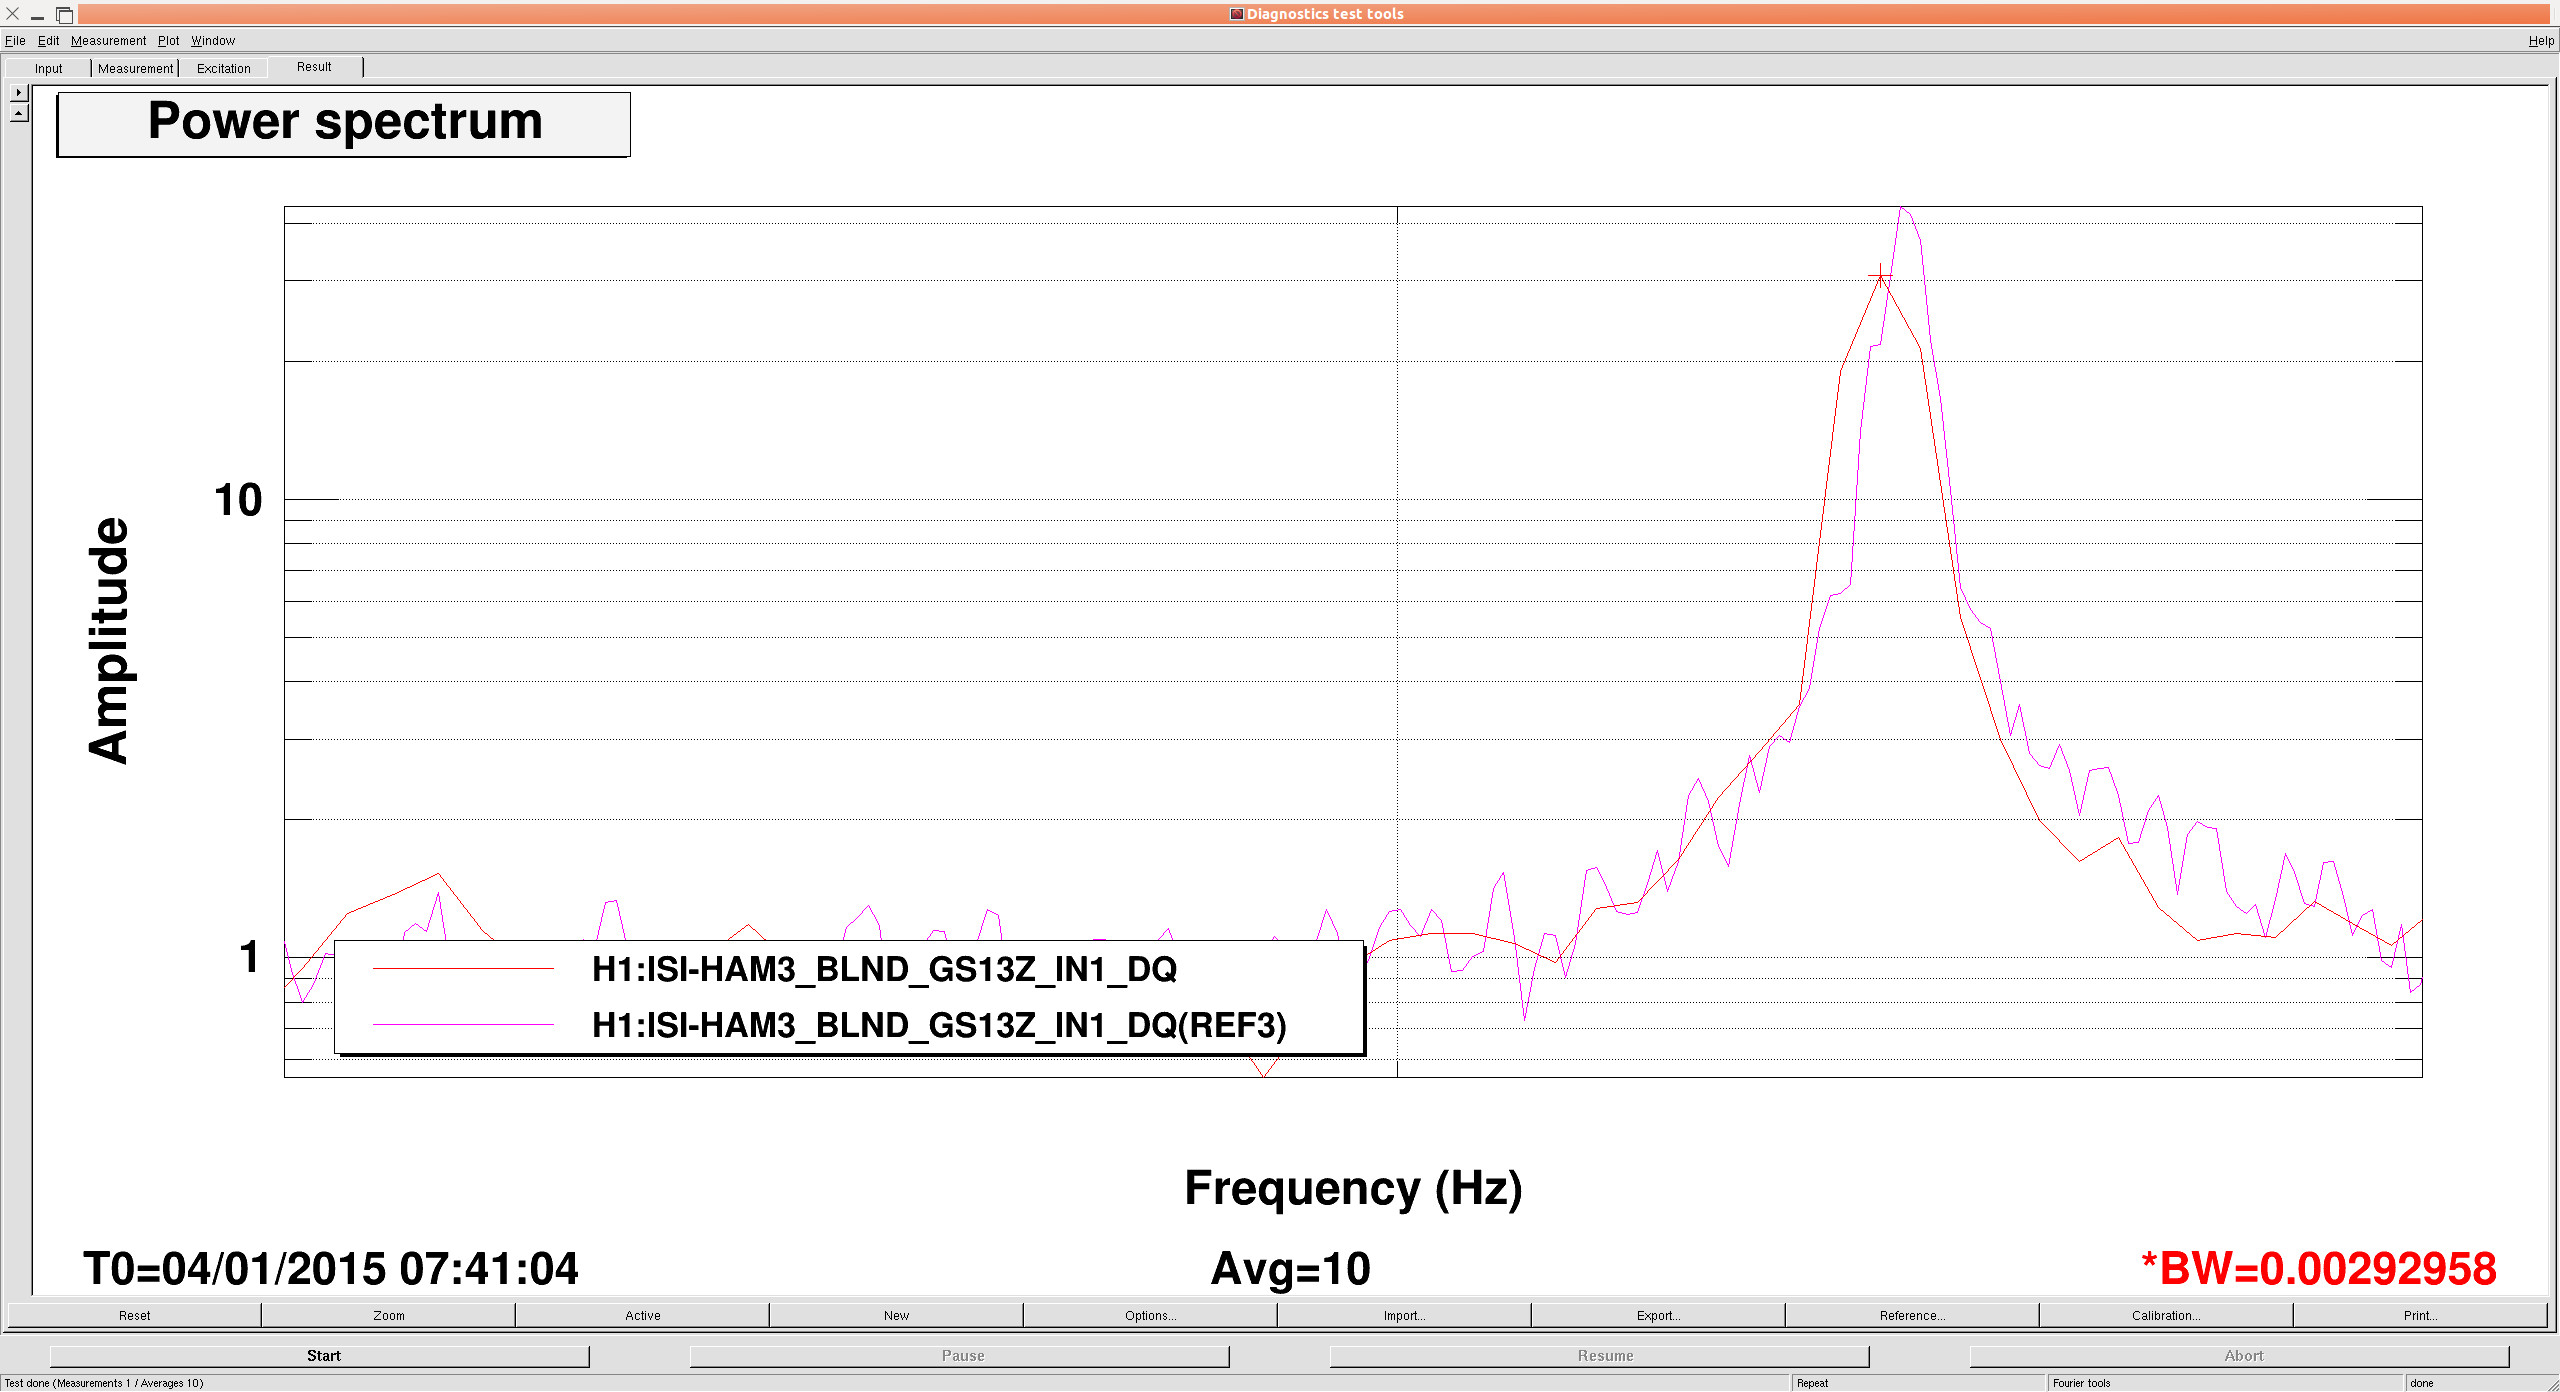
BBPD spectrum taken. -12dB coupling has already been compensated. Note that the removal of one of the BBPD preamps reduced the PD gain by ~20dB.
Condition:
H1:LSC-REFLAIR_B_LF_INMON 17000+/-2000
H1:LSC-REFLAIR_B_LF_OUTPUT 17.8+/-0.2 mW
H1:LSC-POPAIR_B_RF18_I_MON 350+/-5
H1:PSL—PERISCOPE_A_DC_POWERMON 10620+/-20